

Quantitative Trait Locus Analysis of Mating Behavior and Male Sex Pheromones in Nasonia Wasps
- PMID: 27172207
- PMCID: PMC4889652
- DOI: 10.1534/g3.116.029074
Quantitative Trait Locus Analysis of Mating Behavior and Male Sex Pheromones in Nasonia Wasps
Abstract
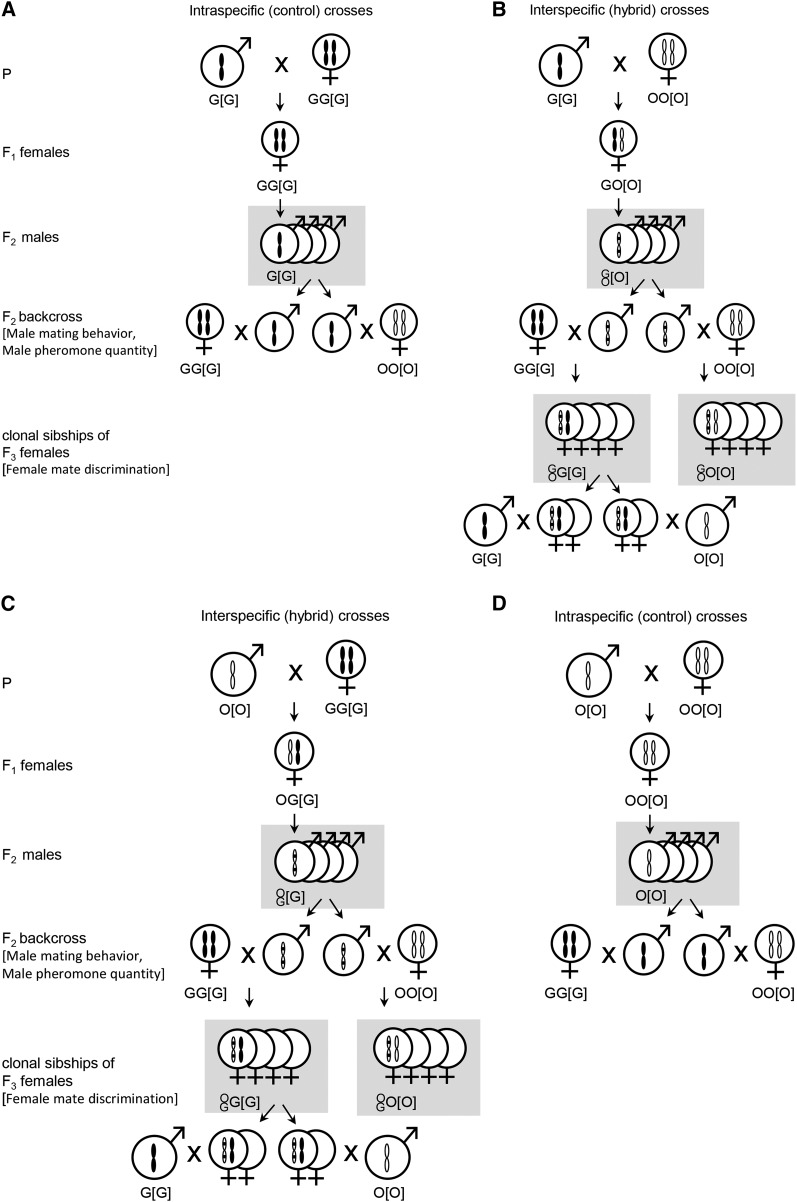
A major focus in speciation genetics is to identify the chromosomal regions and genes that reduce hybridization and gene flow. We investigated the genetic architecture of mating behavior in the parasitoid wasp species pair Nasonia giraulti and Nasonia oneida that exhibit strong prezygotic isolation. Behavioral analysis showed that N. oneida females had consistently higher latency times, and broke off the mating sequence more often in the mounting stage when confronted with N. giraulti males compared with males of their own species. N. oneida males produce a lower quantity of the long-range male sex pheromone (4R,5S)-5-hydroxy-4-decanolide (RS-HDL). Crosses between the two species yielded hybrid males with various pheromone quantities, and these males were used in mating trials with females of either species to measure female mate discrimination rates. A quantitative trait locus (QTL) analysis involving 475 recombinant hybrid males (F2), 2148 reciprocally backcrossed females (F3), and a linkage map of 52 equally spaced neutral single nucleotide polymorphism (SNP) markers plus SNPs in 40 candidate mating behavior genes revealed four QTL for male pheromone amount, depending on partner species. Our results demonstrate that the RS-HDL pheromone plays a role in the mating system of N. giraulti and N. oneida, but also that additional communication cues are involved in mate choice. No QTL were found for female mate discrimination, which points at a polygenic architecture of female choice with strong environmental influences.
Keywords: Nasonia courtship; QTL analysis; female choice; sex pheromone; speciation.
Copyright © 2016 Diao et al.
Figures


Similar articles
-
Behavioral and genetic characteristics of a new species of Nasonia.Heredity (Edinb). 2010 Mar;104(3):278-88. doi: 10.1038/hdy.2009.147. Epub 2010 Jan 20. Heredity (Edinb). 2010. PMID: 20087394 Free PMC article.
-
A male sex pheromone in a parasitic wasp and control of the behavioral response by the female's mating status.J Exp Biol. 2007 Jun;210(Pt 12):2163-9. doi: 10.1242/jeb.02789. J Exp Biol. 2007. PMID: 17562890
-
Pheromone diversification and age-dependent behavioural plasticity decrease interspecific mating costs in Nasonia.PLoS One. 2014 Feb 14;9(2):e89214. doi: 10.1371/journal.pone.0089214. eCollection 2014. PLoS One. 2014. PMID: 24551238 Free PMC article.
-
Spider sex pheromones: emission, reception, structures, and functions.Biol Rev Camb Philos Soc. 2007 Feb;82(1):27-48. doi: 10.1111/j.1469-185X.2006.00002.x. Biol Rev Camb Philos Soc. 2007. PMID: 17313523 Review.
-
The role of chemical communication in mate choice.Biol Rev Camb Philos Soc. 2007 May;82(2):265-89. doi: 10.1111/j.1469-185X.2007.00009.x. Biol Rev Camb Philos Soc. 2007. PMID: 17437561 Review.
Cited by
-
An optimized approach to germ-free rearing in the jewel wasp Nasonia.PeerJ. 2016 Aug 9;4:e2316. doi: 10.7717/peerj.2316. eCollection 2016. PeerJ. 2016. PMID: 27602283 Free PMC article.
-
The cranial gland system of Nasonia spp.: a link between chemical ecology, evo-devo, and descriptive taxonomy (Hymenoptera: Chalcidoidea).J Insect Sci. 2025 Mar 14;25(2):13. doi: 10.1093/jisesa/ieaf034. J Insect Sci. 2025. PMID: 40232241 Free PMC article.
-
Genetic dissection of assortative mating behavior.PLoS Biol. 2019 Feb 7;17(2):e2005902. doi: 10.1371/journal.pbio.2005902. eCollection 2019 Feb. PLoS Biol. 2019. PMID: 30730873 Free PMC article.
-
The genetics of mate preferences in hybrids between two young and sympatric Lake Victoria cichlid species.Proc Biol Sci. 2017 Feb 22;284(1849):20162332. doi: 10.1098/rspb.2016.2332. Proc Biol Sci. 2017. PMID: 28202807 Free PMC article.
-
Genome assembly and annotation of the parasitoid jewel wasp Nasonia oneida.Sci Data. 2025 Jul 1;12(1):1096. doi: 10.1038/s41597-025-05375-0. Sci Data. 2025. PMID: 40593889 Free PMC article.
References
-
- Arbuthnott D., 2009. The genetic architecture of insect courtship behavior and premating isolation. Heredity 103: 15–22. - PubMed
-
- Barton N. H., Gale K. S., 1993. Genetic analysis of hybrid zones, pp. 13–45 in Hybrid Zones and the Evolutionary Process, edited by R.G. Harrison Oxford University Press, New York.
-
- Beukeboom L. W., van den Assem J., 2001. Courtship and mating behavior of interspecific Nasonia hybrids (hymenoptera, pteromalidae): a grandfather effect. Behav. Genet. 31: 167–177. - PubMed
-
- Beukeboom L. W., van den Assem J., 2002. Courtship displays of introgressed, interspecific hybrid Nasonia males: further investigations into the ‘grandfather effect.’ Behaviour 139: 1029–1042.
Publication types
MeSH terms
Substances
LinkOut - more resources
Full Text Sources
Other Literature Sources
Miscellaneous