. 2016 Jul 5;7(27):41186-41202.
doi: 10.18632/oncotarget.9227.

Identifying and targeting determinants of melanoma cellular invasion

Affiliations

Identifying and targeting determinants of melanoma cellular invasion

Aparna Jayachandran et al. Oncotarget. .

Abstract

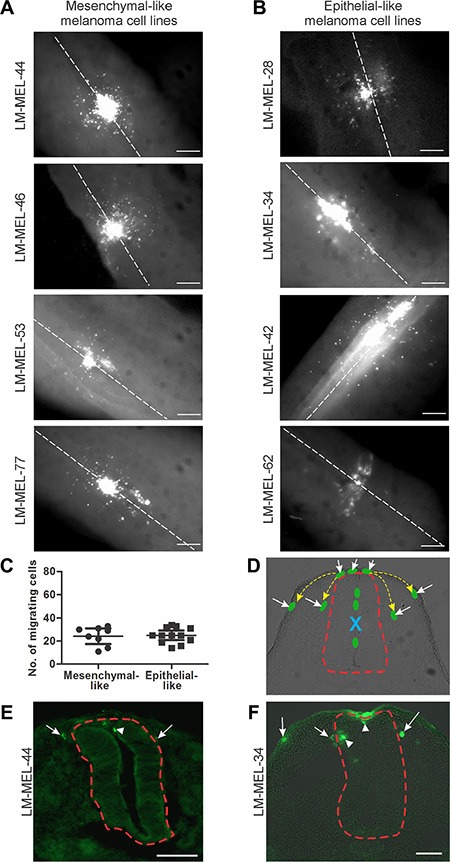
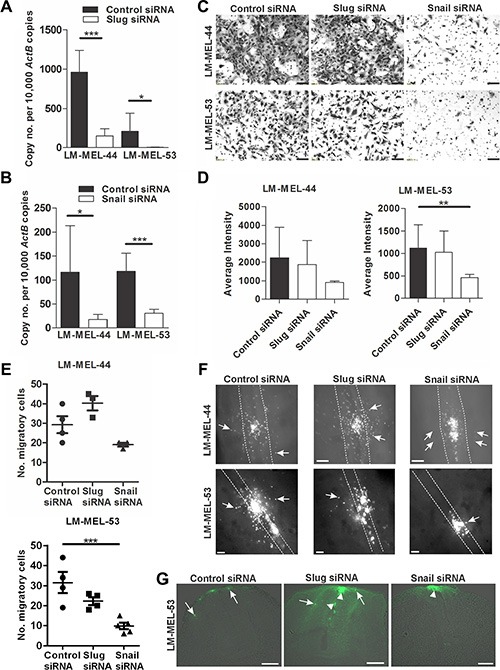
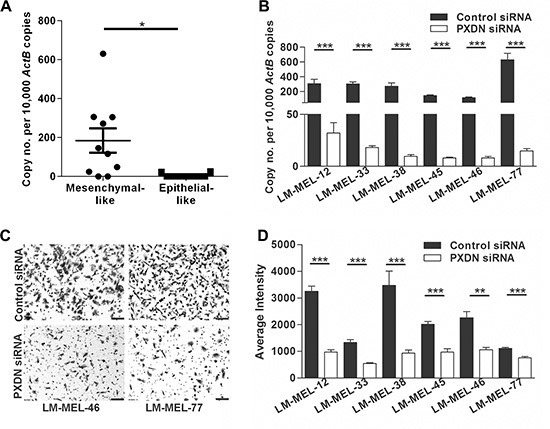
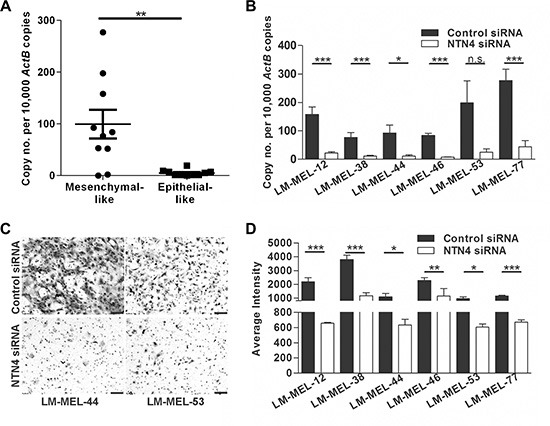
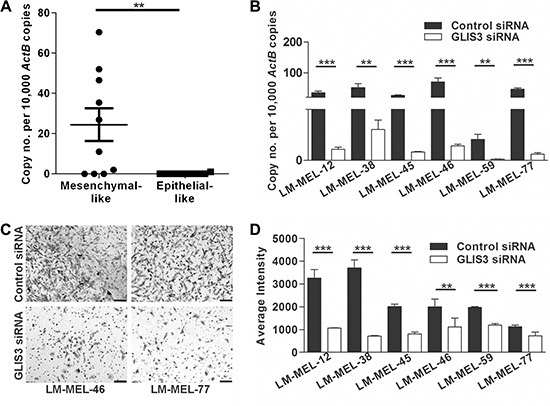
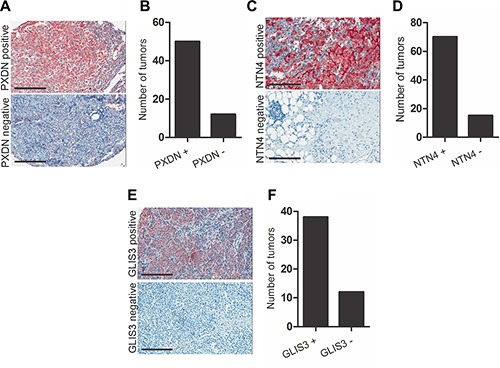
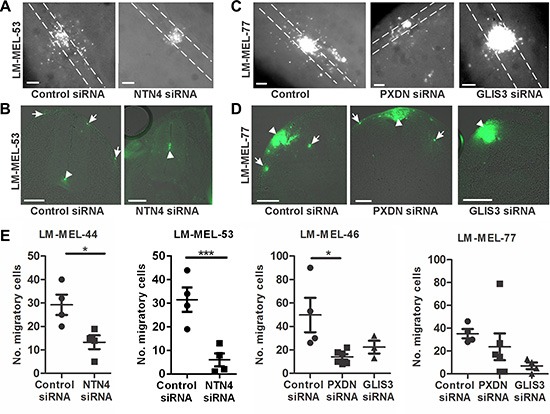
Epithelial-to-mesenchymal transition is a critical process that increases the malignant potential of melanoma by facilitating invasion and dissemination of tumor cells. This study identified genes involved in the regulation of cellular invasion and evaluated whether they can be targeted to inhibit melanoma invasion. We identified Peroxidasin (PXDN), Netrin 4 (NTN4) and GLIS Family Zinc Finger 3 (GLIS3) genes consistently elevated in invasive mesenchymal-like melanoma cells. These genes and proteins were highly expressed in metastatic melanoma tumors, and gene silencing led to reduced melanoma invasion in vitro. Furthermore, migration of PXDN, NTN4 or GLIS3 siRNA transfected melanoma cells was inhibited following transplantation into the embryonic chicken neural tube compared to control siRNA transfected melanoma cells. Our study suggests that PXDN, NTN4 and GLIS3 play a functional role in promoting melanoma cellular invasion, and therapeutic approaches directed toward inhibiting the action of these proteins may reduce the incidence or progression of metastasis in melanoma patients.

Keywords: embryonic chicken transplantation; epithelial-to-mesenchymal transition; invasion; melanoma.


Conflict of interest statement

None to declare.

Figures

Figure 1
Figure 1. Chick embryo confers invasive properties on poorly invasive melanoma cells
Melanoma cells were treated with CM-DiO and cultured as hanging drops to encourage aggregate formation. Similar sized aggregates were introduced into the neural tube of developing chicken and re-incubated within the egg for 2 days. Embryos injected with (A) mesenchymal-like melanoma cell lines LM- MEL-44, -46, -53 and -77 and (B) epithelial-like melanoma cell lines LM-MEL-28, -34, -42, and -62 were harvested and fluorescence pictures from whole-mounts taken (scale bar = 50 μm). White dotted line indicates the midline of the neural tube. (C) From wholemount images, the cells that migrated away from the neural tube were counted. There was no difference between the number of cells migrating from epithelial-like or mesenchymal-like cell lines. (D) Representative cross-section of chick embryo with schematic melanoma cells represented by green ovals. Yellow dotted arrows indicate typical migratory pathways of neural crest cells, underneath the ectoderm or by the neural tube. Red dotted line outlines the neural tube. Dorsal is to the top. Site of injection is indicated by blue X and the cells that have moved out of the neural tube are indicated by white arrows. (E, F) Cross-sections of trunk embryos showing location of melanoma cells (green) from mesenchymal-like cell line LM-MEL-44 (E) and epithelial-like melanoma cell line LM-MEL-34 (F). Arrows indicate motile melanoma cells located outside the neural tube and arrowheads indicate cells remaining inside the neural tube. The neural tube is outlined by a dotted red line. (scale bar = 100 μm).
Figure 2
Figure 2. Depletion of snail inhibits melanoma invasion in vitro and in vivo
Melanoma cells were plated out and transfected with either 10 nM control siRNA, Snail or Slug specific siRNA. After 72 h RNA was extracted and Slug (A) and Snail (B) qRT-PCR was performed on melanoma lines LM-MEL-44 and LM-MEL-53. Difference in gene expression was analysed using Student's t-test (*p < .05, ***p < .0005). Error bars indicate SEM of three experiments in triplicate. (C) Melanoma cells from LM-MEL-44 and -53 were transfected as described and seeded in a Matrigel coated transwell for 24 h. Cells that invaded the transwell membrane were stained with 1% crystal violet and representative images of the membrane were captured (scale bar = 100 μm). (D) Quantitative analysis of the number of invasive cells on the transwell membrane was determined by measuring the average intensities of invasive cells calculated in K counts mm2 using Odyssey Software. Error bars indicate SEM of three independent experiments in triplicate. Data was analysed using ANOVA with post-hoc Tukey test (**p < .005). (E–G) Melanoma cells were labelled with CM-DiO, transfected with the indicated siRNAs, cultured as hanging drops and introduced into the trunk neural tube of chicken embryos. After 2 days embryos were harvested and fluorescence pictures taken from whole-mounts. (E) The number of cells that migrated out of the neural tube was counted. Bars indicate mean +/− SEM. This data was combined with data using the same cell lines from Figure 7 and analysed using ANOVA with post-hoc Tukey test. Significantly fewer Snail siRNA treated cells migrated from the neural tube compared to control siRNA treated cells using LM-MEL-53 (*p < .05). (F) Whole-mount dorsal images of representative embryos (scale bar = 100 μm). White dotted lines show the outline of the neural tube and the white arrows indicate fluorescent melanoma cells that migrated out of the neural tube and into the surrounding tissue. (G) Images from cross-section of embryos show motility of melanoma cells. Arrows indicate the motile melanoma cells, arrowheads point to melanoma cells that remain inside the neural tube (scale bar = 100 μm).
Figure 3
Figure 3. Silencing PXDN blocks in vitro invasion of melanoma cells
(A) Using qRT-PCR PXDN expression in ten mesenchymal- and epithelial-like melanoma cell lines was analyzed. Bars indicate mean +/− SEM (t-test *p < .05). (B) Six melanoma cell lines were transfected with either 10 nM control siRNA or PXDN specific siRNA and knockdown was evaluated by qRT-PCR after 72 h (t-test, ***p < .0005). (C–D) The in vitro invasive ability of these cells lines was tested using a Matrigel assay. (C) Representative images of invasive cells were taken (scale bar = 100 μm) and (D) average intensities of invasive cells after crystal violet staining was calculated in K counts mm2 using Odyssey Software. Bars indicate mean +/− SEM of three independent experiments in triplicate. Data was combined with data from same cell lines in Figure 4 and Figure 5 and analysed using ANOVA, with post-hoc Tukey test to identify treatments significantly different from control (**p < .005, ***p < .0005).
Figure 4
Figure 4. Targeting NTN4 results in loss of invasive potential of melanoma cells in vitro
(A) NTN4 expression in ten mesenchymal- and epithelial-like melanoma cell lines was tested by qRT-PCR. Bars indicate mean +/− SEM (t-test, **p < .005). (B) Melanoma cell lines were transfected with either 10 nM control siRNA or NTN4 specific siRNA and NTN4 qRT-PCR was performed after 72 h (t-test, *p < .05, ***p < .0005, n.s = not significant). (C–D) The in vitro invasive ability of these cells lines was tested using a Matrigel assay. (C) Representative images of invasive cells were taken (scale bar = 100 μm) and (D) average intensities of invasive cells calculated in K counts mm2 using Odyssey Software. Bars indicate mean +/− SEM of three independent experiments in triplicate. Data was combined with data from same cell lines in Figure 3 and Figure 5 and analysed using ANOVA, with post-hoc Tukey test to identify treatments significantly different from control (*p < .05, **p < .005, ***p < .0005).
Figure 5
Figure 5. Silencing GLIS3 results in the abrogation of melanoma invasion in vitro
(A) GLIS3 expression was evaluated in ten mesenchymal- and epithelial-like melanoma cells by qRT-PCR. Bars indicate mean +/− SEM (t-test, **p < .05). (B) 72 h after transfection of six melanoma cell lines with either 10 nM control siRNA or GLIS3 specific siRNA GLIS3 qRT-PCR was performed (t-test, **p < .005, ***p < .0005). (C–D) The in vitro invasive ability of these cells lines was tested using a Matrigel assay. (C) Representative images of invasive cells were taken (scale bar = 100 μm). (D) Average intensities of invasive cells were calculated in K counts mm2 using Odyssey Software. Bars indicate mean +/− SEM of three independent experiments in triplicate. Data was combined with data from same cell lines in Figure 3 and Figure 4 and analysed using ANOVA, with post-hoc Tukey test to identify treatments significantly different from control (**p < .005, ***p < .0005).
Figure 6
Figure 6. PXDN, NTN4 and GLIS3 immunostaining in melanoma tumor tissue
Localization of (A) PXDN, (C) NTN4 and (E) GLIS3 in metastatic melanoma tumor biopsies (scale bar = 50 μm). Graph shows number of tumors scored for (B) PXDN, (D) NTN4 and (F) GLIS3 expression.
Figure 7
Figure 7. Depletion of PXDN, NTN4 and GLIS3 inhibits melanoma invasion in the chicken transplantation model
Melanoma cells were treated with CM-Dio and transfected with either 10 nM control siRNA, PXDN, NTN4 or GLIS3 specific siRNA. Cells were cultured as hanging drops and introduced into the trunk neural tube of 2 day chicken embryos (Hamburger-Hamilton stages 11 to 14). (A) Whole mount images of embryos transplanted with control or NTN4 siRNA treated LM-MEL-53. White dotted lines show the outline of the neural tube. (B) Cross section of embryos showing motility of melanoma cells after control or NTN4 siRNA treatment. Arrows indicate motile melanoma cells, arrowheads show melanoma cells that remain in the neural tube. (C) Whole mount images of embryos transplanted with control or GLIS3 or PXDN siRNA in LM-MEL-77. White dotted lines show the outline of the neural tube. (D) Cross-section of embryos showing motility of melanoma cells after control or PXDN or GLIS3 siRNA treatment. Arrows indicate the motile melanoma cells, and arrowheads show melanoma cells that remain at the site of transplantation. (E) The number of cells outside the neural tube from each embryo was counted and plotted for LM-MEL-44 and -53 after NTN4 or control siRNA treatment. The same controls were used in the Slug and Snail siRNA treatments (Figure 2E) and these data were analysed together using ANOVA with post-hoc Tukey test (*p <.05). The number of cells outside the neural tube from each embryo was counted and plotted for LM-MEL-77 and -46 after GLIS3, PXDN or control siRNA treatments. Lines indicate mean +/− SEM, (Anova with post-hoc Tukey test, *p <.05). Scale bars = 100 μm.

References

    1. Zbytek B, Carlson JA, Granese J, Ross J, Mihm MC, Jr, Slominski A. Current concepts of metastasis in melanoma. Expert Rev Dermatol. 2008;3:569–585. - PMC - PubMed
    1. Thomas CG, Miller AJ, Westbrook GL. Synaptic and extrasynaptic NMDA receptor NR2 subunits in cultured hippocampal neurons. J Neurophysiol. 2006;95:1727–1734. - PubMed
    1. Kalluri R, Weinberg RA. The basics of epithelial-mesenchymal transition. J Clin Invest. 2009;119:1420–1428. - PMC - PubMed
    1. Nieto MA. Epithelial plasticity: a common theme in embryonic and cancer cells. Science. 2013;342:1234850. - PubMed
    1. Lamouille S, Xu J, Derynck R. Molecular mechanisms of epithelial-mesenchymal transition. Nat Rev Mol Cell Biol. 2014;15:178–196. - PMC - PubMed