. 2016 Jul;24(7):1480-8.
doi: 10.1002/oby.21504. Epub 2016 May 13.

Obesity enhances sepsis-induced liver inflammation and injury in mice

Affiliations

Obesity enhances sepsis-induced liver inflammation and injury in mice

Jennifer M Kaplan et al. Obesity (Silver Spring). 2016 Jul.

Abstract

Objective: How obesity affects the response to sepsis was not completely understood. It was hypothesized that obesity alters adipose and hepatic tissue inflammation through signal transducer and activator of transcription (STAT3) activation.

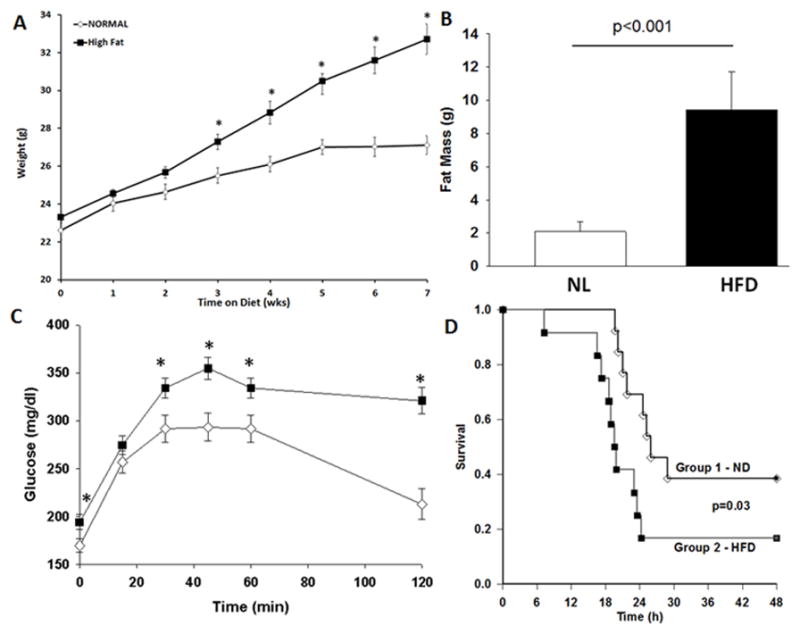
Methods: Male C57BL/6 mice at 6 weeks of age were randomized to a high-fat diet (60% kcal fat) or normal diet (16% kcal fat) for 6 to 7 weeks. Sepsis was then induced by cecal ligation and puncture, and animals were monitored for survival or sacrificed and tissue collected.

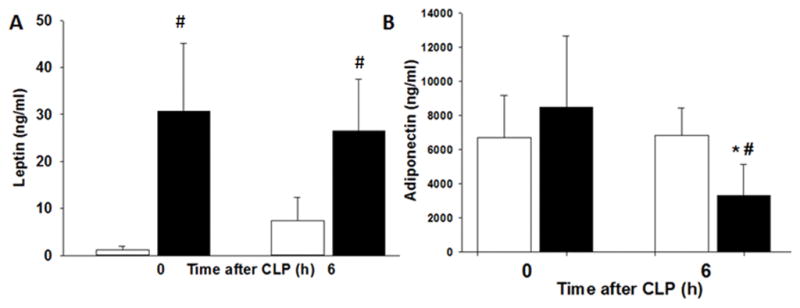
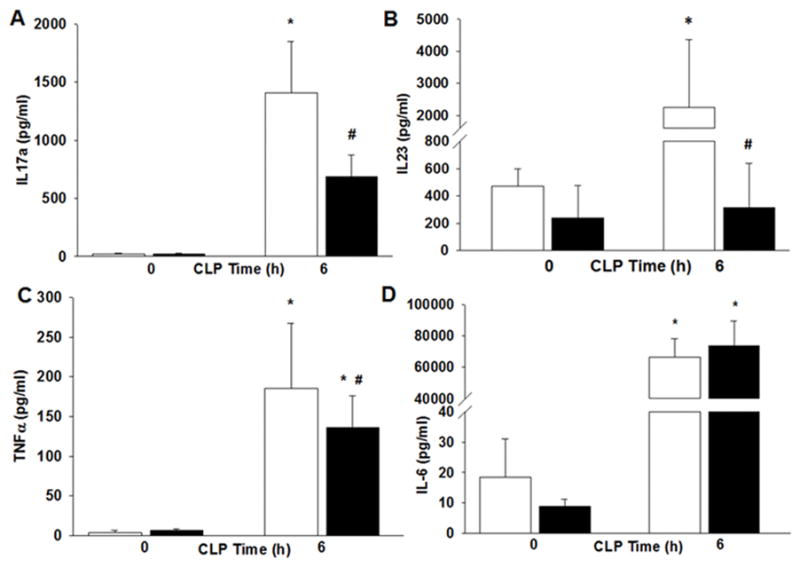
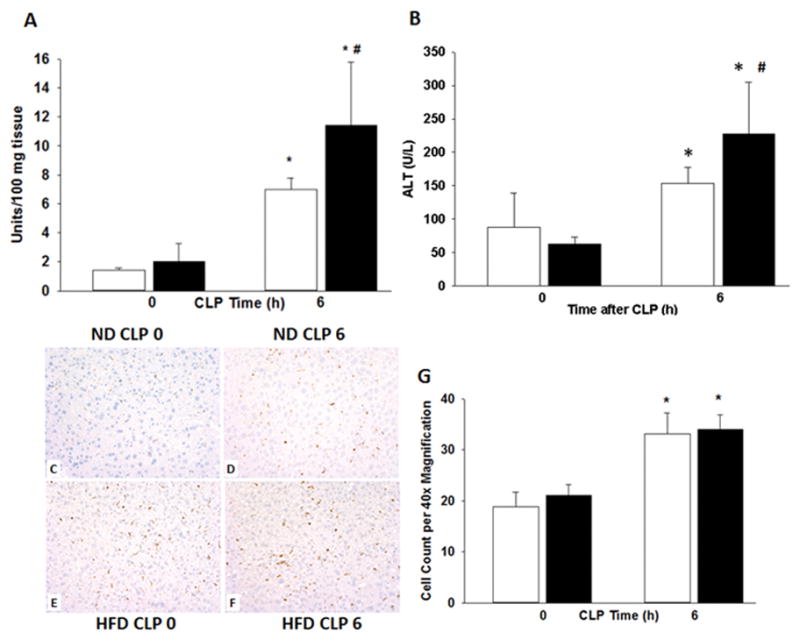
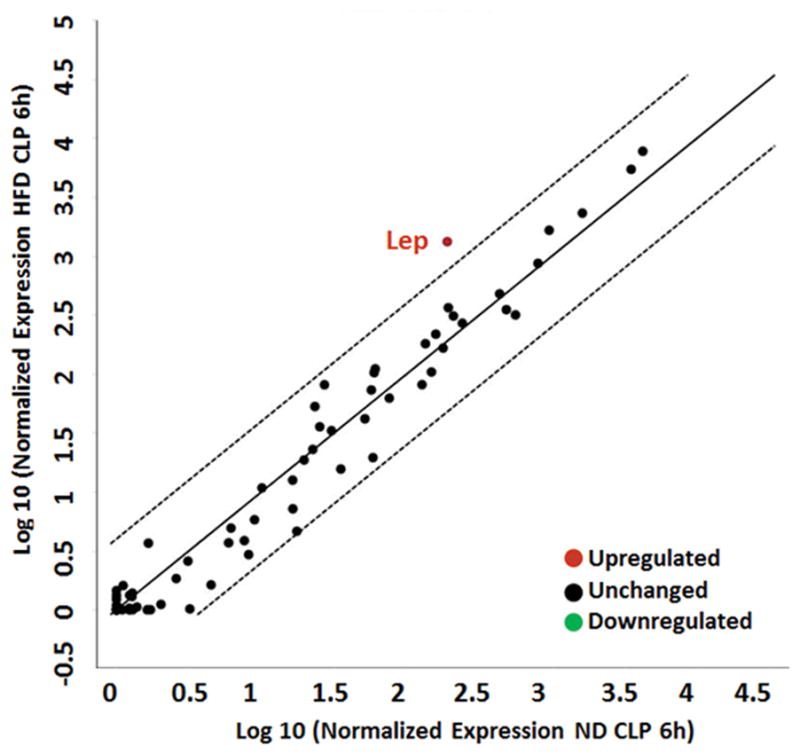
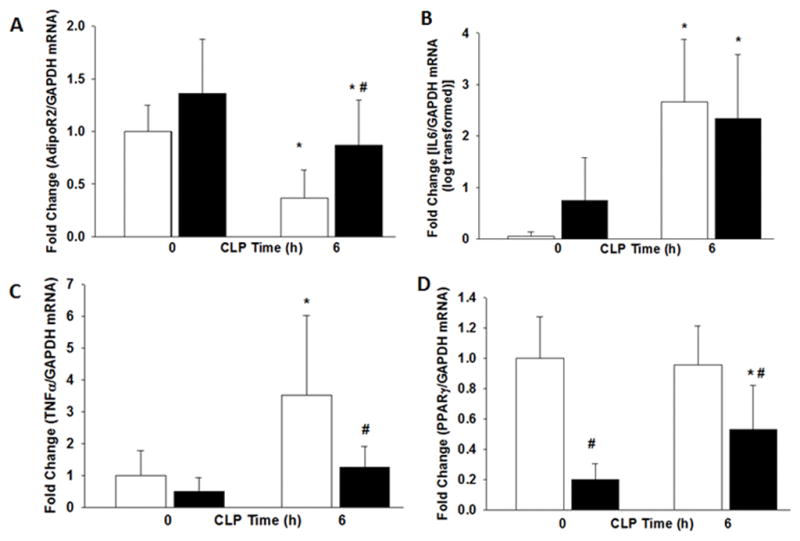
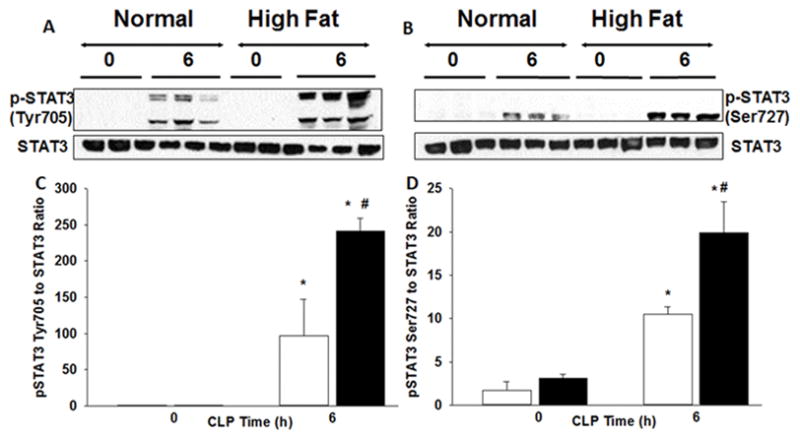
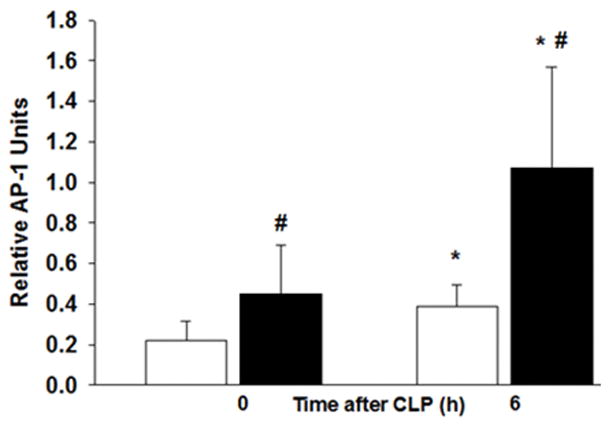
Results: High-fat diet-fed mice gained more weight, had increased fat mass, and were glucose intolerant compared with normal diet-fed mice. Obesity increased hepatic neutrophil infiltration and injury after sepsis. Mice with obesity had higher plasma leptin levels compared with mice without obesity. Adipose tissue expression of adiponectin receptor 2, tumor necrosis factor-α, and peroxisome proliferator activated receptor gamma was altered during sepsis and affected by obesity, but the greatest change in adipose tissue expression was in leptin. Septic mice with obesity had lower plasma interleukin-17a, interleukin-23, and tumor necrosis factor-α levels and increased hepatic STAT3 and activator protein-1 activation compared with septic mice without obesity. Ultimately, mice with obesity had a lower probability of survival following sepsis.

Conclusions: Mice with obesity are more susceptible to sepsis and have higher mortality, in part, through activation of the STAT3 signaling pathway and through activator protein-1 activation.


Figures

Figure 1
Figure 1
Model of DIO replicates human obesity. Changes in (A) body weight (B) fat mass measured by EchoMRI and (C) glucose tolerance test in mice fed a high fat diet (HFD) or standard control diet (CD) for 6 weeks. Values are means ± SEM. *p<0.05 vs normal diet. n=12–16/group. White boxes=Normal diet, Black boxes = HFD. (D) Obese mice have higher mortality after sepsis. Mice were randomized to a HFD or ND for 6–7wks. CLP was performed and survival was monitored. Animals were censored at 30h. p=0.035 by log-rank test, n=12/group. White diamonds = Normal diet, Black boxes = HFD.
Figure 2
Figure 2
Obesity alters adipokines after polymicrobial sepsis. Mice were randomized to a HFD or ND for 6–7wks. Polymicrobial sepsis was induced by CLP after diet intervention. Plasma (A) leptin and (B) adiponectin levels after CLP. *p<0.05 vs time 0h, #p<0.05 vs. normal diet. White boxes = Normal diet, Black boxes = HFD. n=4–5 mice/group.
Figure 3
Figure 3
Obesity alters cytokines after polymicrobial sepsis. Mice were randomized to a HFD or ND for 6–7wks. Polymicrobial sepsis was induced by CLP after diet intervention. Plasma (A) IL-17a (B) IL-23 (C) TNFα and (D) IL-6 levels after CLP. *p<0.05 vs time 0h, #p<0.05 vs. normal diet. White boxes = Normal diet, Black boxes = HFD. n=5–6 mice/group.
Figure 4
Figure 4
Mice were randomized to a HFD or ND for 6–7wks. Polymicrobial sepsis was induced by CLP after diet intervention and (A) liver neutrophil infiltration was determined by myeloperoxidase assay. (B) Plasma ALT levels were measured. Representative immunohistochemistry for CD68 of liver sections from mice on (C) ND prior to CLP (D) on ND at 6h after CLP (E) on HFD prior to CLP and (F) on HFD at 6h after CLP. Images at 20x magnification and (G) quantification performed at 40x. *p<0.05 vs. time 0h. #p<0.05 vs. normal diet. White boxes = Normal diet, Black boxes = HFD. n=5–8 mice/group.
Figure 5
Figure 5
Leptin gene expression is increased in WAT in obese mice after sepsis. 6wk male C57BL/6 mice were randomized to a HFD or normal chow diet for 6wks. Sepsis was induced by CLP after diet intervention and epididymal WAT obtained for analysis. Gene expression profile of 84 genes related to obesity was evaluated. Center line represents unchanged gene expression. Boundary line (dashed lines) indicates 4-fold gene regulation cut-off between septic obese and septic non-obese samples. Leptin demonstrated differences that represented more than a doubling or halving (log 2 changes of >1.0 or −1.0, respectively) and were statistically significant at p ≤0.05. n=3 mice/group.
Figure 6
Figure 6
The expression of (A) Adiponectin Receptor 2 (B) IL-6 (C) TNFα and (D) PPARγ in WAT were measured by RT-qPCR after CLP. *p<0.05 vs. time 0h. #p<0.05 vs. normal diet. White boxes = Normal diet, Black boxes = HFD. n=6 mice/group.
Figure 7
Figure 7
Phosphorylation sites of STAT3 expression in liver. (A) Changes in tyrosine705 and (B) serine727 phosphorylation of STAT3 and STAT3 expression in liver nuclear extracts by Western blot. (C & D) Densitometric analysis. White boxes = Normal diet, Black boxes = HFD. *p<0.05 vs time 0h. #p<0.05 vs normal diet.
Figure 8
Figure 8
Liver nuclear extracts were obtained from ND and HFD-fed mice after CLP. Liver AP-1 DNA binding was evaluated by transcription factor assay kit. n= 6–8/group. White boxes = Normal diet, Black boxes = HFD. *p<0.05 vs time 0h. #p<0.05 vs normal diet.

References

    1. Brown CV, Neville AL, Salim A, Rhee P, Cologne K, Demetriades D. The impact of obesity on severely injured children and adolescents. J Pediatr Surg. 2006;41:88–91. discussion 88–91. - PubMed
    1. Prescott HC, Chang VW, O’Brien JM, Jr, Langa KM, Iwashyna T. Obesity and 1-Year Outcomes in Older Americans With Severe Sepsis. Crit Care Med. 2014 - PMC - PubMed
    1. Akinnusi ME, Pineda LA, El Solh AA. Effect of obesity on intensive care morbidity and mortality: a meta-analysis. Crit Care Med. 2008;36:151–158. - PubMed
    1. Hogue CW, Jr, Stearns JD, Colantuoni E, et al. The impact of obesity on outcomes after critical illness: a meta-analysis. Intensive Care Med. 2009;35:1152–1170. - PubMed
    1. Nasraway SA, Jr, Albert M, Donnelly AM, Ruthazer R, Shikora SA, Saltzman E. Morbid obesity is an independent determinant of death among surgical critically ill patients. Crit Care Med. 2006;34:964–970. quiz 971. - PubMed

MeSH terms