. 2016 Aug:72:33-46.
doi: 10.1016/j.jaut.2016.04.009. Epub 2016 May 9.

Inherent ER stress in pancreatic islet β cells causes self-recognition by autoreactive T cells in type 1 diabetes

Affiliations

Inherent ER stress in pancreatic islet β cells causes self-recognition by autoreactive T cells in type 1 diabetes

Meghan L Marré et al. J Autoimmun. 2016 Aug.

Abstract

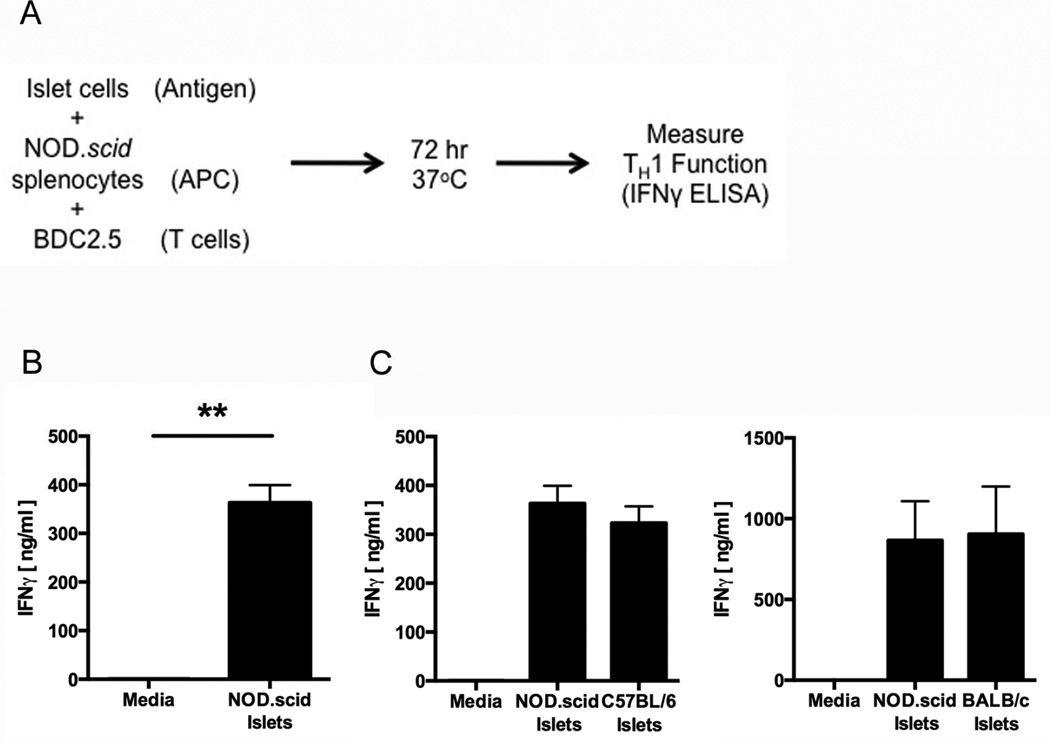
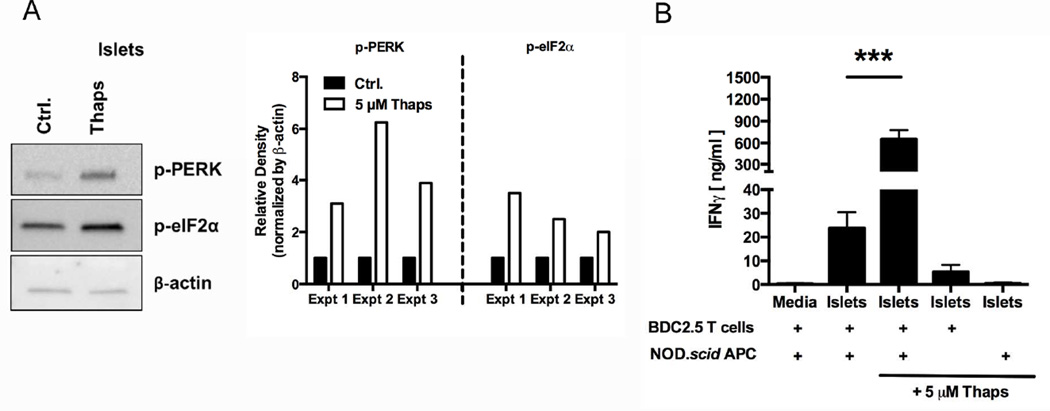
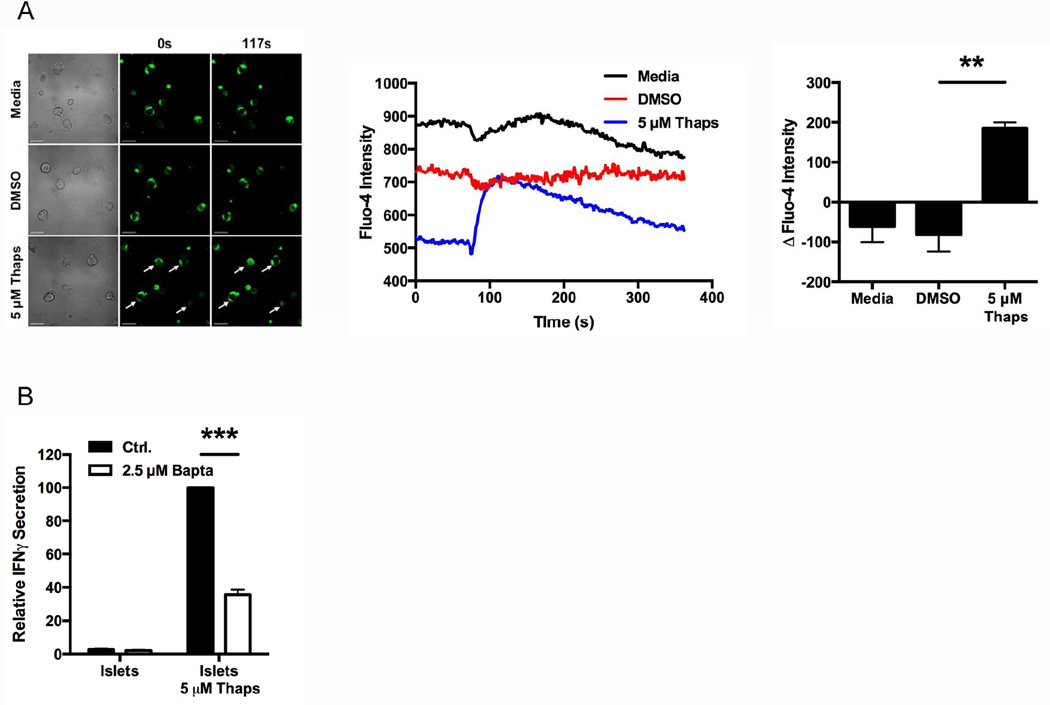
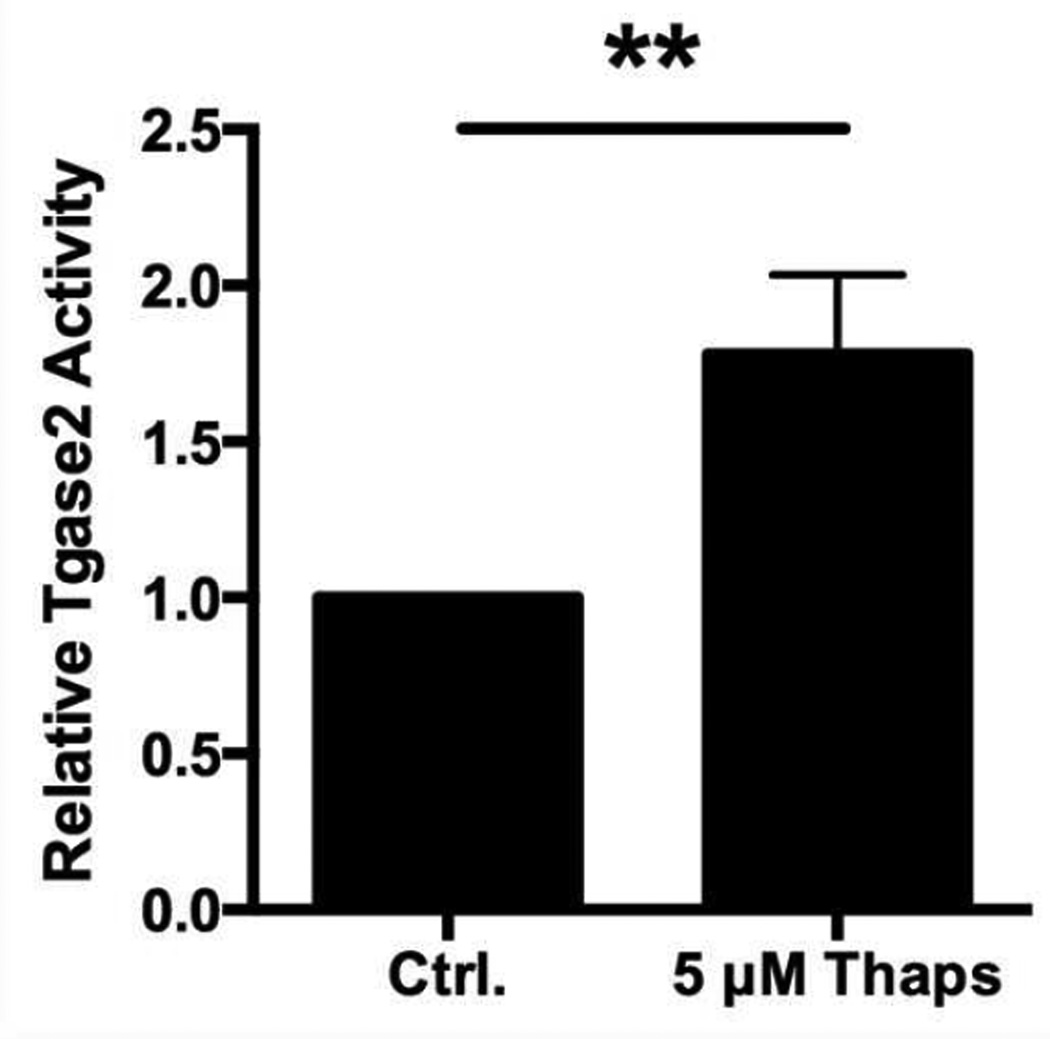
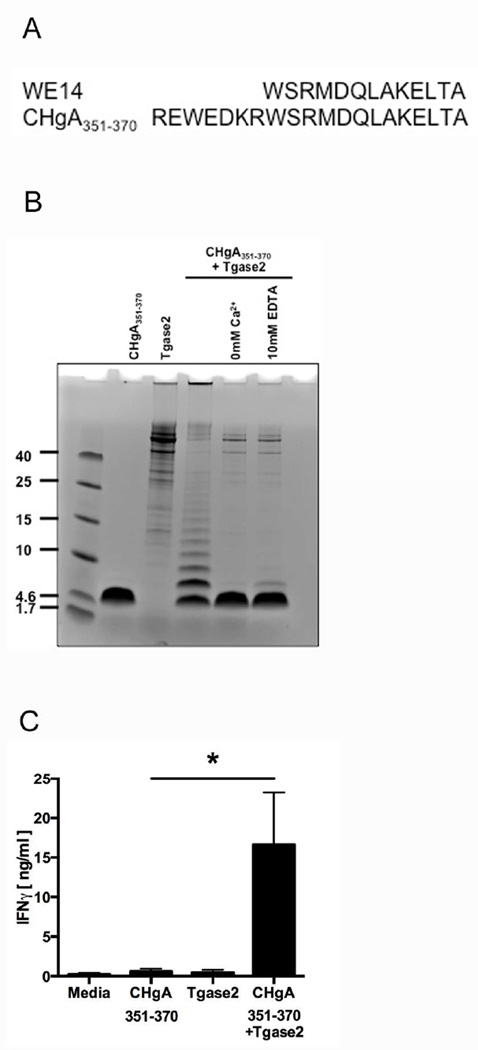
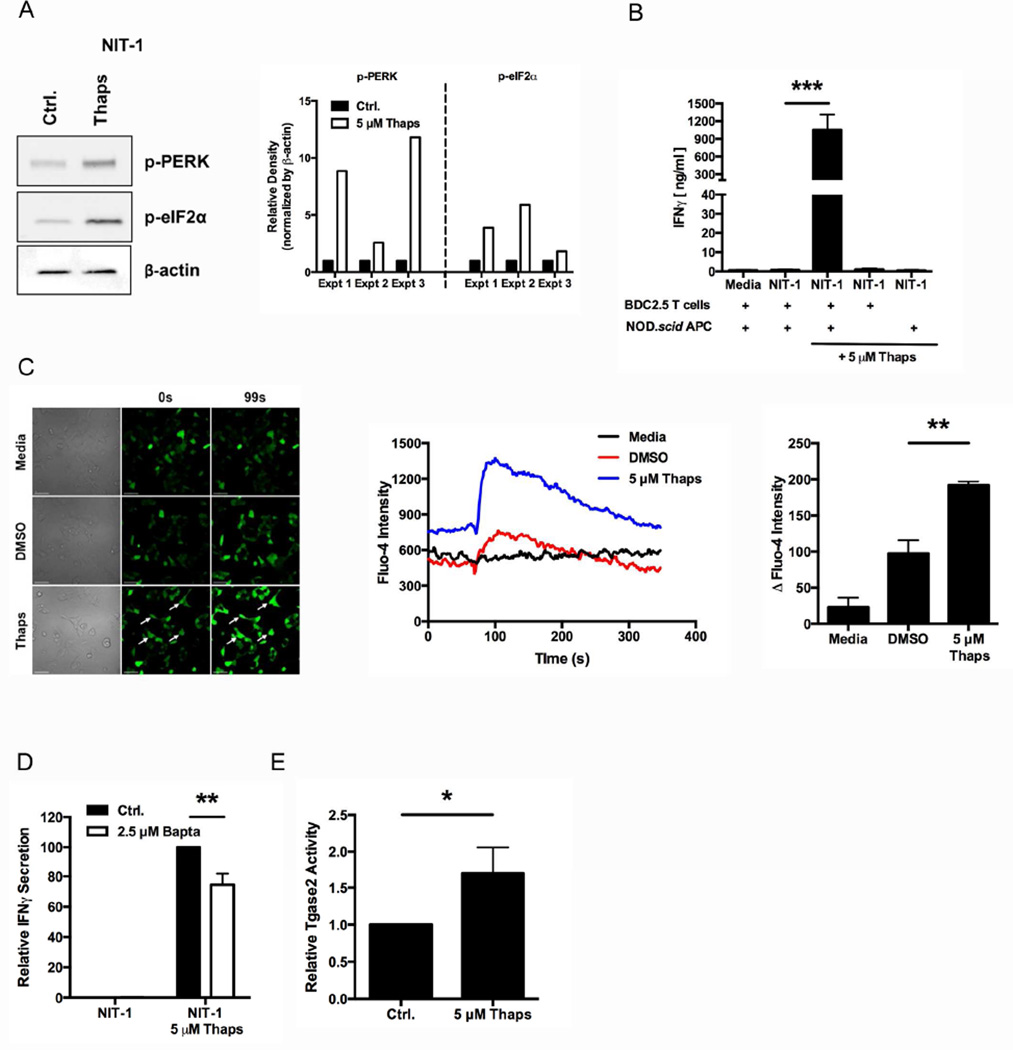
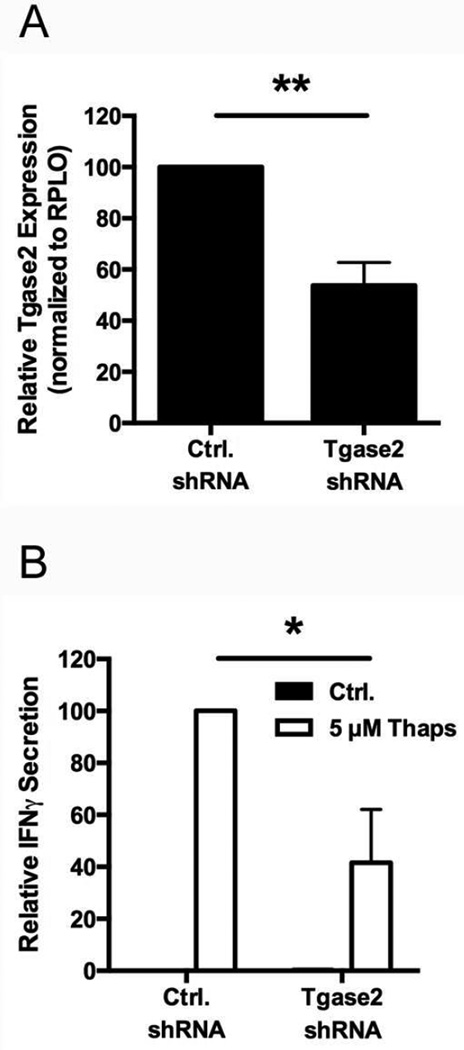
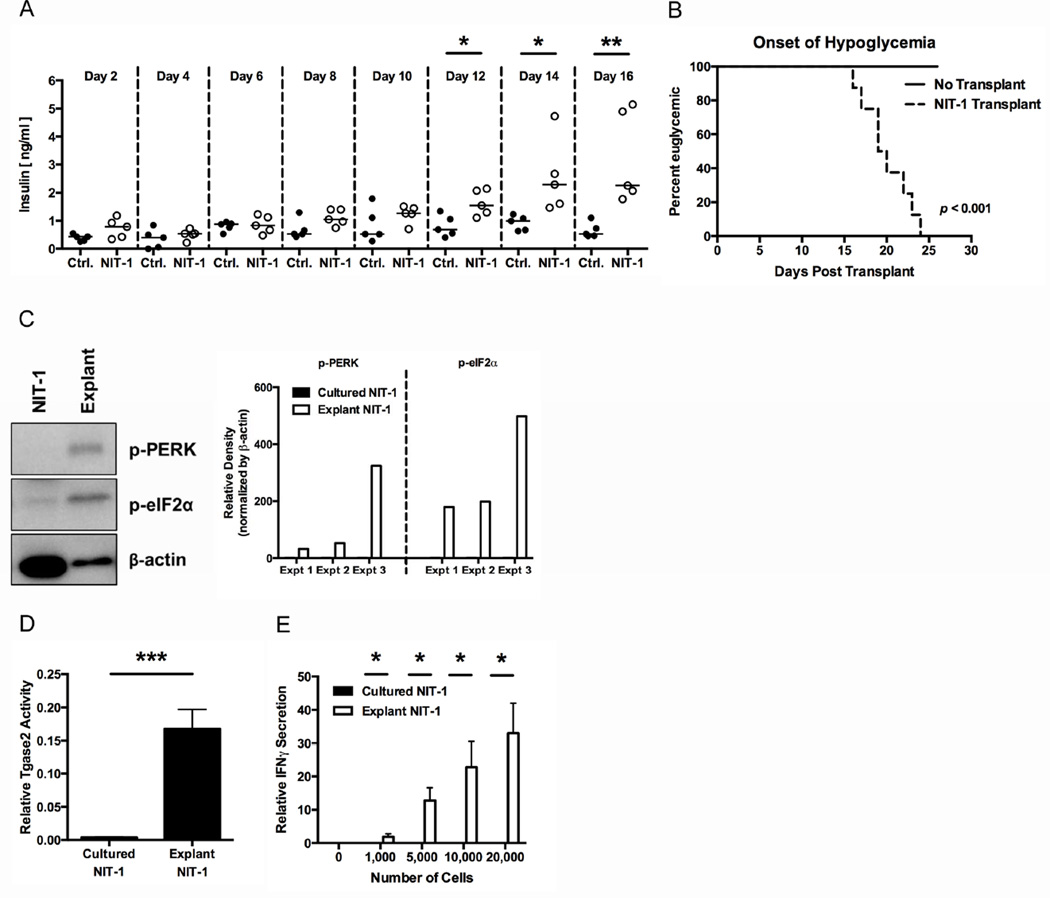
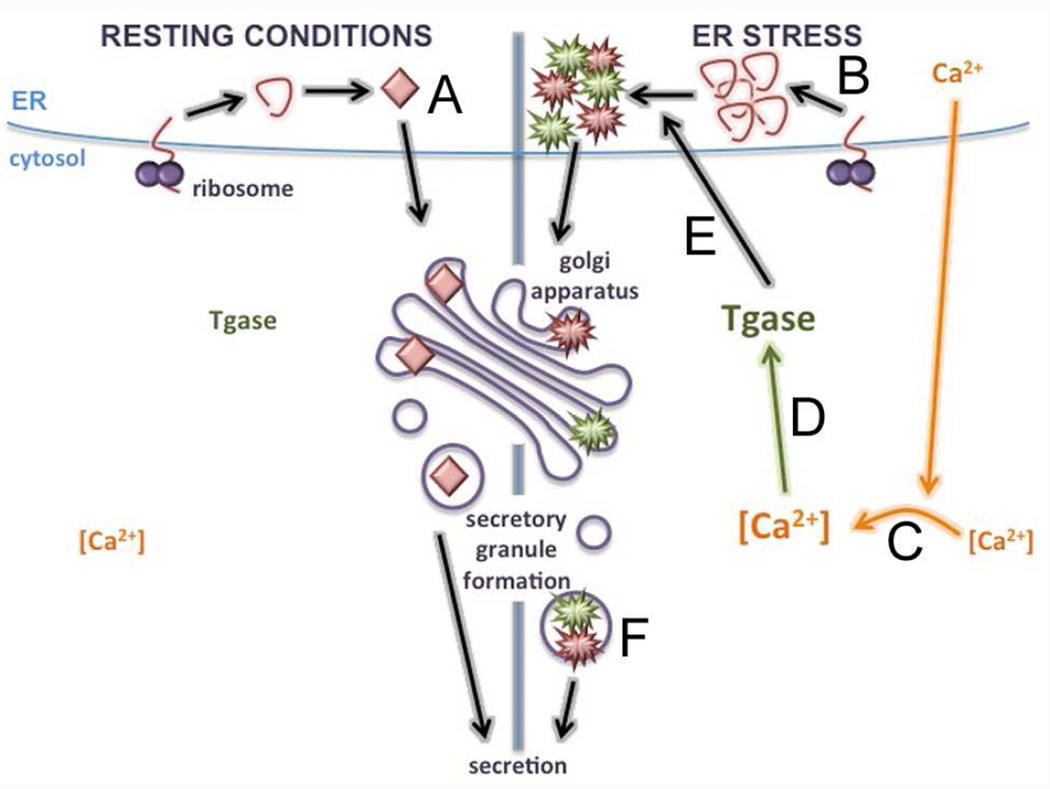
Type 1 diabetes (T1D) is an autoimmune disease characterized by pancreatic β cell destruction induced by islet reactive T cells that have escaped central tolerance. Many physiological and environmental triggers associated with T1D result in β cell endoplasmic reticulum (ER) stress and dysfunction, increasing the potential for abnormal post-translational modification (PTM) of proteins. We hypothesized that β cell ER stress induced by environmental and physiological conditions generates abnormally-modified proteins for the T1D autoimmune response. To test this hypothesis we exposed the murine CD4(+) diabetogenic BDC2.5 T cell clone to murine islets in which ER stress had been induced chemically (Thapsigargin). The BDC2.5 T cell IFNγ response to these cells was significantly increased compared to non-treated islets. This β cell ER stress increased activity of the calcium (Ca(2+))-dependent PTM enzyme tissue transglutaminase 2 (Tgase2), which was necessary for full stress-dependent immunogenicity. Indeed, BDC2.5 T cells responded more strongly to their antigen after its modification by Tgase2. Finally, exposure of non-antigenic murine insulinomas to chemical ER stress in vitro or physiological ER stress in vivo caused increased ER stress and Tgase2 activity, culminating in higher BDC2.5 responses. Thus, β cell ER stress induced by chemical and physiological triggers leads to β cell immunogenicity through Ca(2+)-dependent PTM. These findings elucidate a mechanism of how β cell proteins are modified and become immunogenic, and reveal a novel opportunity for preventing β cell recognition by autoreactive T cells.

Keywords: Autoimmunity; ER stress; Post-translational modification; Type 1 diabetes; β cell.


Figures

Fig. 1
Fig. 1. Primary islets from many mouse strains elicit effector responses from BDC2.5 T cell clones
(A) Schematic of the BDC2.5 T cell assay protocol. Antigen presenting cell (APC). (B) The immunogenicity of NOD.scid islet cells was measured by BDC2.5 T cell assay. Data are mean IFNγ secretion ± SEM. ** p < 0.01. (C) The immunogenicity of NOD.scid and C57BL/6 (left) or BALB/c (right) islet cells was measured by BDC2.5 T cell assay. Data are mean IFNγ secretion ± SEM.
Fig. 2
Fig. 2. β cell ER stress increases recognition by diabetogenic T cells
(A) Primary NOD.scid islets were incubated with 5 µM Thaps or control (Ctrl.) for 1 hr, washed extensively, and dispersed. Cell lysates were analyzed for the phosphorylation of UPR proteins PERK and eIF2α. Data are representative of 3 independent experiments. Densitometry data are phosphorylation levels normalized by β-actin and relative to that in control (Ctrl.) treated cells. (B) The immunogenicity of NOD.scid islet cells treated with 5 µM Thaps or control for 1 hr was measured by BDC2.5 T cell assay. Either APC or T cells were omitted from assay to demonstrate the necessity of both cell types for full IFNγ secretion. Data are mean IFNγ secretion ± SEM. *** p < 0.001.
Fig. 3
Fig. 3. ER stress-induced immunogenicity is Ca2+ dependent
(A) Dispersed NOD.scid islet cells were labeled with Fluo-4 and analyzed by live imaging with an Olympus Fluoview FV1000 microscope for 350 sec at room temperature. At 70 sec, the cells were exposed to 5 µM Thaps or controls. Scale bars, 50 µm. Arrows indicate cells with greater Fluo-4 intensity after exposure to Thaps. Line graphs represent the intensity of Fluo-4 in each sample over time. Data are representative of 3 independent experiments. Quantified data are change in Fluo-4 intensity from baseline to peak, with mean ± SEM. ** p < 0.01. (B) The immunogenicity of primary NOD.scid islet cells treated with 2.5 µM Bapta or control (Ctrl.) prior to incubation with 5 µM Thaps or control was measured by BDC2.5 T cell assay. Data are relative IFNγ secretion compared to 5 µM Thaps, with mean ± SEM. *** p < 0.001
Fig. 4
Fig. 4. β cell ER stress increases the activity of Tgase2
Primary NOD.scid islets were incubated with 5 µM Thaps or control (Ctrl.) for 1 hr. The cells were lysed and Tgase2 activity was measured by microtiter plate assay. Data are relative Tgase2 activity compared to control (Ctrl.) islet cells, with mean ± SEM. ** p < 0.01.
Fig. 5
Fig. 5. Modification of CHgA by Tgase2 increases immunogenicity
(A) Alignment of the sequences of WE14 and CHgA351–370. (B) Synthetic CHgA351–370 was incubated with purified Tgase2 at 37°C for 3 hr. To confirm the dependence of these reactions on Ca2+, the reactions were repeated without CaCl2 (0 mM Ca2+) or with increased EDTA (10 mM EDTA). The reaction products were analyzed by SDS-PAGE. Lane 1: CHgA351–370 alone; Lane 2: Tgase2 alone; Lane 3: CHgA351–370 incubated with Tgase2; Lane 4: CHgA351–370 incubated with Tgase2 in 0 mM Ca2+; Lane 5, CHgA351–370 incubated with Tgase2 in 10 mM EDTA. (C) The immunogenicity of CHgA351–370 incubated with Tgase2 was measured by BDC2.5 T cell assay. Data are mean IFNγ secretion ± SEM. * p < 0.05.
Fig. 6
Fig. 6. ER stress in NIT-1 insulinomas increases immunogenicity in a Ca2+-dependent manner
(A) NIT-1 insulinoma cells were incubated with 5 µM Thaps or control (Ctrl.) for 1 hr and washed extensively. Cell lysates were analyzed for the phosphorylation of UPR proteins PERK and eIF2α. Data are representative of 3 independent experiments. Densitometry data are phosphorylation levels normalized by β-actin and relative to that in control (Ctrl.) treated cells. (B) The immunogenicity of NIT-1 cells treated with 5 µM Thaps or control was measured by BDC2.5 T cell assay. Either APC or T cells were omitted from assay to demonstrate the necessity of both cell types for full IFNγ secretion. Data are mean IFNγ secretion ± SEM. *** p < 0.001. (C) NIT-1 cells were labeled with Fluo-4 and analyzed by live imaging with an Olympus Fluoview FV1000 microscope for 350 sec at room temperature. At 70 sec, the cells were exposed to 5 µM Thaps or controls. Scale bars, 50 µm. Arrows indicate cells with greater Fluo-4 intensity after exposure to Thaps. Line graphs represent intensity of Fluo-4 in each sample over time. Data are representative of 3 independent experiments. Quantified data are change in Fluo-4 intensity from baseline to peak, with mean ± SEM. ** p < 0.01. (D) The immunogenicity of NIT-1 cells treated with 2.5 µM Bapta or control (Ctrl.) prior to incubation with 5 µM Thaps or control was measured by BDC2.5 T cell assay. Data are relative IFNγ secretion compared to 5 µM Thaps, with mean ± SEM. ** p < 0.01 (E) NIT-1 cells were incubated with 5 µM Thaps or control (Ctrl.) for 1 hr. The cells were lysed and Tgase2 activity was measured by microtiter plate assay. Data are relative Tgase2 activity compared to control (Ctrl.) NIT-1 cells, with mean ± SEM. * p < 0.05.
Fig. 7
Fig. 7. Tgase2 activity contributes to β cell immunogenicity
(A) NIT-1 cells were transduced with control shRNA (Ctrl. shRNA) or Tgase2-targeting shRNA (Tgase2 shRNA). Tgase2 expression was measured by qRT-PCR. Data are relative Tgase2 expression compared to cells transduced with control shRNA, with mean ± SEM. ** p < 0.01. (B) The immunogenicity of NIT-1 cells transduced with control shRNA (Ctrl. shRNA) or Tgase2-targeting shRNA (Tgase2 shRNA) prior to incubation with 5 µM Thaps or control (Ctrl.) for 1 hr was measured by BDC2.5 T cell assay. Data are relative IFNγ secretion compared to NIT-1 cells transduced with Ctrl. shRNA and incubated with 5 µM Thaps, with mean ± SEM. * p < 0.05.
Fig. 8
Fig. 8. Physiological cues increase β cell ER stress and immunogenicity
Non-immunogenic NIT-1 cells (2–5×10⁶) were transplanted under the kidney capsule of NOD.scid mice. (A) Serum insulin levels in control mice (Ctrl.) or mice transplanted with NIT-1 cells (NIT-1) were measured by ELISA. Medians are indicated with a line. Data are representative of 4 independent experiments. * p < 0.05, ** p < 0.01. (B) The onset of hypoglycemia in control mice (No Transplant) or mice transplanted with NIT-1 cells (NIT-1 Transplant) was monitored over time. p < 0.001 (C) At the onset of hypoglycemia, the mice were sacrificed and the NIT-1 cells were explanted. Cell lysates of cultured NIT-1 cells (NIT-1) or explanted NIT-1 cells (Explant) were analyzed for the phosphorylation of UPR proteins PERK and eIF2α. Data are representative of 3 independent experiments. Densitometry data are phosphorylation levels normalized by β-actin and relative to that in cultured NIT-1 cells. (D) Cultured NIT-1 cells or explanted NIT-1 cells were lysed, and Tgase2 activity was measured by ex vivo Tgase2 activity assay. Data are mean Tgase2 activity, with mean ± SEM. *** p < 0.001. (E) The immunogenicity of cultured NIT-1 cells or explanted NIT-1 cells was measured by BDC2.5 T cell assay. Data are mean IFNγ secretion ± SEM. * p < 0.05.
Fig. 9
Fig. 9. Model
(A) Under resting conditions, CHgA is translated, folded in the ER, and packaged in secretory granules. Cytosolic Ca2+ remains low, and Tgase2 activity remains low. (B) β cell exposure to physiological or environmental triggers of ER stress leads to increased ER burden. (C) Ca2+ stores are released from the ER, increasing cytosolic Ca2+, and (D) activating Ca2+-dependent PTM enzymes such as Tgase2. (E) Activated Tgase2 translocates to the ER to modify CHgA, (F) which is packaged into secretory granules. If presented to auto-reactive T cells by APC, modified CHgA breaks peripheral tolerance and facilitates immune recognition of β cells.

Similar articles

Cited by

References

    1. Geenen V. Thymus and type 1 diabetes: an update. Diabetes Res Clin Pract. 2012;98:26–32. - PubMed
    1. Fan Y, Rudert WA, Grupillo M, He J, Sisino G, Trucco M. Thymus-specific deletion of insulin induces autoimmune diabetes. EMBO J. 2009;28:2812–2824. - PMC - PubMed
    1. Mallone R and van Endert P. T cells in the pathogenesis of type 1 diabetes. Curr Diab Rep. 2008;8:101–106. - PubMed
    1. Grupillo M, Gualtierotti G, He J, Sisino G, Bottino R, Rudert WA, Trucco M, Fan Y. Essential roles of insulin expression in Aire+ tolerogenic dendritic cells in maintaining peripheral self-tolerance of islet beta-cells. Cell Immunol. 2012;273:115–123. - PubMed
    1. Wu J, Kaufman RJ. From acute ER stress to physiological roles of the Unfolded Protein Response. Cell Death Differ. 2006;13:374–384. - PubMed

MeSH terms