. 2016 May 13:7:11545.
doi: 10.1038/ncomms11545.

Evidence that phytochrome functions as a protein kinase in plant light signalling

Affiliations

Evidence that phytochrome functions as a protein kinase in plant light signalling

Ah-Young Shin et al. Nat Commun. .

Abstract

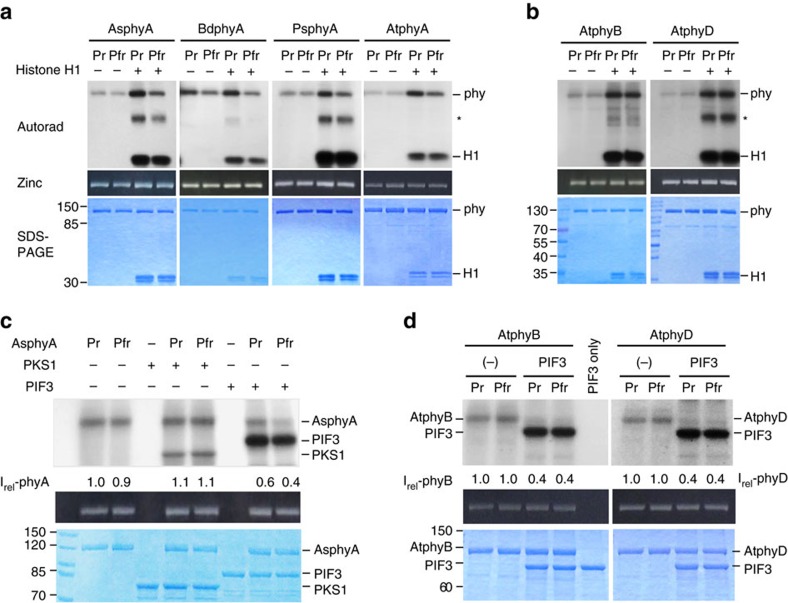
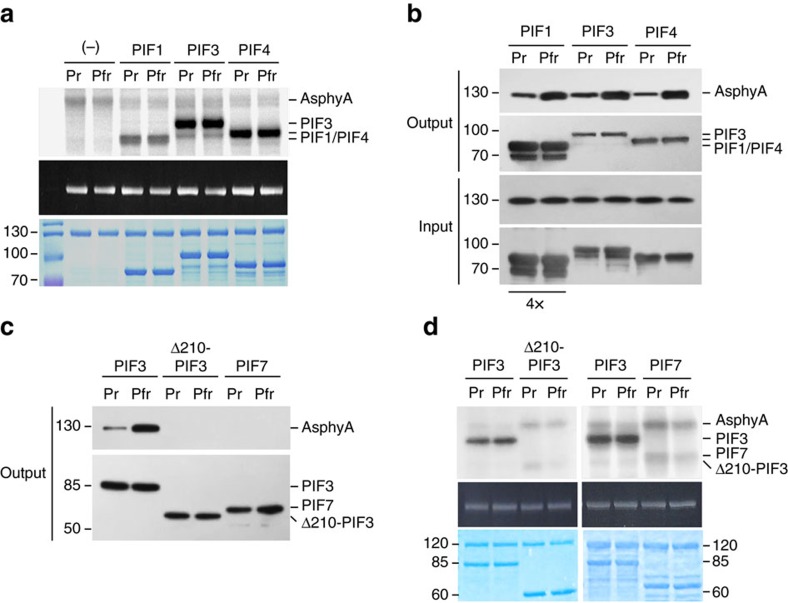
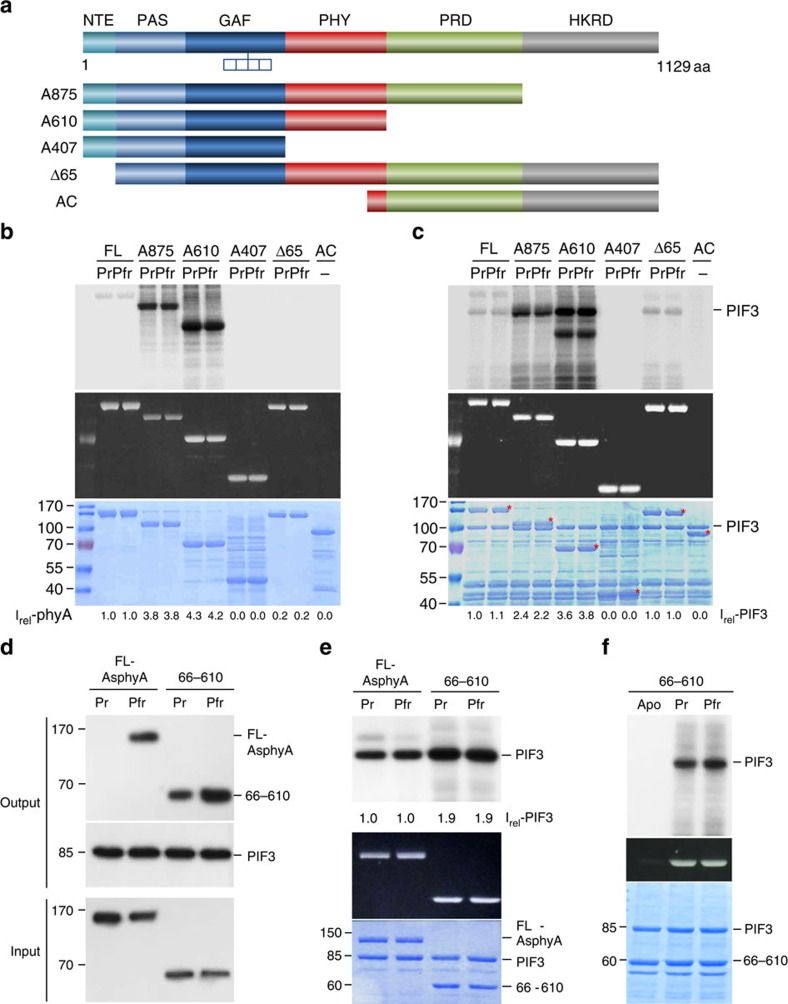
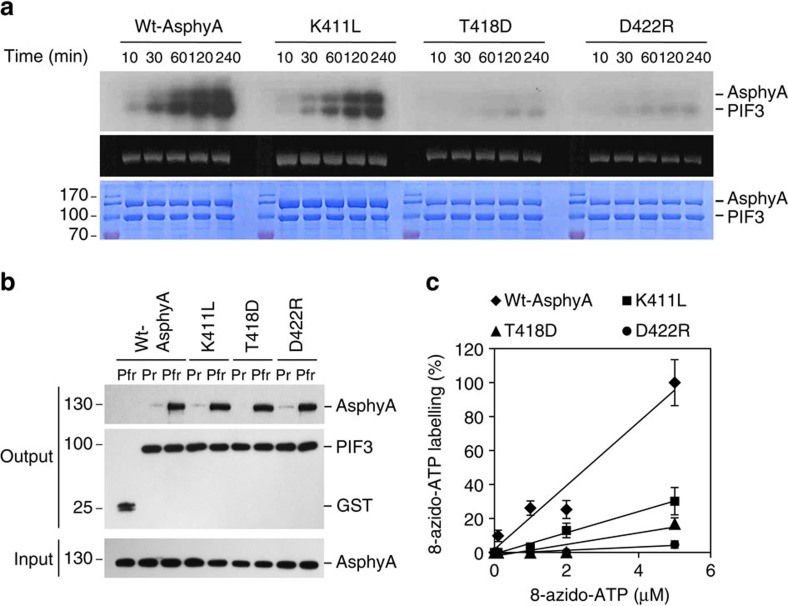
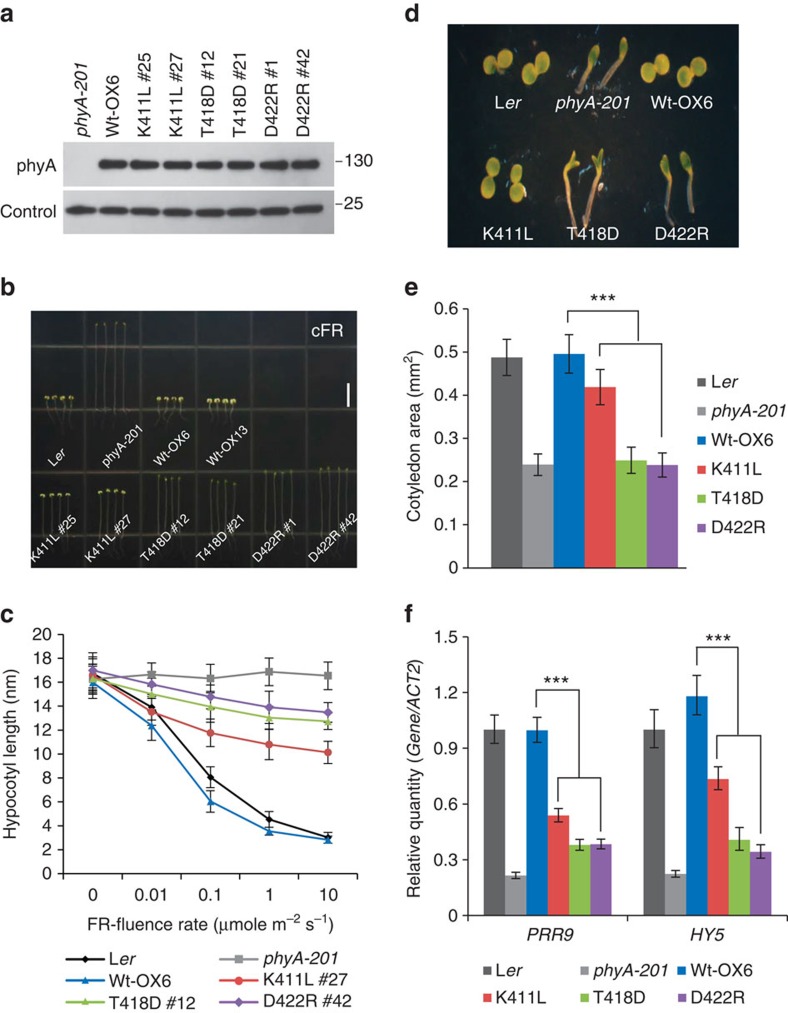
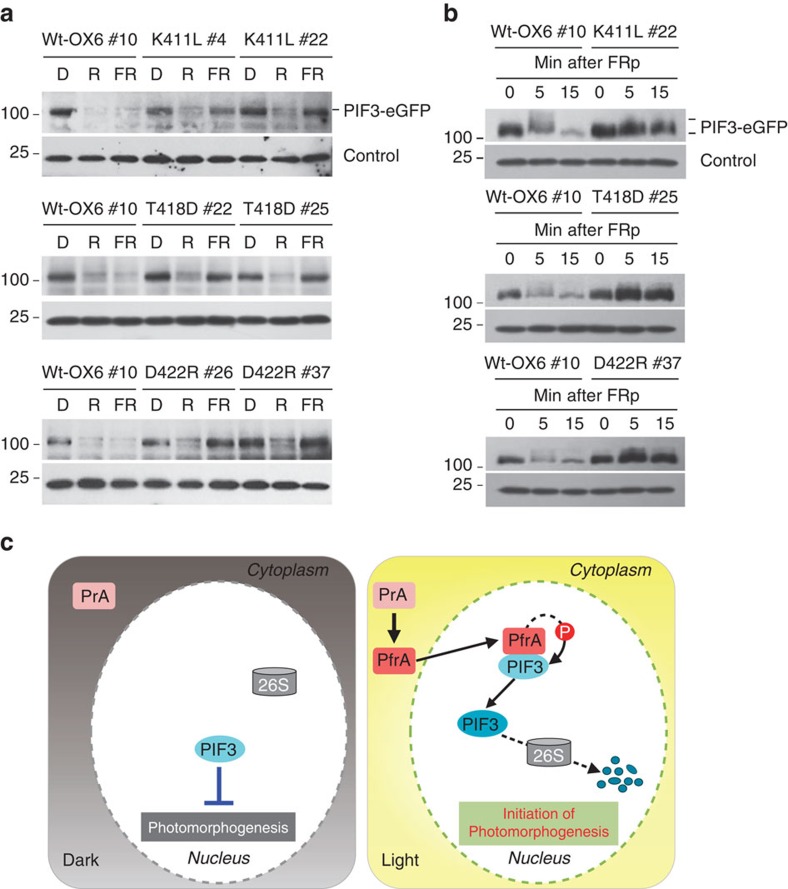
It has been suggested that plant phytochromes are autophosphorylating serine/threonine kinases. However, the biochemical properties and functional roles of putative phytochrome kinase activity in plant light signalling are largely unknown. Here, we describe the biochemical and functional characterization of Avena sativa phytochrome A (AsphyA) as a potential protein kinase. We provide evidence that phytochrome-interacting factors (PIFs) are phosphorylated by phytochromes in vitro. Domain mapping of AsphyA shows that the photosensory core region consisting of PAS-GAF-PHY domains in the N-terminal is required for the observed kinase activity. Moreover, we demonstrate that transgenic plants expressing mutant versions of AsphyA, which display reduced activity in in vitro kinase assays, show hyposensitive responses to far-red light. Further analysis reveals that far-red light-induced phosphorylation and degradation of PIF3 are significantly reduced in these transgenic plants. Collectively, these results suggest a positive relationship between phytochrome kinase activity and photoresponses in plants.


Figures

Figure 1
Figure 1. Evidence that PIF3 is phosphorylated by phytochromes.
(a,b) Autophosphorylation and protein kinase activities of type I (a) and type II (b) phytochromes. Histone H1 (H1) was included as a substrate for phytochrome kinase activity, and also used to stimulate phytochrome autophosphorylation. Autoradiograms (top), zinc-fluorescence assays (middle), and SDS-PAGE gels (bottom) are shown. The asterisk indicates a protein band that originated from histone H1 (see Supplementary Fig. 1). (c,d) Phosphorylation of PIF3 by AsphyA (c), and by AtphyB and AtphyD (d). In all, 1.0 μg of GST/strep-fused PIF3 (∼0.3 μM) was included as a substrate and the reactions were performed in the absence of histone H1. PKS1 (phytochrome kinase substrate 1) was included as a control. Intensities (Irel) of AsphyA, AtphyB and AtphyD autophosphorylation are expressed relative to the first lanes (that is, Pr forms in the absence of a substrate). AsphyA, Avena sativa (oat) phyA; AtphyA, AtphyB and AtphyD, Arabidopsis thaliana phyA, phyB and phyD; BdphyA, Brachypodium distachyon phyA; Pisum sativum phyA; Pr/Pfr, red/far-red light-absorbing forms of phytochromes.
Figure 2
Figure 2. Analysis of AsphyA-PIF interactions and kinase activity.
(a) Protein kinase activities of AsphyA on other PIFs. In all, 1 μg of full-length AsphyA (∼0.2 μM) and 1 μg of each phyA-interacting PIF (PIF1, PIF3 and PIF4 as substrates) were used for this analysis. AsphyA autophosphorylation without substrate was included as a control. (b) Interaction of AsphyA with PIF1, PIF3 and PIF4. The concentration of PIF1 proteins used in this assay was four times higher than that of PIF3 and PIF4. Both Pr and Pfr forms of full-length AsphyA proteins were incubated with PIFs, and glutathione bead-bound proteins were then analysed by western blot analysis with anti-AsphyA (oat22) or anti-GST antibody. (c) Protein–protein interaction analysis between AsphyA and APA/APB motif-deleted PIF3 (Δ210-PIF3) or PIF7. (d) Phosphorylation of Δ210-PIF3 and PIF7 by AsphyA. PIF3 was included as controls. APA, active phyA-binding motif; APB, active phyB-binding motif.
Figure 3
Figure 3. The proposed protein kinase domain of AsphyA resides in the N-terminal photosensory core composed of PAS-GAF-PHY tri-domain.
(a) Constructs used for kinase domain mapping of AsphyA. (b,c) Autophosphorylation (b) and kinase activity (c) assays of domain-deletion AsphyA mutants. PIF3 was used as the substrate for the kinase assays. Asterisks on SDS-PAGE in c indicate the corresponding AsphyA protein bands. Intensities (Irel) of AsphyA autophosphorylation and PIF3 phosphorylation are normalized on the basis of same molar concentrations and expressed relative to the first lanes (that is, Pr forms of FL-AsphyA). (d) Protein–protein interaction analysis between PIF3 and the photosensory core. 1.0 μg of full-length AsphyA (FL-AsphyA) or the photosensory core (66–610aa fragment of AsphyA) was incubated with 1.0 μg of GST/strep-fused PIF3. (e) Kinase activity assays of the photosensory core using PIF3 as a substrate. 4 pmol of full-length AsphyA or the photosensory core (66–610) was reacted with 4 pmol of PIF3 for these analyses (that is, ∼0.2 μM for each protein). Intensities of PIF3 phosphorylation are expressed relative to lane 1 (Pr form of FL-AsphyA). (f) Kinase activity assays of apo- and holo-proteins of the photosensory core. The apo-proteins (Apo) were prepared from P. pastoris cells without addition of chromophore (phycocyanobilin), and the holo-proteins (Pr and Pfr) were prepared by adding phycocyanobilin to purified apo-proteins. Zinc-fluorescence assay (Zinc) was shown to confirm the chromophore-assembled holo-proteins. GAF, cGMP phosphodiesterase/Adenylate cyclase/FhlA domain; NTE, N-terminal extension; PAS, Per/Arnt/Sim domain; PHY, phytochrome-specific GAF-related domain; PRD, PAS-related domain.
Figure 4
Figure 4. Phosphorylation analyses of AsphyA mutants with reduced kinase activity.
(a) Kinase activity assays of the AsphyA mutants. In all, 1.0 μg of GST/strep-fused PIF3 (∼0.3 μM) was added as a substrate in reaction mixtures with 1.0 μg of either full-length WT or a mutant (K411L, T418D or D422R) AsphyA protein (∼0.2 μM). (b) Protein–protein interaction analysis between PIF3 and the AsphyA kinase mutants. GST was included as a negative control. (c) ATP-binding affinity assays of AsphyA kinase mutants using photoaffinity labelling with 8-azido-ATP. 1.0 μg of full-length AsphyA protein (∼80 nM) was labelled with the indicated concentrations of 8-azido-ATP. The percentages of 8-azido-ATP labeling were obtained where the labelling of WT AsphyA with 5 μM azido-ATP was assumed as 100%. Error bars represent s.d. from three independent measurements.
Figure 5
Figure 5. Photoresponse analyses of transgenic phyA-201 plants with AsphyA kinase mutants under far-red light.
(a) Western blot analysis to show the protein levels of AsphyA in transgenic plants. Loading controls are shown in the lower panel. phyA-201, phyA-deficient Arabidopsis thaliana (Ler ecotype); WT-OX6, transgenic phyA-201 plant with WT AsphyA; K411L, T418D and D422R, transgenic phyA-201 plants with corresponding AsphyA kinase mutant. (b) Hypocotyl de-etiolation of representative seedlings grown for 5 days under cFR light condition (10 μmol m−2 s−1). Scale bar, 5 mm. (c) Far-red fluence-rate response curves for the inhibition of hypocotyl growth. Data are expressed as means±s.d. (n≥30). (d) Cotyledon expansion of 4-day-grown seedlings under cFR. (e) Comparisons of cotyledon areas. Data are expressed as means±s.d. (n≥15). Statistically significant changes compared with WT-OX6 are indicated (***P<0.001, as determined using Tukey's test). (f) Quantitative RT-PCR analysis of PRR9 and HY5 in 3-day-old etiolated seedlings exposed to 2 h far-red (10 μmol m−2 s−1). Statistically significant changes compared with WT-OX6 are indicated (***P<0.001, Tukey's test, n=3 replicates).
Figure 6
Figure 6. Far-red light-mediated phosphorylation and degradation of PIF3 is prevented in transgenic plants with AsphyA kinase mutants.
(a) PIF3 degradation under different light conditions. 4-day-old dark-grown seedlings were exposed to either cR (10 μmol m−2 s−1) or cFR (10 μmol m−2 s−1) for 30 min and 2 h, respectively. Loading controls are shown in the lower panels. (b) Far-red-induced phosphorylation of PIF3. Four-day-old dark-grown seedlings were exposed to FRp (7,500 μmol m−2) and incubated in the dark for the time indicated before collecting for protein extraction. (c) A proposed model for the function of phyA as a protein kinase. For simplicity, PIF3 and phyA are depicted in this model as monomers, but they exist as dimers. In the dark, PIF3 proteins accumulate in the nucleus and regulate the expression of light-responsive genes to prevent photomorphogenesis. In the light, we propose that PfrA in the nucleus interacts and phosphorylates PIF3 directly, which induces PIF3 degradation via the ubiquitin/26S proteasome protein-degradation pathway. Thus, PIF3 phosphorylation by phyA and its subsequent degradation might induce the signal for the initiation of photomorphogenesis. 26S, 26S proteasome complex; P, phosphate; PfrA, Pfr form of phyA; PrA, Pr form of phyA.

Similar articles

Cited by

References

    1. Rockwell N. C., Su Y. S. & Lagarias J. C. Phytochrome structure and signaling mechanisms. Annu. Rev. Plant Biol. 57, 837–858 (2006). - PMC - PubMed
    1. Li J., Li G., Wang H. & Deng X. W. Phytochrome signaling mechanisms. Arabidopsis Book 9, e0148 (2011). - PMC - PubMed
    1. Bae G. & Choi G. Decoding of light signals by plant phytochromes and their interacting proteins. Annu. Rev. Plant Biol. 59, 281–311 (2008). - PubMed
    1. Fankhauser C. & Chen M. Transposing phytochrome into the nucleus. Trends Plant Sci. 13, 596–601 (2008). - PubMed
    1. Henriques R., Jang I. C. & Chua N. H. Regulated proteolysis in light-related signaling pathways. Curr. Opin. Plant Biol. 12, 49–56 (2009). - PubMed

Publication types

MeSH terms

Substances

LinkOut - more resources