. 2016 May 11;19(5):731-43.
doi: 10.1016/j.chom.2016.04.017.

Genetic Determinants of the Gut Microbiome in UK Twins

Affiliations

Genetic Determinants of the Gut Microbiome in UK Twins

Julia K Goodrich et al. Cell Host Microbe. .

Abstract

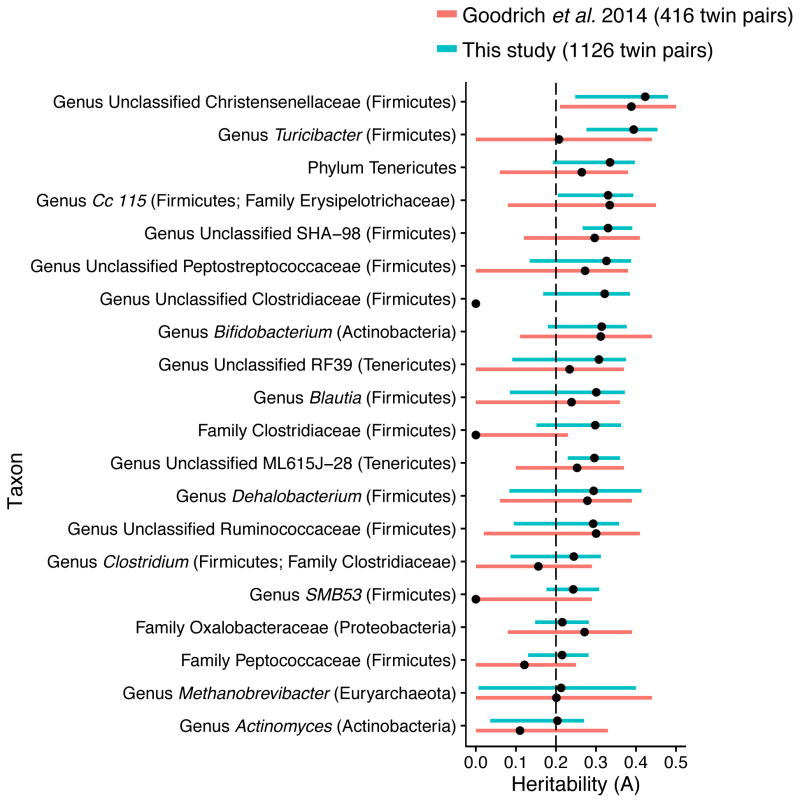
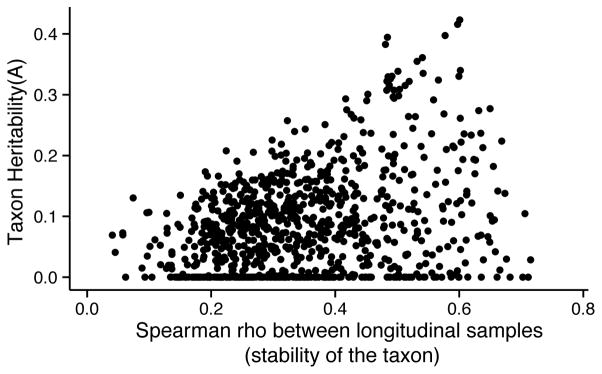
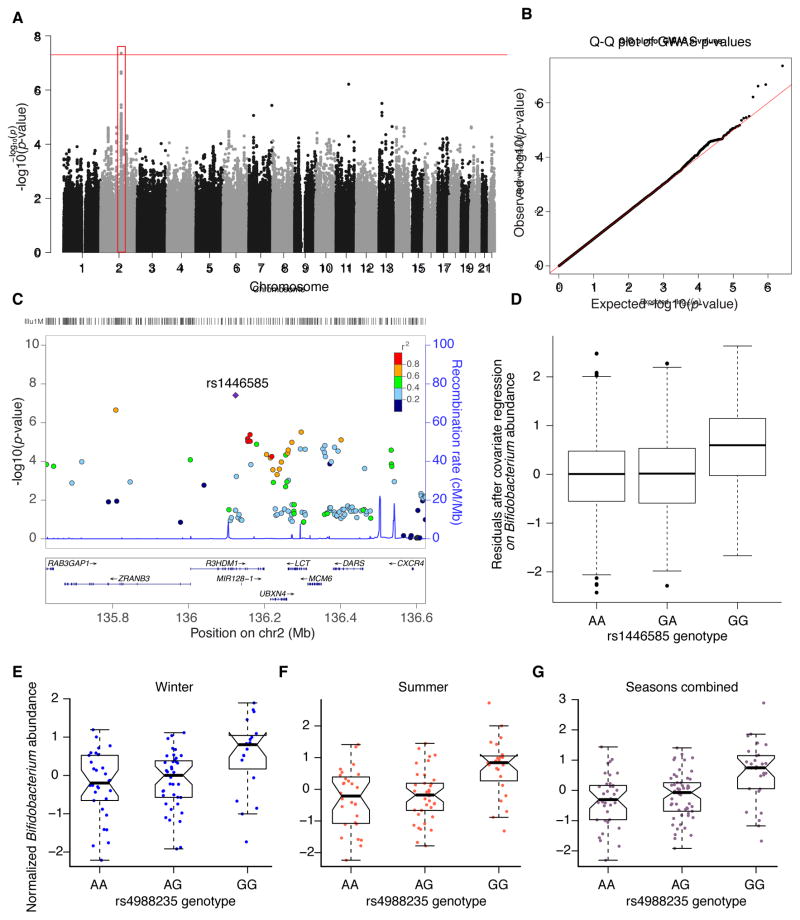
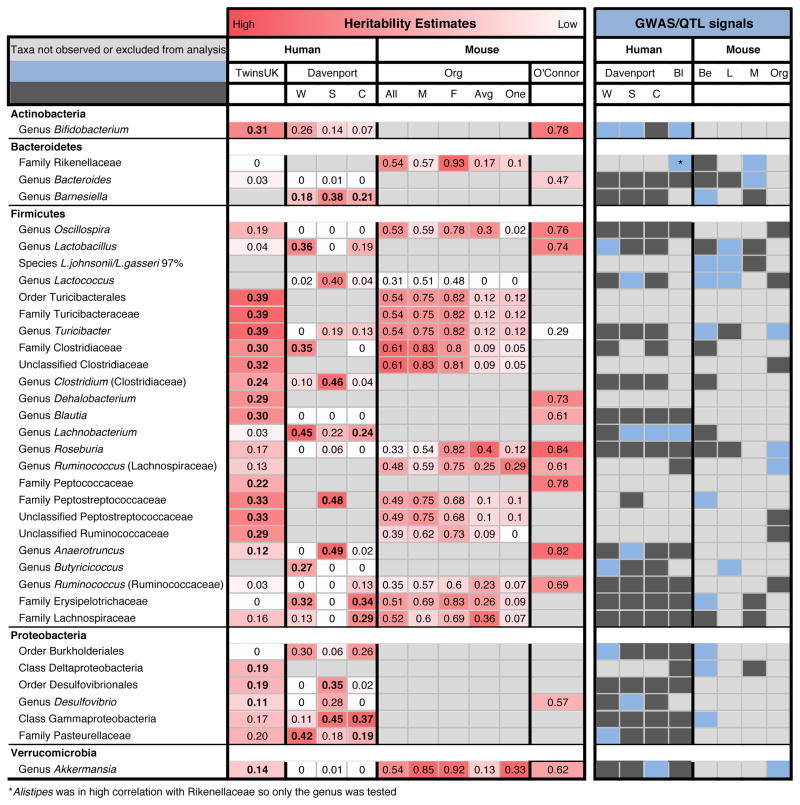
Studies in mice and humans have revealed intriguing associations between host genetics and the microbiome. Here we report a 16S rRNA-based analysis of the gut microbiome in 1,126 twin pairs, a subset of which was previously reported. Tripling the sample narrowed the confidence intervals around heritability estimates and uncovered additional heritable taxa, some of which are validated in other studies. Repeat sampling of subjects showed heritable taxa to be temporally stable. A candidate gene approach uncovered associations between heritable taxa and genes related to diet, metabolism, and olfaction. We replicate an association between Bifidobacterium and the lactase (LCT) gene locus and identify an association between the host gene ALDH1L1 and the bacteria SHA-98, suggesting a link between formate production and blood pressure. Additional genes detected are involved in barrier defense and self/non-self recognition. Our results indicate that diet-sensing, metabolism, and immune defense are important drivers of human-microbiome co-evolution.


Figures

Figure 1
Figure 1. Expansion of the TwinsUK dataset results in similar microbial abundance heritability estimates with narrower confidence intervals
Each point represents the heritability estimated as the proportion of variance in the microbial abundances (OTU abundances collapsed by taxonomic classification) that can be attributed to genetic effects (A). The bars show the 95% confidence intervals around the heritability estimates. Bars are colored by the dataset: Pink indicates heritability estimates reported in Goodrich et al. 2014 (171 MZ, 245 DZ) and Blue indicates heritability estimates using an additional 710 twin pairs (Blue; 637 MZ, 489 DZ twin pairs). The figure includes only taxa that are present in at least 50% of the TwinsUK participants and have A > 0.2 in the increased dataset. We also excluded any taxon that was highly correlated (r > 0.9) with another taxon at a lower taxonomic level. The Clostridium genus is known to be polyphyletic, however further examination revealed that the genus Clostridium within the Clostridiaceae family consists of mostly one Greengenes OTU 4465124 that is shared by 82.6% of the samples. See also Figure S1 and Table S1.
Figure 2
Figure 2. Alpha- and Beta- diversity are correlated with several microbiota that have a heritability estimate > 0.2
Heatmap showing the correlation structure between the alpha-diversity metrics, the first three principal coordinates of the beta-diversity distance matrices, and the taxa that are correlated at |r| > 0.5 with one of the alpha- or beta- diversity metrics in the heatmap. See also Table S2.
Figure 3
Figure 3. Heritable taxa are among the most stable taxa in the TwinsUK dataset
Heritability (A) of the microbial abundances (OTU abundances and abundances collapsed by taxonomic classification) are plotted against the Spearman correlation between longitudinal samples (530 individuals with samples collected at a second time-point spaced 946 +/− 15 days (mean +/− s.e.m)).
Figure 4
Figure 4. Relative abundances of the heritable genus Bifidobacterium are associated with genetic variants in the genomic locus containing the gene LCT
(A) Genome-wide Manhattan plot: the x-axis represents the chromosome and position along the chromosome, and the y-axis is −log of the P-value for the association of the SNP (each dot) with the genus Bifidobacterium. The red box highlights the associated locus on chromosome 2 that contains the gene LCT. (B) Quantile-Quantile (Q-Q) plots of the P-values. The Q-Q plot measures deviation from the expected distribution of P-values. The diagonal (red) line represents the expected (null) distribution. (C) Close-up plots of a 1 Mb window around the SNP with the highest association, the coloring of the points represents r2 between a SNP and the SNP with the highest association in the locus (rs1446585, denoted by the purple diamond); r2 is calculated from the 1000 Genomes data on the CEU population. (D) Box-plot of Bifidobacterium normalized abundances within each genotype at the most strongly associated SNP (rs1446585; P-value = 4.38 × 10⁻⁸), the y-axis depicts the residuals from linear regression of the Box-Cox transformed abundances with the covariates (the number of 16S rRNA gene sequences per sample, age, gender, shipment date, collection method (postal or visit), ID of technician performing DNA extraction). (E–G). Normalized Bifidobacterium abundance within each genotype at the lactase persistence-associated SNP (rs4988235) in the Hutterite dataset. (E) Winter samples (P-value = 0.02). (F) Summer samples (P-value = 0.001). (G) Seasons combined (P-value = 4 × 10 −5). See also Table S5 and Table S6.
Figure 5
Figure 5. Comparison of taxa estimated as heritable or linked to genes in at least two human GWA or mouse QTL studies
The color gradient over the heritability estimates ranges from the lowest heritability estimate (White) to the highest heritability estimate (Red) in the given study. For the TwinsUK heritability estimates the bold values indicate heritability estimates with a 95% confidence interval not overlapping 0. The estimates for Davenport et al. (2015) are the proportion of variance explained (PVE) estimates (“chip heritability”). We report the Winter (W), Summer (S), and seasons Combined (C) datasets. For the Davenport study bold values indicate heritability estimates with a standard error not overlapping 0. For Org et al. (2015) we report results using all mice (All), just males (M), just females (F), using an average per strain (Avg), and using a single mouse per strain (One). No significance value was reported for the Org and O’Connor heritability estimates. The coloring over the QTL/GWAS studies indicates if each taxon had a significant association (Blue) or not (Dark Grey) in the given study. Light grey indicates that the taxon was not observed in the given study or was excluded from the studies analysis for other reasons. The QTL and GWAS studies shown in the figure are the top GWAS hits from Davenport et al. (2015) (Davenport), the top stool GWAS results from Blekhman et al. (2015) (Bl), QTL results form Benson et al. (2010) (B), QTL results from Leamy et al. (2014) (L), QTL results from McKnite et al. (2012) (M), and GWAS results from Org et al. (2015) (Org). See Experimental Procedures for more details.

References

    1. Angata T, Tabuchi Y, Nakamura K, Nakamura M. Siglec-15: an immune system Siglec conserved throughout vertebrate evolution. Glycobiology. 2007;17:838–846. - PubMed
    1. Bachmanov AA, Beauchamp GK. Taste receptor genes. Annu Rev Nutr. 2007;27:389–414. - PMC - PubMed
    1. Benson AK, Kelly SA, Legge R, Ma F, Low SJ, Kim J, Zhang M, Oh PL, Nehrenberg D, Hua K, et al. Individuality in gut microbiota composition is a complex polygenic trait shaped by multiple environmental and host genetic factors. Proc Natl Acad Sci USA. 2010;107:18933–18938. - PMC - PubMed
    1. Blekhman R, Goodrich JK, Huang K, Sun Q, Bukowski R, Bell JT, Spector TD, Keinan A, Ley RE, Gevers D, et al. Host genetic variation impacts microbiome composition across human body sites. Genome Biol. 2015;16:191. - PMC - PubMed
    1. Boone DR, Johnson RL, Liu Y. Diffusion of the Interspecies Electron Carriers H(2) and Formate in Methanogenic Ecosystems and Its Implications in the Measurement of K(m) for H(2) or Formate Uptake. Appl Environ Microbiol. 1989;55:1735–1741. - PMC - PubMed

Publication types