. 2016 May 13:7:11552.
doi: 10.1038/ncomms11552.

Symmetric spike timing-dependent plasticity at CA3-CA3 synapses optimizes storage and recall in autoassociative networks

Affiliations

Symmetric spike timing-dependent plasticity at CA3-CA3 synapses optimizes storage and recall in autoassociative networks

Rajiv K Mishra et al. Nat Commun. .

Abstract

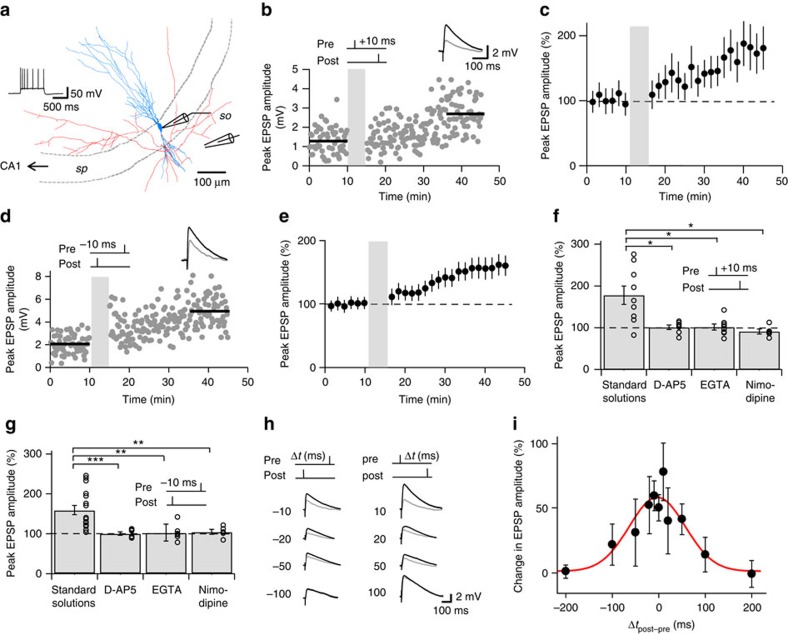
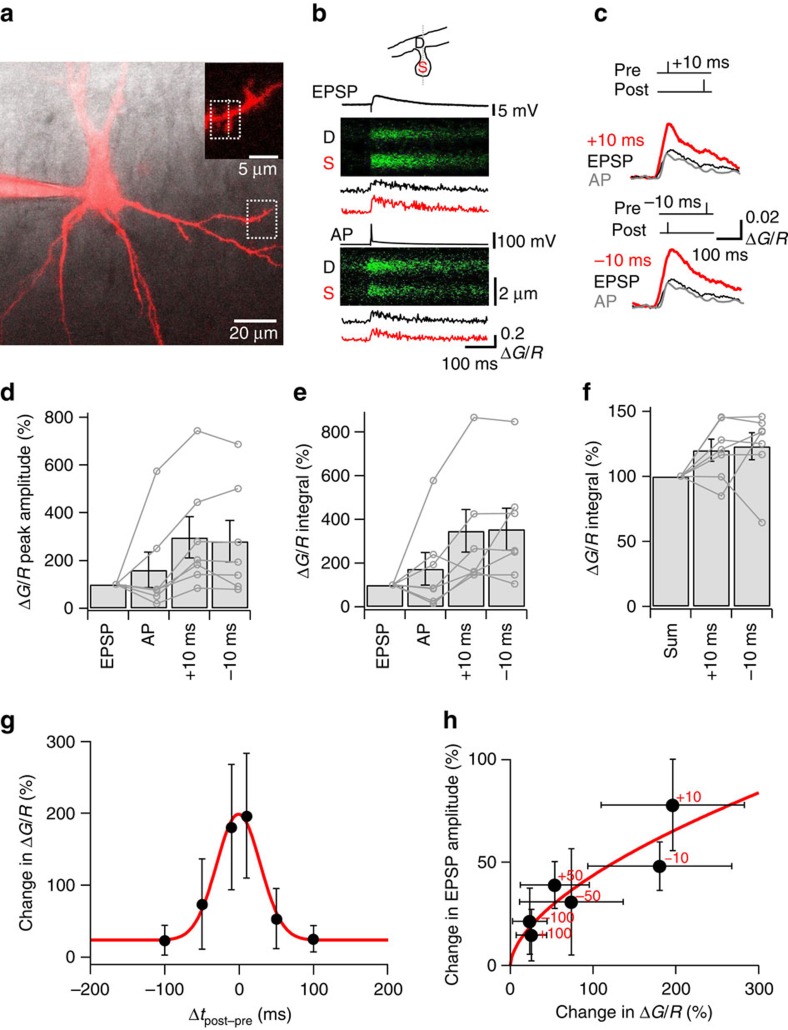
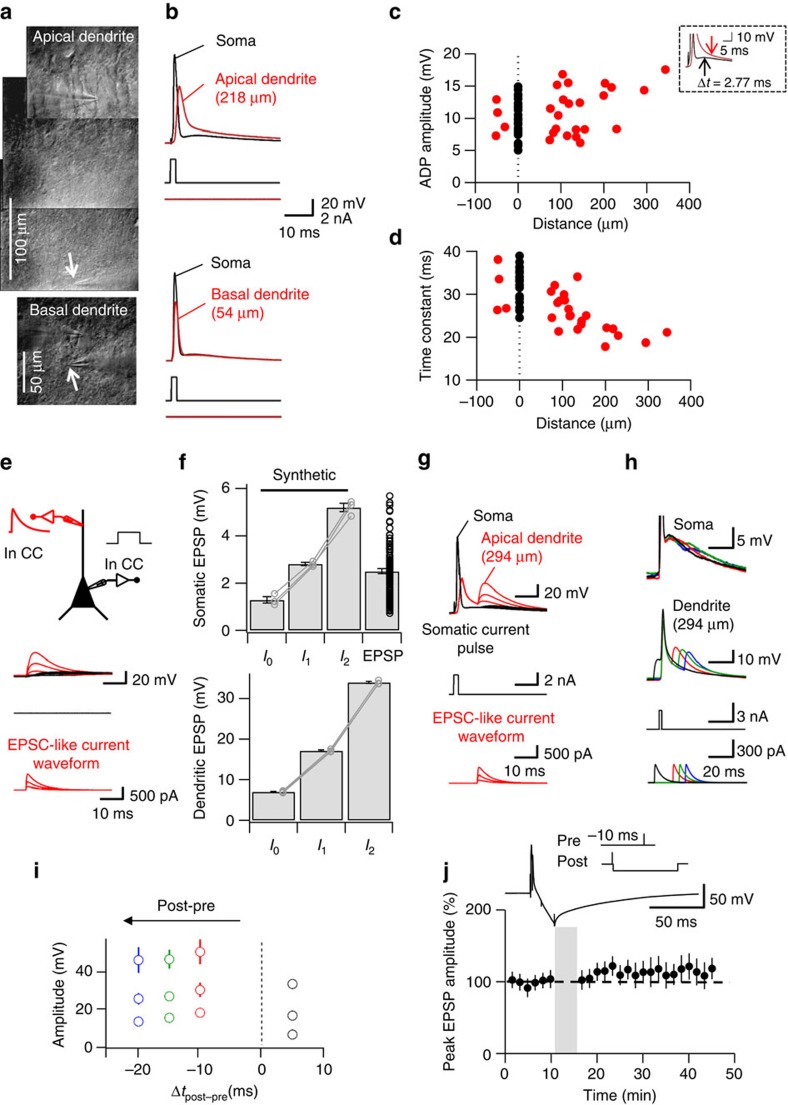
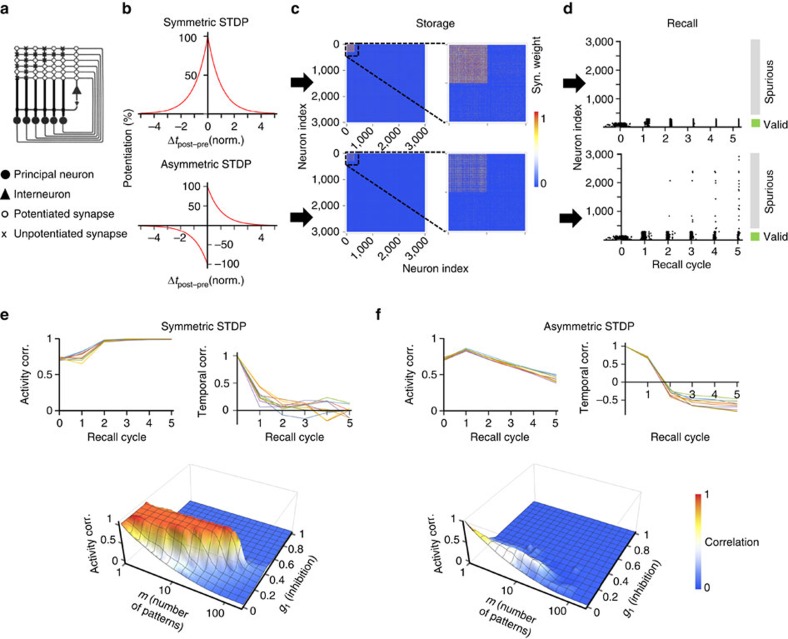
CA3-CA3 recurrent excitatory synapses are thought to play a key role in memory storage and pattern completion. Whether the plasticity properties of these synapses are consistent with their proposed network functions remains unclear. Here, we examine the properties of spike timing-dependent plasticity (STDP) at CA3-CA3 synapses. Low-frequency pairing of excitatory postsynaptic potentials (EPSPs) and action potentials (APs) induces long-term potentiation (LTP), independent of temporal order. The STDP curve is symmetric and broad (half-width ∼150 ms). Consistent with these STDP induction properties, AP-EPSP sequences lead to supralinear summation of spine [Ca(2+)] transients. Furthermore, afterdepolarizations (ADPs) following APs efficiently propagate into dendrites of CA3 pyramidal neurons, and EPSPs summate with dendritic ADPs. In autoassociative network models, storage and recall are more robust with symmetric than with asymmetric STDP rules. Thus, a specialized STDP induction rule allows reliable storage and recall of information in the hippocampal CA3 network.


Figures

Figure 1
Figure 1. Noncanonical STDP induction rules at CA3–CA3 recurrent synapses.
(a) Neurolucida reconstruction of a representative CA3 pyramidal neuron filled with biocytin. Inset shows AP phenotype (1-s current pulse, 630 pA); recording and stimulation pipettes are indicated schematically. Blue, soma and dendrites; red, axon; sp, stratum pyramidale; so, stratum oriens. (b,c) Pre–postsynaptic pairing induces LTP at CA3–CA3 recurrent synapses. Plot of compound EPSP peak amplitude against experimental time before and after pre–postsynaptic pairing (Δt=+10 ms; vertical grey bars). Single-cell data (b) and mean data (c; 9 cells). (d,e) Post–presynaptic pairing also induces LTP. Similar plot as in b, c, but for post–presynaptic pairing (with Δt=–10 ms). Single-cell data (d) and mean data (e; 17 cells). Insets in b and d show the average of 60 evoked EPSPs before (black) and 20–30 min after induction (grey). Scale bar in b also applies in d. In c and e, EPSP amplitude was normalized to the control value before LTP induction (dashed line). (f,g) Multiple Ca2+ sources were necessary for STDP induction. Summary bar graph shows the effects of 20 μM of the NMDA receptor antagonist D-AP5 (extracellular; 7 and 6 cells), 20 mM of the Ca2+ chelator EGTA (intracellular; 8 and 6 cells) and 10 μM of the L-type Ca2+ channel blocker nimodipine (extracellular; 5 and 5 cells, respectively) on pairing-induced LTP for pre–postsynaptic (f) and post–presynaptic sequences (g). Circles represent data from individual cells, bars indicate mean±s.e.m. LTP with both pairing paradigms was largely abolished by all manipulations. (h,i) A broad and symmetric STDP curve at CA3–CA3 synapses. Magnitude of potentiation induced by pre–postsynaptic and post–presynaptic pairing was plotted against pairing time interval Δt. Representative average traces are shown in h (grey, before induction; black, 20–30 min after induction), plot of LTP magnitude (expressed as % increase over baseline) against Δt is shown in i (69 cells total). Red curve, Gaussian function without offset fit to the data points. *, P<0.05; **, P<0.01; ***, P<0.001.
Figure 2
Figure 2. Summation of EPSP- and AP-induced [Ca2+] transients in spines of CA3 pyramidal neurons.
(a) Fluorescence image of a CA3 pyramidal neuron loaded with Fluo-5F and Alexa Fluor 594 (maximum projection of stack of 48 1-μm confocal sections; excitation wavelength 594 nm), superimposed with the corresponding infrared-DIC image. The region indicated by the box is shown on an expanded scale in inset. (b) Spine [Ca2+] transients evoked by synaptic stimulation and backpropagated APs. Top, schematic illustration of the line scan configuration (dotted line, 400 Hz). Centre, [Ca2+] transient during a synaptically evoked EPSP. Bottom, [Ca2+] transient during a backpropagated AP. In each panel, upper graph represents membrane potential trace, middle shows G fluorescence signal against distance (vertical axis) and time (horizontal axis), and bottom indicates ΔG/R versus time in the dendrite (black) and the spine (red). (c) [Ca2+] transients during EPSPs (black traces), APs (grey traces), pre–postsynaptic pairing (Δt=+10 ms; red trace, top), and post–presynaptic pairing (Δt=−10 ms; red trace, bottom). Note that pairing markedly increased the peak amplitude of the [Ca2+] transient in comparison to isolated EPSPs. (d,e) Summary of the amplitude (d) and integral (e) of [Ca2+] transients evoked by single EPSPs, single APs, pre–postsynaptic pairing (Δt=+10 ms) and post–presynaptic pairing (Δt=−10 ms). Data were normalized to the EPSP value. Circles represent data from individual cells, bars indicate mean±s.e.m. Data from the same cell were connected by lines. (f) Supralinearity of summation. Summary bar graph shows integral values, normalized to the arithmetic sum of EPSP and AP values. Data in df from 7 cells. (g) A broad and symmetric [Ca2+] transient summation curve in CA3 pyramidal neuron spines. Peak amplitude of [Ca2+] transients during combined pre–postsynaptic or post–presynaptic stimulation, normalized to that of isolated EPSPs, was plotted against pairing time interval Δt (7 cells total). Red curve, Gaussian function with offset fit to the data points (best-fit value for offset, 23.7%). Note that the [Ca2+] transient amplitude versus pairing interval curve was broad and symmetric, similar to the STDP curve. (h) Plot of change in EPSP amplitude against change of [Ca2+] transients during different pairing sequences. Numbers near symbols represent the values of Δt between AP and EPSP (red, in ms). EPSP potentiation data were taken from Fig. 1. Red curve, power function fit to the data points (power coefficient 0.59).
Figure 3
Figure 3. Dendritic afterdepolarization may represent the associative signal for LTP induction during post–presynaptic pairing.
(a) Dendritic recording from apical (top) and basal CA3 pyramidal neuron dendrites (bottom). Infrared-DIC videomicrographs (photomontage for top graph) taken under experimental conditions. Arrows indicate dendritic recording sites. (b) The ADP has comparable amplitude at soma and dendrite. Dendritic recording sites 218 μm (top) and 54 μm (bottom) from the soma. Somatic (black) and dendritic AP (red), evoked by somatic current injection. (c) ADP amplitude remains constant as a function of distance from soma. Positive and negative distance values represent apical and basal recordings, respectively. Black, somatic ADP; red, dendritic ADP. Inset shows procedure to measure the ADP in the dendrite (at 294 μm). Note that the ADP amplitude shows a slight, but insignificant increase as a function of distance (26 simultaneous dendritic-somatic recordings, Spearman rank correlation coefficient r=0.26; P=0.065). (d) Similar plot as shown in c, but for ADP decay time constant. Note that the ADP becomes faster with increasing distance (r=0.72; P<0.001). (e) Properties of synthetic EPSPs, evoked by dendritic current injection. Top, schematic illustration of the recording configuration. Bottom, dendritic EPSPs (red) and somatic EPSPs (black). (f) Summary bar graph of peak amplitudes of synthetic EPSPs at the soma (top) and the dendrite (bottom). I0, I1 and I2 correspond to peak current amplitudes of 123, 306 and 610 pA, respectively (three simultaneous dendritic-somatic recordings). Right bar, top shows peak amplitudes of EPSPs evoked by extracellular stimulation (163 cells). (g) Summation of synthetic EPSPs with preceding ADPs. APs were evoked by somatic current injection, and synthetic EPSPs were generated by dendritic current injection (amplitudes I0, I1 and I2; Δt=−10 ms). (h) Similar traces as shown in g, but for dendritic current injection amplitude I1 and Δt=5 ms (black), –10 ms (red), –15 ms (green) and –20 ms (blue). (i) Plot of peak amplitude of the summated signal in the dendrite against AP–EPSP pairing interval Δt (3 simultaneous dendritic-somatic recordings). (j) Conversion of the ADP into an afterhyperpolarization during a post–presynaptic sequence abolishes LTP. Top, post–presynaptic pairing protocol (Δt=–10 ms) combined with hyperpolarizing somatic current injection and corresponding membrane potential trace. Bottom, plot of mean compound EPSP peak amplitude against experimental time before and after post–presynaptic pairing (Δt=−10 ms) with afterhyperpolarization (9 cells).
Figure 4
Figure 4. Symmetric STDP facilitates storage and retrieval of patterns in an autoassociative network model.
(a) Schematic illustration of network topology. The model is composed of several principal neurons (filled circles) and an inhibitory interneuron (filled triangle). Principal cells are interconnected by excitatory synapses (potentiated, open circles; unpotentiated, crosses). In the schematic, there are six pyramidal cells; the real model was composed of 3,000 pyramidal neurons. The mixture of potentiated and unpotentiated synapses in the matrix was generated by prior application of three binary activity patterns (001011, 101010 and 000111). Modified from McNaughton and Morris. See Supplementary Table 1. (b) Plasticity rules. Top, symmetric STDP rule, as supported by the present results. Bottom, asymmetric STDP rule. Δt was given in normalized units, which could correspond to one theta oscillation cycle (∼200 ms). (c) Storage of patterns in the synaptic matrix. Synaptic weight was represented as temperature map (red, maximal potentiation; blue, unpotentiated). A single test pattern in the first 300 neurons and 10 additional patterns in randomly selected neurons were applied during storage, with randomized spike time in both cases. Ordinate and abscissa represent index of pre- and postsynaptic neuron, respectively. Insets (right) show expanded views for first 600 cells. Note that the symmetric STDP rule (top) induces a higher average potentiation than the asymmetric rule (bottom). (d) Recall of patterns in the network model. Recall was triggered by partial test patterns (50% valid firings, no spurious firings in comparison to original pattern) with randomized spike timing. With the symmetric STDP rule (top; proportionality factor of inhibition g1=0.3), the original pattern was perfectly retrieved after three recall cycles. With the asymmetric rule (bottom; g1=0.1), retrieval was only partial, with decrease in valid and increase in spurious firing. (e,f) Top, dependence of activity correlation (left) and spike-time correlation for active cells (right) on recall cycle number for symmetric (top) and asymmetric STDP rules (bottom). Coloured lines represent pattern correlation trajectories for 10 patterns. For the symmetric STDP rule, activity correlation increases, whereas spike-time correlation is eliminated. For the asymmetric STDP rule, activity correlation declines, whereas spike-time correlation becomes inverted. Bottom, three-dimensional plot of activity correlation at the 5th recall cycle versus pattern load m and proportionality factor of inhibition g1 for symmetric (e) and asymmetric (f) STDP rules. For the symmetric rule, capacity was 58.1, whereas for the asymmetric rule it was 4.5. Corr., correlation.

References

    1. Kesner R. P. Behavioral functions of the CA3 subregion of the hippocampus. Learn. Mem. 14, 771–781 (2007). - PubMed
    1. Marr D. Simple memory: a theory for archicortex. Philos. Trans. R. Soc. Lond. B Biol. Sci. 262, 23–81 (1971). - PubMed
    1. Hopfield J. J. Neural networks and physical systems with emergent collective computational abilities. Proc. Natl Acad. Sci. USA 79, 2554–2558 (1982). - PMC - PubMed
    1. McNaughton B. L. & Morris R. G. M. Hippocampal synaptic enhancement and information storage within a distributed memory system. Trends Neurosci. 10, 408–415 (1987).
    1. Lisman J. E. Relating hippocampal circuitry to function: recall of memory sequences by reciprocal dentate-CA3 interactions. Neuron 22, 233–242 (1999). - PubMed

Publication types

MeSH terms