. 2016 May 13:6:25985.
doi: 10.1038/srep25985.

Magnetic Properties of Strontium Hexaferrite Nanostructures Measured with Magnetic Force Microscopy

Affiliations

Magnetic Properties of Strontium Hexaferrite Nanostructures Measured with Magnetic Force Microscopy

Qiang Li et al. Sci Rep. .

Abstract

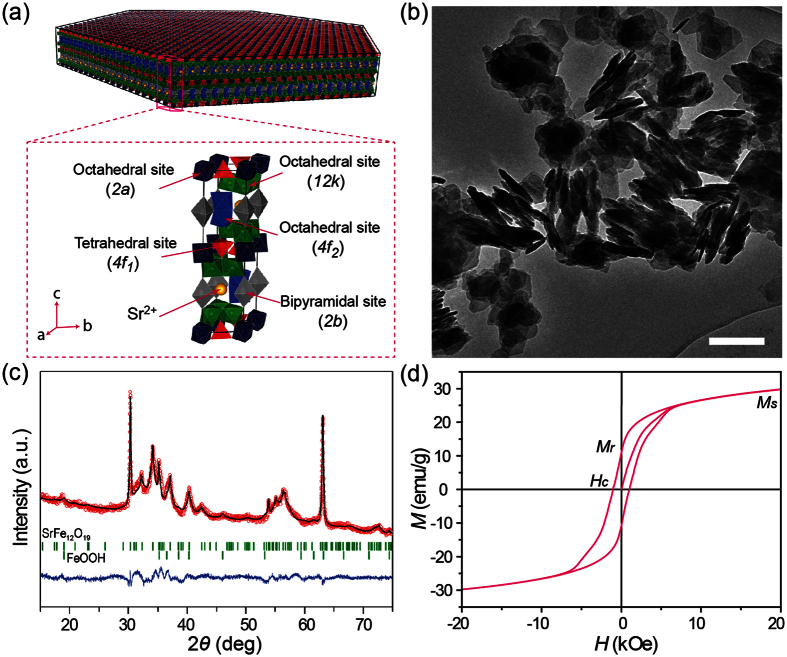
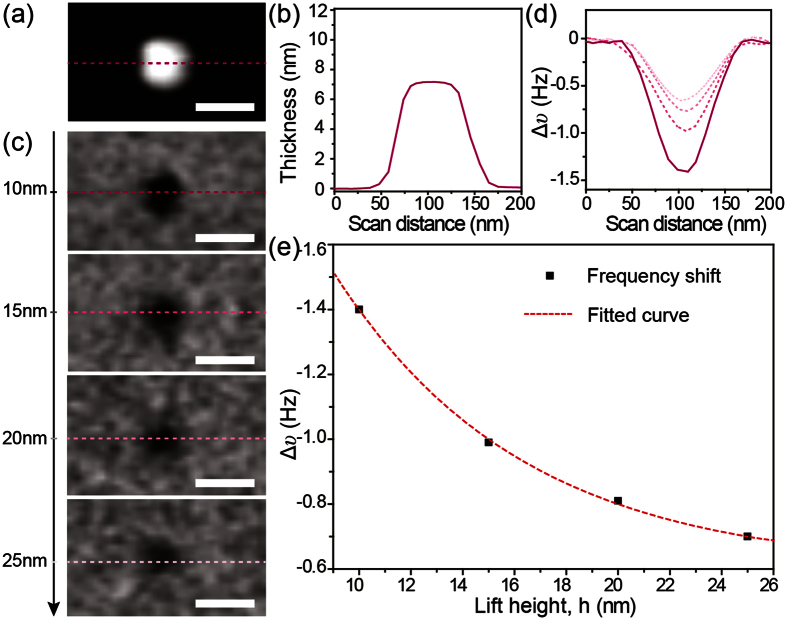
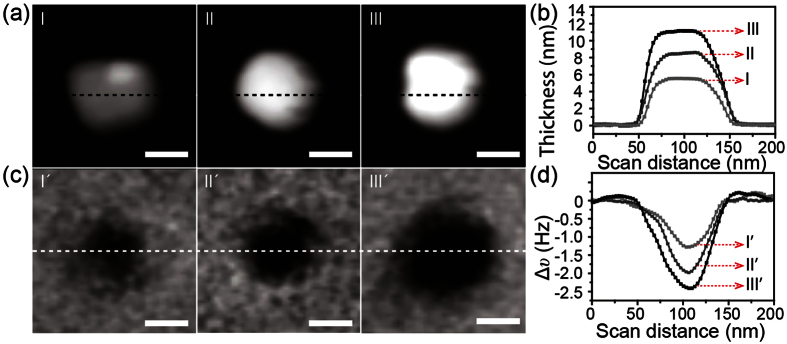
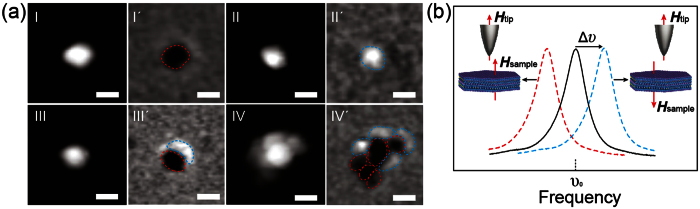
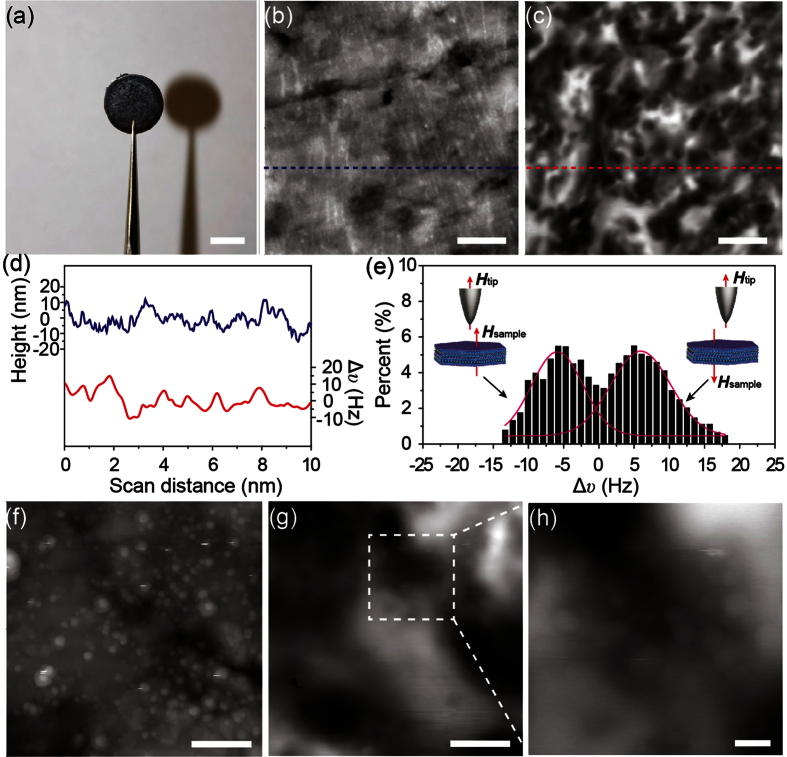
Magnetic property is one of the important properties of nanomaterials. Direct investigation of the magnetic property on the nanoscale is however challenging. Herein we present a quantitative measurement of the magnetic properties including the magnitude and the orientation of the magnetic moment of strontium hexaferrite (SrFe12O19) nanostructures using magnetic force microscopy (MFM) with nanoscale spatial resolution. The measured magnetic moments of the as-synthesized individual SrFe12O19 nanoplatelets are on the order of ~10(-16) emu. The MFM measurements further confirm that the magnetic moment of SrFe12O19 nanoplatelets increases with increasing thickness of the nanoplatelet. In addition, the magnetization directions of nanoplatelets can be identified by the contrast of MFM frequency shift. Moreover, MFM frequency imaging clearly reveals the tiny magnetic structures of a compacted SrFe12O19 pellet. This work demonstrates the mesoscopic investigation of the intrinsic magnetic properties of materials has a potential in development of new magnetic nanomaterials in electrical and medical applications.


Figures

Figure 1
Figure 1
(a) Schematic hexagonal nanoplatelet and crystal structure of the M-type SrFe12O19. The polyhedra with different color depict the different Fe3+ sites with their surrounding O2− ions. The yellow spheres depict the Sr2+ ions. (b) Bright-field TEM image of the as-synthesized SrFe12O19 samples, confirming the hexagonal nanoplatelet morphology. The scale bar is 200 nm. (c) The Rietveld refinement of powder XRD pattern of the as-synthesized SrFe12O19 samples. The red line represents the experimental data, and the black line is the calculated pattern; the green vertical bars are the expected Bragg reflection positions, and the difference between the experimental data and the calculated pattern is shown in blue at the bottom. (d) M-H hysteresis loop for the as-synthesized SrFe12O19 samples measured at 300 K.
Figure 2
Figure 2
(a) AFM height image of a SrFe12O19 nanoplatelet and (b) height profile along the dashed line marked in (a). (c) MFM frequency images and (d) frequency shift profiles measured at different lift heights h = 10, 15, 20, 25 nm. (e) Obtained frequency shifts as a function of lift height. The black square symbols correspond to the maximum frequency shift obtained from the frequency images in (c). The dashed red line is the fit of the frequency shift value using Equation 3. All scale bars are 100 nm.
Figure 3
Figure 3
(a) AFM height images of three SrFe12O19 nanoplatelets with different thickness and (b) height profiles along the dashed black lines marked in (a). (c) Corresponding MFM frequency images and (d) frequency shift profiles along the dashed white lines marked in (c). All scale bars are 50 nm.
Figure 4
Figure 4
(a) AFM height images of three individual SrFe12O19 nanoplatelets and one SrFe12O19 nanoplatelet aggregate and their corresponding MFM frequency images. All scale bars are 100 nm. (b) Schematic representation of the changes in resonance frequency (solid black curve) of the AFM cantilever due to the magnetic force gradient; in this case, the frequency shift (dashed red curve) reflects an attractive force gradient, and the frequency shift (dashed blue curve) reflects an repulsive force gradient.
Figure 5
Figure 5
(a) Digital camera image of the compacted SrFe12O19 pellet. Scale bar is 4 mm. (b) AFM height image and (c) the corresponding MFM frequency image of the surface of the compacted pellet. Scale bars are 2 μm. (d) Height and frequency shift profiles measured along the dashed lines marked in height image (b) and frequency image (c). (e) Frequency shift distribution obtained from the MFM frequency image (c). (f) Zoom-in AFM height image and (g) the corresponding MFM frequency image. Scale bars are 500 nm. (h) A close-up of the MFM frequency image, corresponding to the dashed white square in (g). Scale bar is 100 nm.

References

    1. Awschalom D. D., DiVincenzo D. P. & Smyth J. F. Macroscopic Quantum Effects in Nanometer-Scale Magnets. Science 258, 414–421 (1992). - PubMed
    1. Sun S., Murray C. B., Weller D., Folks L. & Moser A. Monodisperse FePt Nanoparticles and Ferromagnetic FePt Nanocrystal Superlattices. Science 287, 1989–1992 (2000). - PubMed
    1. Papaefthymiou G. C. Nanoparticle Magnetism. Nano Today 4, 438–447 (2009).
    1. Sato K. Magnetic Nanoparticles: When Atoms Move Around. Nat. Mater. 8, 924–925 (2009). - PubMed
    1. Reiss G. & Hutten A. Magnetic Nanoparticles: Applications beyond Data Storage. Nat. Mater. 4, 725–726 (2005). - PubMed

Publication types