. 2016 Aug;15(8):2537-53.
doi: 10.1074/mcp.M115.054809. Epub 2016 May 12.

The Clathrin-dependent Spindle Proteome

Affiliations

The Clathrin-dependent Spindle Proteome

Sushma R Rao et al. Mol Cell Proteomics. 2016 Aug.

Abstract

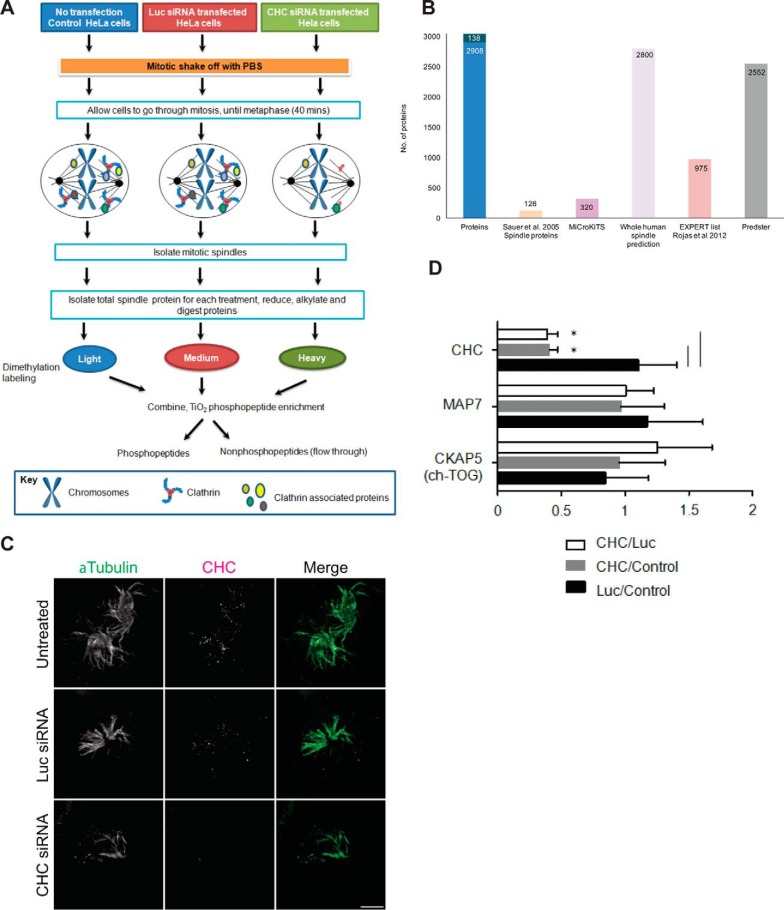
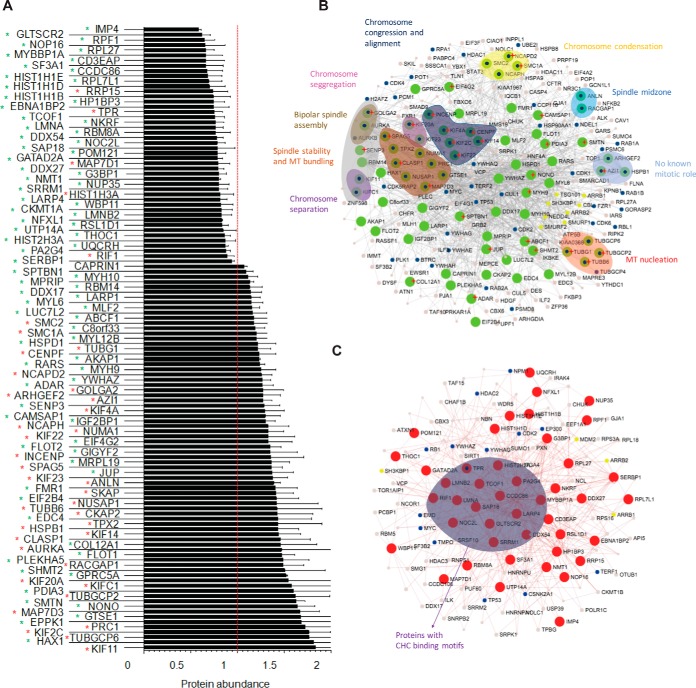
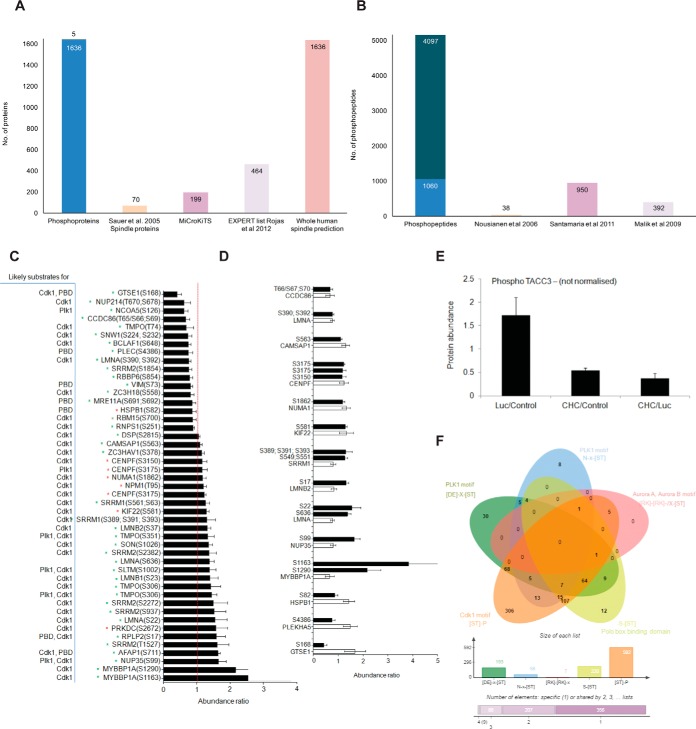
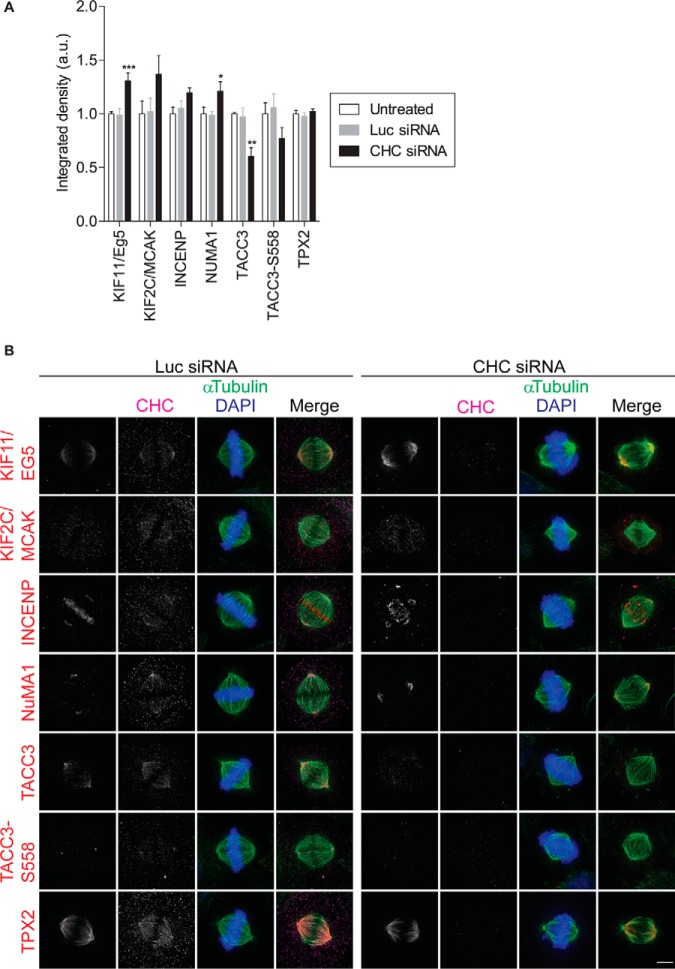
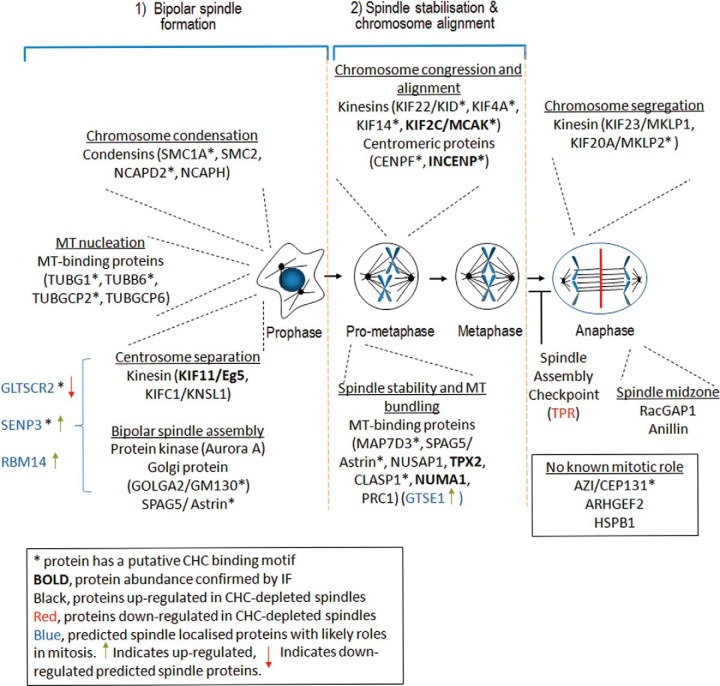
The mitotic spindle is required for chromosome congression and subsequent equal segregation of sister chromatids. These processes involve a complex network of signaling molecules located at the spindle. The endocytic protein, clathrin, has a "moonlighting" role during mitosis, whereby it stabilizes the mitotic spindle. The signaling pathways that clathrin participates in to achieve mitotic spindle stability are unknown. Here, we assessed the mitotic spindle proteome and phosphoproteome in clathrin-depleted cells using quantitative MS/MS (data are available via ProteomeXchange with identifier PXD001603). We report a spindle proteome that consists of 3046 proteins and a spindle phosphoproteome consisting of 5157 phosphosites in 1641 phosphoproteins. Of these, 2908 (95.4%) proteins and 1636 (99.7%) phosphoproteins are known or predicted spindle-associated proteins. Clathrin-depletion from spindles resulted in dysregulation of 121 proteins and perturbed signaling to 47 phosphosites. The majority of these proteins increased in mitotic spindle abundance and six of these were validated by immunofluorescence microscopy. Functional pathway analysis confirmed the reported role of clathrin in mitotic spindle stabilization for chromosome alignment and highlighted possible new mechanisms of clathrin action. The data also revealed a novel second mitotic role for clathrin in bipolar spindle formation.


Conflict of interest statement

The authors declare no conflict of interest.

Figures

Fig. 1.
Fig. 1.
Mitotic spindle proteomics. A, Untransfected HeLa S3 cells and cells transfected with Luc-targeting siRNA or CHC-targeting siRNA were synchronized to pro-metaphase with Nocodazole and collected by mitotic shake-off. The workflow describes isolation of mitotic spindle proteins, tryptic digestion, dimethylation labeling of tryptic peptides, followed by preparation of each sample for analysis of phosphopeptides and nonphosphopeptides on the Orbitrap Velos mass spectrometer. B, Bar graph depicting the number of proteins that overlap between proteins identified in our study (Proteins) and proteins classified as localizing to the spindle by Sauer et al., 2005 (Sauer spindle list) (3), MiCroKiTS, predicted spindle proteins in the whole human proteome (SPIP), the Expert list (37) and the online tool Predster. C, Representative wide-field microscopy images of isolated mitotic spindles. Spindle structures of untreated cells and cells treated with siRNA against Luc or CHC stained for α-Tubulin (green) and CHC (magenta). Scale bar: 5 μm. D, Graph shows the relative change in abundance (mean ± S.E.) of clathrin, the microtubule- associated protein Map7 and ch-TOG by quantitative mass spectrometry. n≥3. *, p < 0.05.
Fig. 2.
Fig. 2.
Depletion of clathrin causes a change in protein abundance of mitotic spindle proteins. A, Bar graph depicting total protein abundance of significantly altered proteins upon CHC knockdown. Data is presented as the ratio of CHC/Luc. Error bars represent S.E. n≥3, p < 0.05 (t test). Red asterisk, known spindle or spindle-associated proteins. Green asterisk, predicted spindle proteins. B, Network of significantly increased proteins upon CHC knock-down. Green nodes represent up-regulated proteins. Blue dots represent proteins involved in the cell cycle, yellow dots represent endocytic proteins. Groups of proteins involved in common mitotic functions are represented in the indicated colored balloon with matching colored text labels. Red start indicates those proteins with a putative clathrin binding motif. C, Network of significantly decreased proteins upon CHC knock-down. Red nodes represent down-regulated proteins. Blue dots represent proteins involved in the cell cycle, yellow dots represent endocytic proteins. Proteins with putative clathrin binding motifs are grouped into the purple balloon.
Fig. 3.
Fig. 3.
Phospho-regulation upon CHC knock-down. A, Bar graph depicting the number of phosphoproteins that overlap between our study (Phosphoproteins) and proteins classified as localizing to the spindle by Sauer et al., 2005 (Sauer spindle list) (3), MiCroKiTS, the Expert list and predicted spindle proteins in the whole human proteome (37). B, Bar graph depicting the number of phosphosites that were identified in our study (Phosphosites) and those that were also identified in studies by (42, 43, 44). C, Bar graph depicting the normalized abundance of significantly altered phosphosites upon CHC knockdown. Data is presented as the ratio of CHC/Luc. Error bars represent S.E. n≥3, p < 0.05 (t test). Red asterisk, known spindle or spindle-associated proteins; Green asterisk, predicted spindle proteins. D, Bar graph depicting the normalized abundance of significantly altered phosphosites (white bars) among significantly altered proteins (black bars) upon CHC knockdown. Data is presented as the ratio of CHC/Luc. Error bars represent S.E. n≥3, p < 0.05 (t test). E, Total phosphoprotein abundance of TACC3 (nonnormalized), as determined by quantitative mass spectrometry. Error bars represent S.E. n≥3. w.r.t value of 1). F, Venn diagram depicting the overlap of consensus motifs for Plk1 (D/E-X-S/T), Aurora A/B kinases (R/K-R/K-X-S/T), Polo box-binding domain (S-S/T) and Cdk1 kinase (S/T-P) within the quantified phosphopeptides (803 normalized phosphopeptides). The size of each list is shown in the bar graph below.
Fig. 4.
Fig. 4.
Validation of protein localization by immunofluorescence. A, Staining quantification of the selected proteins at the mitotic spindle. The graph (mean ± S.E.) shows the relative integrated fluorescence density of the indicated proteins. In total, n≥33 cells assessed per protein from three independent experiments. *, p < 0.05; **, p < 0.005; ***, p < 0.0005 (One-way ANOVA). B, Representative immunofluorescence images showing the localization and abundance of KIF11/Eg5, KIF2C/MCAK, INCENP, NUMA1, TPX2, TACC3 and pTACC3-S558 in CHC siRNA- and control Luc siRNA-treated metaphase cells. Untreated HeLa cells and those treated with siRNA against Luc or CHC were fixed and labeled with the indicated antibodies. Maximum projections of deconvolved z series are shown. Scale bar: 5 μm.
Fig. 5.
Fig. 5.
Processes regulated by clathrin during mitosis. Clathrin has a moonlighting role during mitosis, whereby it stabilizes the mitotic spindle. Depicted is a global overview of the mitotic processes regulated by proteins whose abundance at the mitotic spindle is affected by the depletion of clathrin. The absence of clathrin disrupts bipolar spindle formation, spindle stabilization, chromosome alignment and chromosome segregation. We hypothesize that clathrin may also have a role in regulating the abundance of spindle proteins by transporting them as cargo between the spindle and cytoplasm.

References

    1. Musacchio A., and Salmon E. D. (2007) The spindle-assembly checkpoint in space and time. Nat. Rev. Mol. Cell Biol. 8, 379–393 - PubMed
    1. Huang Z., Ma L., Wang Y., Pan Z., Ren J., Liu Z., and Xue Y. (2015) MiCroKiTS 4.0: a database of midbody, centrosome, kinetochore, telomere and spindle. Nucleic Acids Res. 43, D328–D334 - PMC - PubMed
    1. Sauer G., Korner R., Hanisch A., Ries A., Nigg E. A., and Sillje H. H. (2005) Proteome analysis of the human mitotic spindle. Mol. Cell. Proteomics 4, 35–43 - PubMed
    1. Compton D. A. (2000) Spindle assembly in animal cells. Annu. Rev. Biochem. 69, 95–114 - PubMed
    1. Sharp D. J., Rogers G. C., and Scholey J. M. (2000) Microtubule motors in mitosis. Nature 407, 41–47 - PubMed

Publication types