

Declining blood collection and utilization in the United States
- PMID: 27174734
- PMCID: PMC5928513
- DOI: 10.1111/trf.13644
Declining blood collection and utilization in the United States
Abstract
Background: The Department of Health and Human Services National Blood Collection and Utilization Survey (NBCUS) has been conducted biennially since 1997. Data are used to estimate national blood collection and utilization.
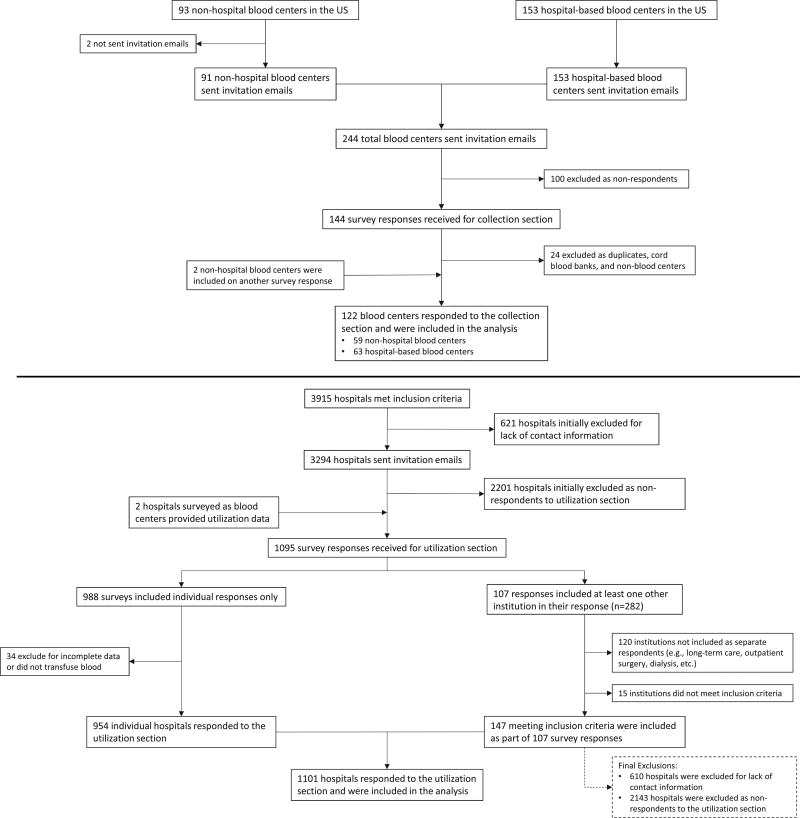
Study design and methods: The 2013 Department of Health and Human Services NBCUS is a cross-sectional survey of all US blood collection centers and hospitals as listed in the 2012 American Hospital Association Annual Survey database that perform at least 100 inpatient surgical procedures annually. The study objective was to estimate, with 95% confidence intervals (CIs), the number of blood and blood components collected and transfused in the United States.
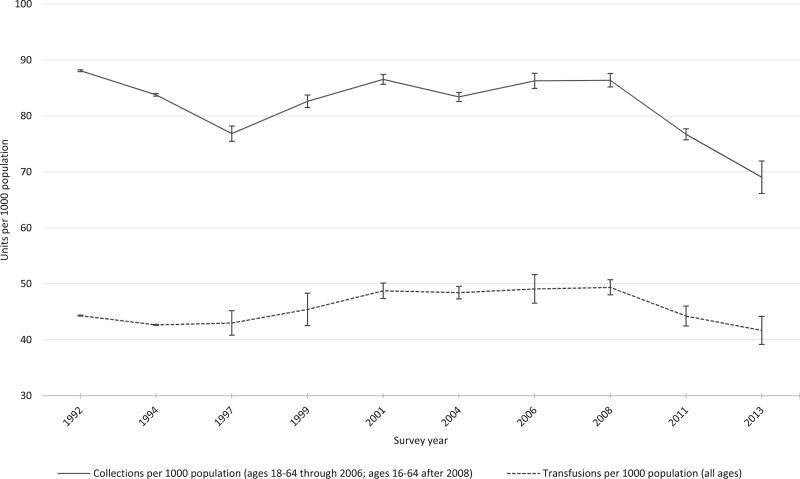
Results: In 2013, a total of 14,237,000 whole blood and apheresis red blood cell (RBC) units (95% CI, 13,639,000-14,835,000) were collected with 13,395,000 available for transfusion. Of these, 13,180,000 (95% CI, 12,389,000-13,972,000) whole blood and RBC units were transfused. This represented a 4.4% decline in the number of transfused units compared to 2011. Outdated (i.e., expired without being transfused) whole blood and RBC units declined by 17.3%. Apheresis (2,318,000; 95% CI, 2,154,000-2,482,000) and whole blood-derived platelet (PLT; 130,000; 95% CI, 23,000-237,000) distribution declined in 2013. Total PLT transfusions increased in 2013 (2,281,000) in comparison to 2011 (2,169,000). Total plasma units distributed (4,338,000) and transfused (3,624,000) declined.
Conclusion: Both blood collection and utilization have declined, but the gap between collection and utilization is narrowing. As collections decline further and hospitals decrease transfusions and manage products more efficiently, the decline in surplus inventory may be a concern for disaster preparedness or other unexpected utilization needs.
© 2016 AABB.
Conflict of interest statement
The authors have disclosed no conflicts of interest.
Figures
References
-
- Bennett-Guerrero E, Zhao Y, O’Brien SM, et al. Variation in use of blood transfusion in coronary artery bypass graft surgery. JAMA. 2010;304:1568–75. - PubMed
-
- Bloch EM, Cohn C, Bruhn R, et al. A cross-sectional pilot study of blood utilization in 27 hospitals in Northern California. Am J Clin Pathol. 2014;142:498–505. - PubMed
-
- Goodnough LT, Shander A. Patient blood management. Anesthesiology. 2012;116:1367–76. - PubMed
MeSH terms
Grants and funding
LinkOut - more resources
Full Text Sources
Other Literature Sources
Medical
Research Materials
Miscellaneous
