. 2016 May 13;352(6287):844-9.
doi: 10.1126/science.aac7272.

Histone H3K36 mutations promote sarcomagenesis through altered histone methylation landscape

Affiliations

Histone H3K36 mutations promote sarcomagenesis through altered histone methylation landscape

Chao Lu et al. Science. .

Abstract

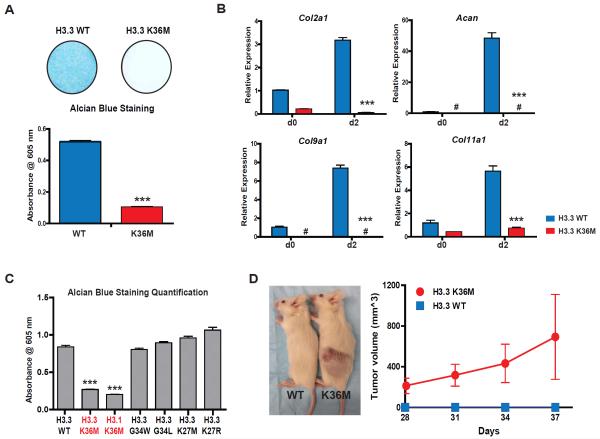
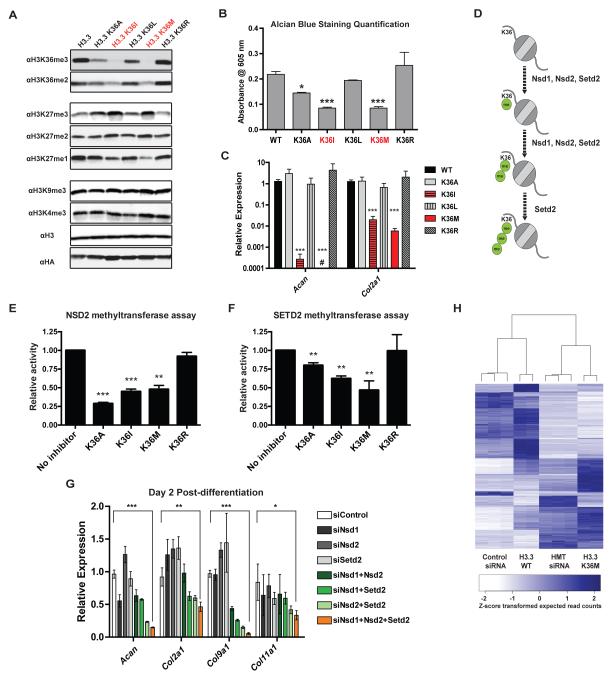
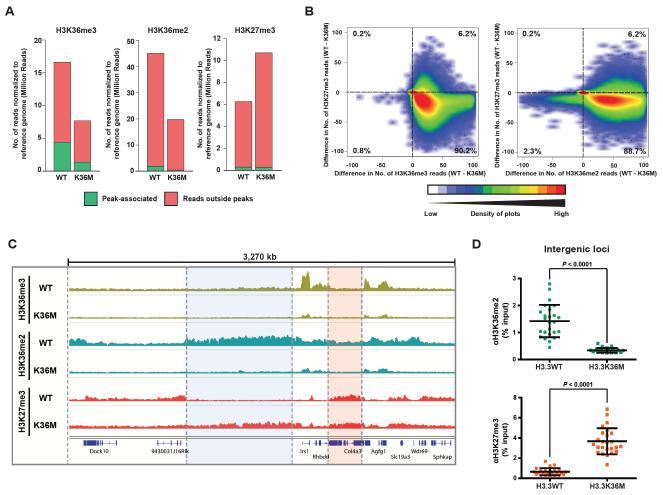
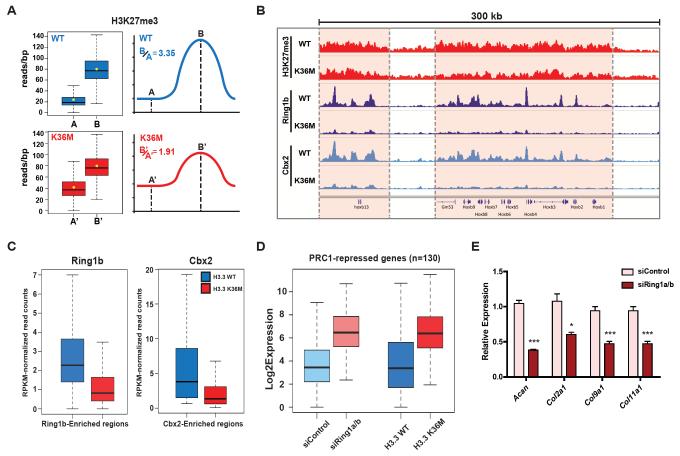
Several types of pediatric cancers reportedly contain high-frequency missense mutations in histone H3, yet the underlying oncogenic mechanism remains poorly characterized. Here we report that the H3 lysine 36-to-methionine (H3K36M) mutation impairs the differentiation of mesenchymal progenitor cells and generates undifferentiated sarcoma in vivo. H3K36M mutant nucleosomes inhibit the enzymatic activities of several H3K36 methyltransferases. Depleting H3K36 methyltransferases, or expressing an H3K36I mutant that similarly inhibits H3K36 methylation, is sufficient to phenocopy the H3K36M mutation. After the loss of H3K36 methylation, a genome-wide gain in H3K27 methylation leads to a redistribution of polycomb repressive complex 1 and de-repression of its target genes known to block mesenchymal differentiation. Our findings are mirrored in human undifferentiated sarcomas in which novel K36M/I mutations in H3.1 are identified.


Figures

Fig. 1
Fig. 1. H3K36M mutation impairs mesenchymal differentiation and generates undifferentiated sarcoma
(A) Representative Alcian blue staining images of cell culture wells after 9 days of chondrocyte differentiation. The bar graph shows the quantification of staining in cell extract. (B) The mRNA expression of Acan, Col2a1, Col9a1 and Col11a1 in cells before (d0) and two days after (d2) chondrocyte differentiation induction. (C) Quantification of Alcian blue staining in cell extract after 9 days of chondrocyte differentiation. (D) Measurement of subcutaneous tumor growth of H3.3WT or H3.3K36M cells. A representative image of mice implanted with cells at the time of sacrifice is shown. In (D), error bars indicate standard deviation (n=10 mice in each group). In other experiments, error bars indicate standard deviation from three biological replicates. #, undetectable; ***, p<0.001.
Fig. 2
Fig. 2. H3K36 mutations dominantly inhibit H3K36 methyltransferases
(A) Immunoblots of lysates generated from 293T cells expressing FLAG and HA-tagged wild-type (WT) or K36A/I/L/M/R mutant H3.3. (B) Quantification of Alcian blue staining in cell extract after 9 days of chondrocyte differentiation. (C) The mRNA expression of Acan and Col2a1 in cells after two days of chondrocyte differentiation. (D) Schematic introduction of mammalian H3K36 methyltransferases. (E) and (F) In vitro methyltransferase assays with recombinant human full-length NSD2 (E) or SET domain of SETD2 (F), recombinant substrate nucleosomes and tritiated SAM. Various K36 mutant H3(27-47) peptides were added to the reaction mixture. For NSD2 assays, the final concentration of inhibitor peptides was 30 μM, for SETD2 assays 50 μM. Methyltransferase activity was quantified via scintillation and normalized. (G) MPCs were transfected with siRNA for 3 days, followed by chondrocyte differentiation induction for 2 days. The mRNA expression of Acan, Col2a1, Col9a1 and Col11a1 was measured. (H) Heatmap showing the expression pattern of greater than 4-fold differentially expressed genes between cells treated with siRNAs against Nsd1/2 and Setd2 (HMT siRNA) or control siRNA. For all experiments, error bars indicate standard deviation from three biological replicates. #, undetectable; *, p<0.05; **, p<0.01; ***, p<0.001.
Fig. 3
Fig. 3. Genome-wide profiling of H3K36me2/3 and H3K27me3 in H3.3WT and H3.3K36M cells
(A) After normalization, the number of H3K36me2/3 and H3K27me3 reads that are peak-associated or outside peaks are shown. (B) Scatter plot showing the correlation between genome-wide changes in H3K27me3 and H3K36me2/3. The genome was divided into 10,000 bp bins, and the difference in number of normalized ChIP-seq reads of H3K36me2/3 or H3K27me3 between H3.3WT and H3.3K36M cells was plotted. The percentage of bins found in each quadrant is shown. (C) Genome viewer representations of normalized ChIP-seq reads for H3K36me2/3 and H3K27me3 at a 3,270 kb region. Refseq genes are annotated at the bottom. (D) The enrichment (% input) of H3K36me2 and H3K27me3 at various intergenic regions was measured with ChIP-qPCR. Each data point represents a genomic locus.
Fig. 4
Fig. 4. Intergenic gain of H3K27me3 leads to redistribution of PRC1 and aberrant gene activation
(A) Box plots (left) and schematics (right) displaying the ratio of average H3K27me3 reads per base-pair between gene-associated peaks (B or B') and intergenic regions (A or A'). (B) Genome viewer representations of normalized ChIP-seq reads for H3K27me3, Ring1b and Cbx2 at Hoxb gene cluster. Refseq genes are annotated at the bottom. (C) Box plots of normalized Ring1b and Cbx2 ChIP-seq peak reads. P-value <2.2 × 10⁻¹⁶ determined by Wilcoxon’s rank sum test. (D) Box plots of expression levels of PRC1-repressed genes are shown for control or Ring1a/b siRNA knockdown cells and for H3.3WT and H3.3K36M cells. P-value < 2.2 × 10⁻¹⁶ determined by Wilcoxon’s rank sum test. (E) MPCs were transfected with siRNA for 3 days, followed by chondrocyte differentiation induction for 2 days. The mRNA expression of Acan, Col2a1, Col9a1 and Col11a1 was measured. Error bars indicate standard deviation from three biological replicates. *, p<0.05; ***, p<0.001.

References

    1. Schwartzentruber J, et al. Driver mutations in histone H3.3 and chromatin remodelling genes in paediatric glioblastoma. Nature. 2012;482:226–231. - PubMed
    1. Wu G, et al. Somatic histone H3 alterations in pediatric diffuse intrinsic pontine gliomas and non-brainstem glioblastomas. Nat. Genet. 2012;44:251–253. - PMC - PubMed
    1. Behjati S, et al. Distinct H3F3A and H3F3B driver mutations define chondroblastoma and giant cell tumor of bone. Nat. Genet. 2013;45:1479–1482. - PMC - PubMed
    1. Bjerke L, et al. Histone H3.3 Mutations Drive Pediatric Glioblastoma through Upregulation of MYCN. Cancer Discov. 2013;3:512–519. - PMC - PubMed
    1. Chan K-M, et al. The histone H3.3K27M mutation in pediatric glioma reprograms H3K27 methylation and gene expression. Genes Dev. 2013;27:985–990. - PMC - PubMed

Publication types

MeSH terms