. 2016 Jul 7;6(7):2103-11.
doi: 10.1534/g3.116.030452.

Improved Placement of Multi-mapping Small RNAs

Affiliations

Improved Placement of Multi-mapping Small RNAs

Nathan R Johnson et al. G3 (Bethesda). .

Abstract

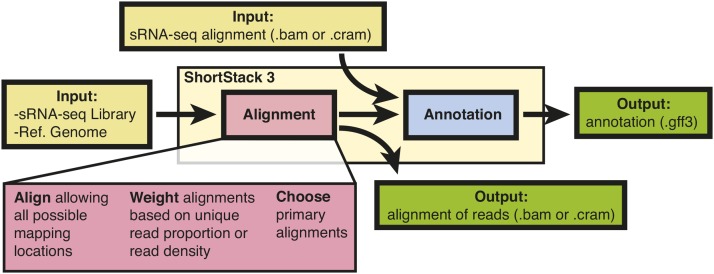
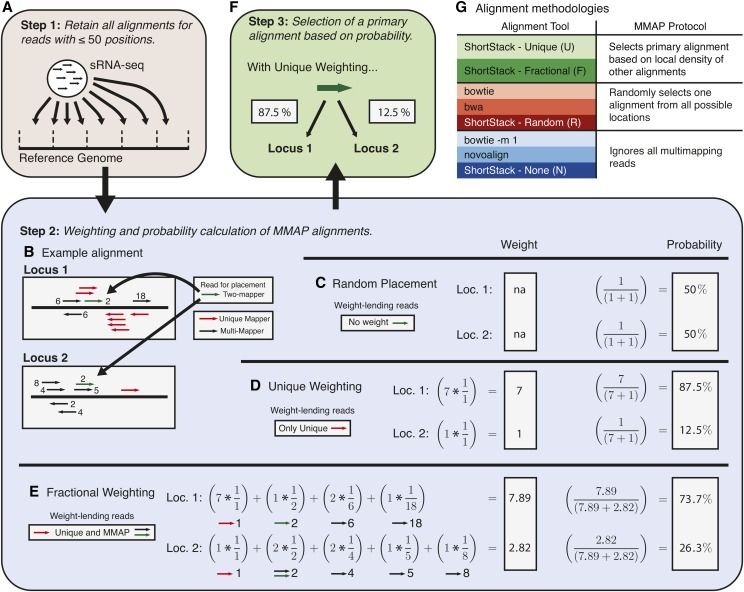
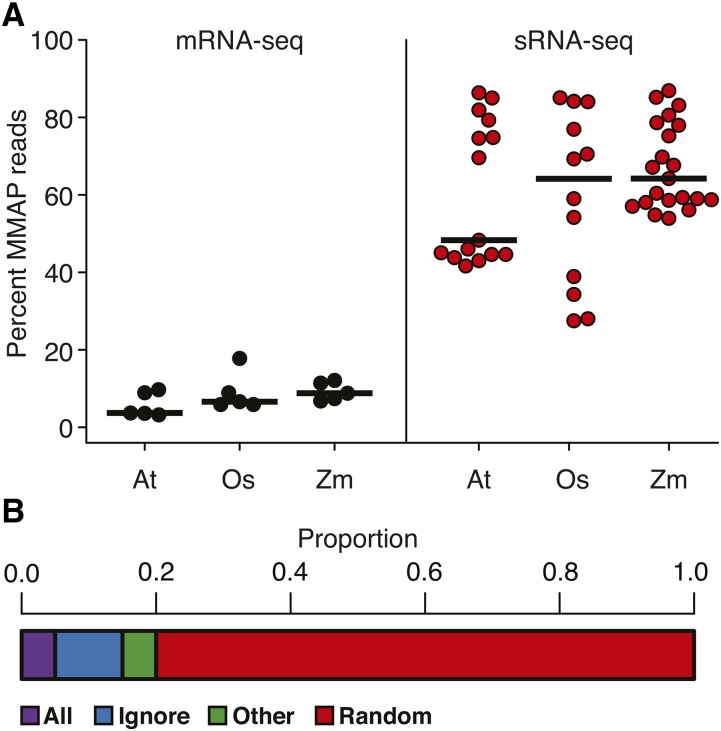
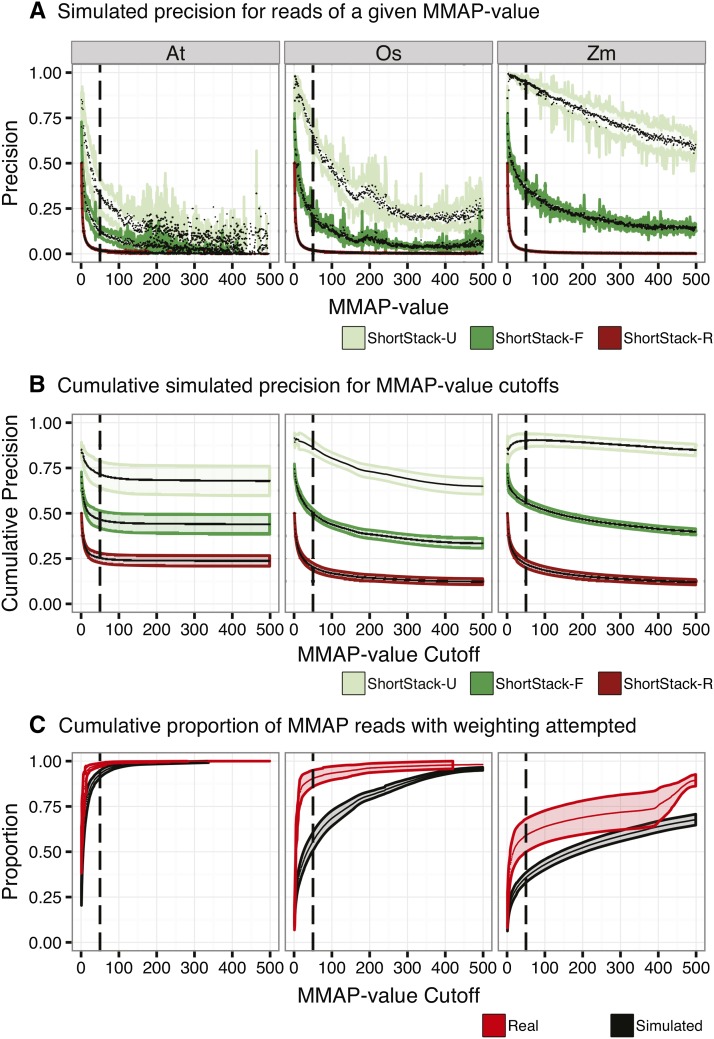
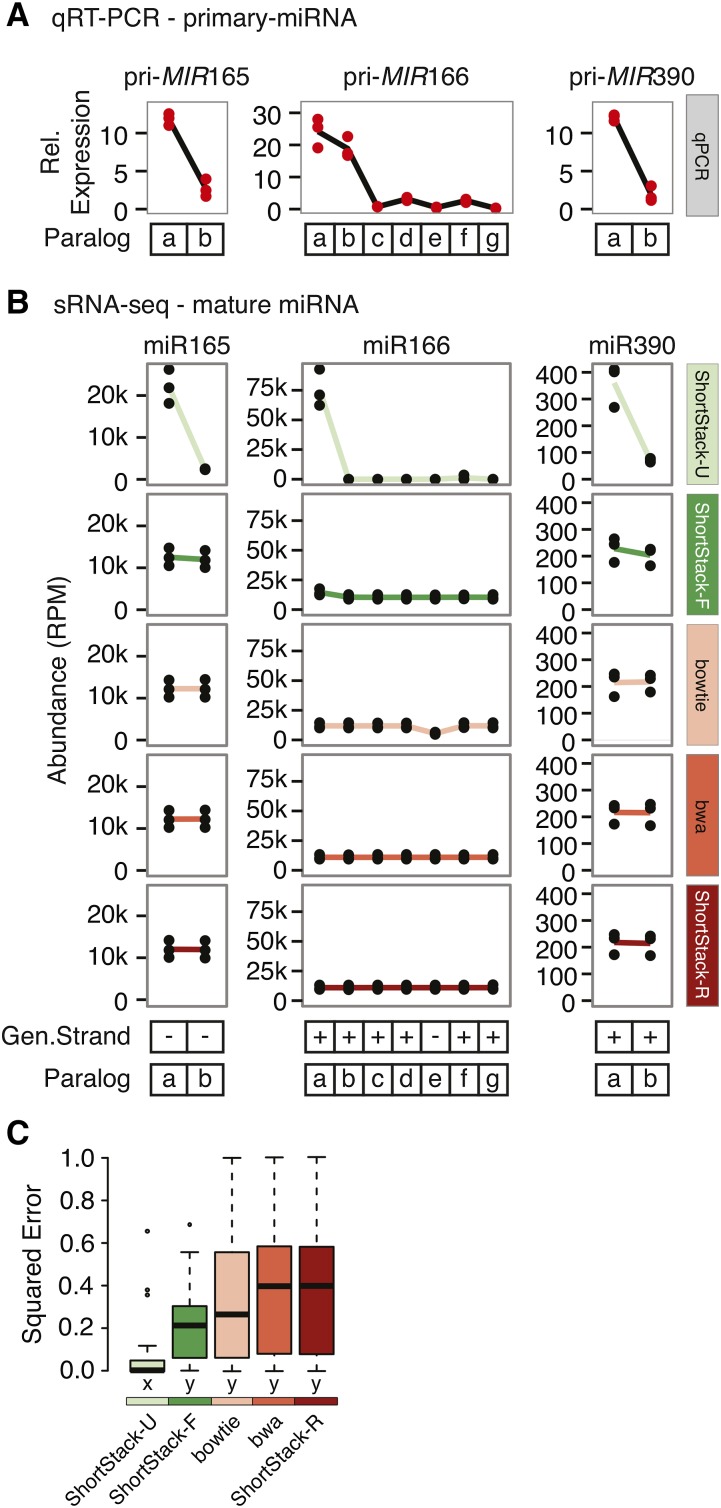
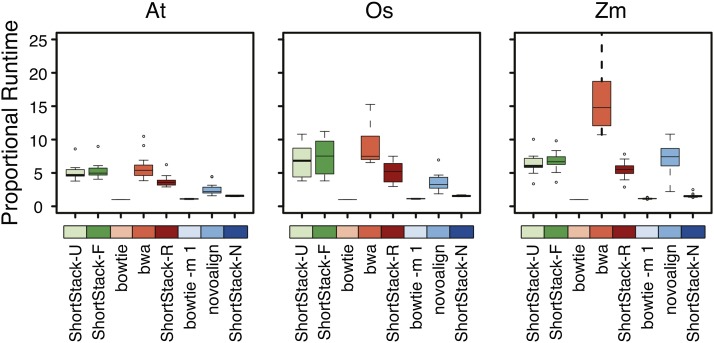
High-throughput sequencing of small RNAs (sRNA-seq) is a popular method used to discover and annotate microRNAs (miRNAs), endogenous short interfering RNAs (siRNAs), and Piwi-associated RNAs (piRNAs). One of the key steps in sRNA-seq data analysis is alignment to a reference genome. sRNA-seq libraries often have a high proportion of reads that align to multiple genomic locations, which makes determining their true origins difficult. Commonly used sRNA-seq alignment methods result in either very low precision (choosing an alignment at random), or sensitivity (ignoring multi-mapping reads). Here, we describe and test an sRNA-seq alignment strategy that uses local genomic context to guide decisions on proper placements of multi-mapped sRNA-seq reads. Tests using simulated sRNA-seq data demonstrated that this local-weighting method outperforms other alignment strategies using three different plant genomes. Experimental analyses with real sRNA-seq data also indicate superior performance of local-weighting methods for both plant miRNAs and heterochromatic siRNAs. The local-weighting methods we have developed are implemented as part of the sRNA-seq analysis program ShortStack, which is freely available under a general public license. Improved genome alignments of sRNA-seq data should increase the quality of downstream analyses and genome annotation efforts.

Keywords: alignment; annotation; bioinformatics; miRNA; sRNA-seq; siRNA.


Figures

Figure 1
Figure 1
Overview of ShortStack methodology.
Figure 2
Figure 2
ShortStack3 alignment methodology. (A) First step in alignment by ShortStack: initial alignment of sRNA-seq reads to a reference genome. (B) Example of local alignments for a read (green) with an MMAP-value of two. Numbers adjacent to reads indicate their MMAP-value. (C) Weighting scheme for random placement of MMAP reads. (D) Weighting scheme for ShortStack’s Unique (U) method. (E) Weighting scheme for ShortStack’s fractional (F) method. (F) Final step: choosing a single primary alignment based on calculated probabilities. (G) Alignment tools grouped by MMAP methods.
Figure 3
Figure 3
Prevalence of MMAP reads and methods. (A) MMAP rates for reads from mRNA-seq and sRNA-seq data from A. thaliana (At), O. sativa (Os), and Z. mays (Zm). Horizontal bars mark median values, circles mark values for individual libraries. (B) Proportion of MMAP-selection methods for sRNA alignment in recent literature (n = 20; Table S4).
Figure 4
Figure 4
Performance analysis of sRNA-seq alignment methods. (A) Precisions, sensitivities, and F1 scores for alignments of simulated sRNA-seq data with the indicated methods for entire datasets. Boxplots show medians (central bars), the 1st to 3rd quartile range (boxes), other data out to 1.5 the interquartile range (whiskers), and outliers (dots); n = 15, 12, and 21 for the At, Os, and Zm data, respectively. Treatments sharing a common letter indicate groups that are not significantly different by nonparametric analysis (Kruskal-Wallis ANOVA with Dunn multiple comparison test, α = 0.05). (B) MMAP reads only. Same analysis and conventions as in (A). (C) False negative rates for alignments of real sRNA-seq data with the indicated methods for MMAP reads. Plotting conventions as in (A). At, A. thaliana; Os, O. sativa; Zm, Z. mays.
Figure 5
Figure 5
Influence of MMAP-value on performance. (A) Precision as a function of MMAP-value for simulated sRNA-seq data from the indicated species and alignment method. MMAP-value is the number of possible alignment positions for a read. Colored lines are standard deviations, black dots are mean values. Heavy dashed line at MMAP = 50 indicates the default cutoff value for ShortStack, above which placement of MMAP reads is not attempted. (B) Cumulative precision as a function of MMAP-value for simulated sRNA-seq data from the indicated species and alignment method. Plotting conventions as in (A). (C) Cumulative proportion of real and simulated sRNA-seq data retained by ShortStack alignments under differing MMAP-value cutoffs. Note that simulated libraries have higher proportions of reads with high MMAP values. Plotting conventions as in (A). At, A. thaliana; Os. O. sativa; Zm, Z. mays.
Figure 6
Figure 6
Experimental assessment of sRNA-seq alignment methods using miRNA paralogs. (A) Relative expression of the indicated primary MIRNA transcripts in A. thaliana Col-0 inflorescences assessed via qRT-PCR. Values are normalized to 1 / 1000 those of ACTIN2. Dots show values from biological replicates (n = 3). (B) Accumulation of the indicated mature miRNAs from each of their possible paralogs as determined by different sRNA-seq alignment methods. Values are from three biological replicate sRNA-seq libraries from A. thaliana Col-0 inflorescences. (C) Squared residual errors from comparisons of scaled qRT-PCR data to scaled sRNA-seq alignment results. Boxplots show medians (horizontal bars), the 1st to 3rd quartile range (boxes), data out to 1.5 times the interquartile range (whiskers), and outliers (dots). Treatments sharing a common letter indicate groups that are not significantly different by nonparametric analysis (Kruskal-Wallis ANOVA with Dunn multiple comparison test, α = 0.05).
Figure 7
Figure 7
Precisions from alignments of Arabidopsis thaliana MMAP 24 nt siRNAs whose true origins are known based on a unique precursor alignment. Dots, data from individual libraries; horizontal bars, medians. Treatments sharing a common letter indicate groups that are not significantly different by nonparametric analysis (Kruskal-Wallis ANOVA with Dunn multiple comparison test, α = 0.05).
Figure 8
Figure 8
Strand-biased selection of MMAP alignment positions by bowtie. Bias is shown as the overall ratio of top-strand aligned reads to bottom, based on simulated libraries from A. thaliana (n = 15). Boxplots show medians (horizontal bars), the 1st to 3rd quartile range (boxes), data out to 1.5 times the interquartile range (whiskers), and outliers (dots). Treatments sharing a common letter indicate groups that are not significantly different by nonparametric analysis (Kruskal-Wallis ANOVA with Dunn multiple comparison test, α = 0.05).
Figure 9
Figure 9
Comparison of alignment times for real sRNA-seq libraries with the indicated methods. Boxplots show medians (central bars), the 1st to 3rd quartile range (boxes), other data out to 1.5 the interquartile range (whiskers), and outliers (dots); n = 15, 12, and 21 for the At, Os, and Zm data, respectively. At, A. thaliana; Os, O. sativa; Zm, Z. mays.

References

    1. Allen E., Xie Z., Gustafson A. M., Carrington J. C., 2005. microRNA-directed phasing during trans-acting siRNA biogenesis in plants. Cell 121: 207–221. - PubMed
    1. Aravin A., Gaidatzis D., Pfeffer S., Lagos-Quintana M., Landgraf P., et al. , 2006. A novel class of small RNAs bind to MILI protein in mouse testes. Nature 442: 203–207. - PubMed
    1. Axtell M. J., 2013. ShortStack: comprehensive annotation and quantification of small RNA genes. RNA 19: 740–751. - PMC - PubMed
    1. Blevins T., Podicheti R., Mishra V., Marasco M., Tang H., et al. , 2015. Identification of Pol IV and RDR2-dependent precursors of 24 nt siRNAs guiding de novo DNA methylation in Arabidopsis. eLife 4: e09591. - PMC - PubMed
    1. Čikoš Š., Bukovská A., Koppel J., 2007. Relative quantification of mRNA: comparison of methods currently used for real-time PCR data analysis. BMC Mol. Biol. 8: 1–14. - PMC - PubMed

Publication types