. 2016 Apr 27:9:2519-33.
doi: 10.2147/OTT.S101671. eCollection 2016.

Midazolam regulated caspase pathway, endoplasmic reticulum stress, autophagy, and cell cycle to induce apoptosis in MA-10 mouse Leydig tumor cells

Affiliations

Midazolam regulated caspase pathway, endoplasmic reticulum stress, autophagy, and cell cycle to induce apoptosis in MA-10 mouse Leydig tumor cells

Edmund Cheung So et al. Onco Targets Ther. .

Abstract

Purpose: Midazolam is widely used as a sedative and anesthetic induction agent by modulating the different GABA receptors in the central nervous system. Studies have also shown that midazolam has an anticancer effect on various tumors. In a previous study, we found that midazolam could induce MA-10 mouse Leydig tumor cell apoptosis by activating caspase cascade. However, the detailed mechanism related to the upstream and downstream pathways of the caspase cascade, such as endoplasmic reticulum (ER) stress, autophagy, and p53 pathways plus cell cycle regulation in MA-10 mouse Leydig tumor cells, remains elusive.

Methods: Flow cytometry assay and Western blot analyses were exploited.

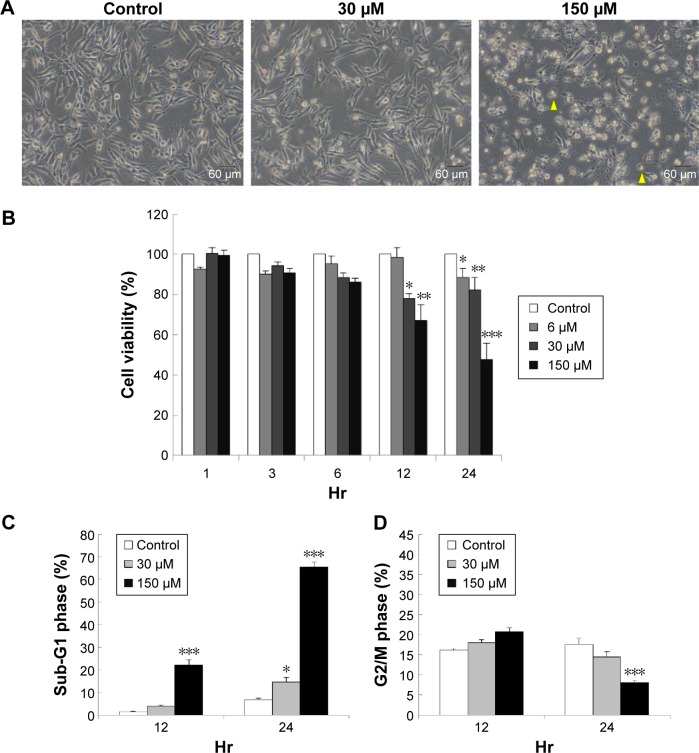
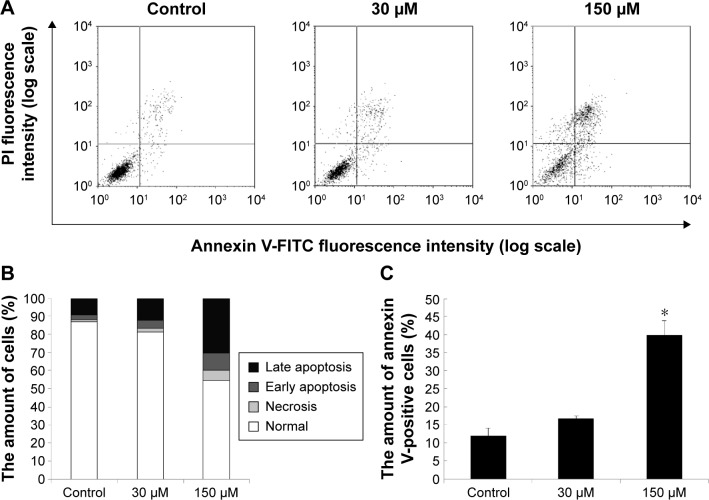
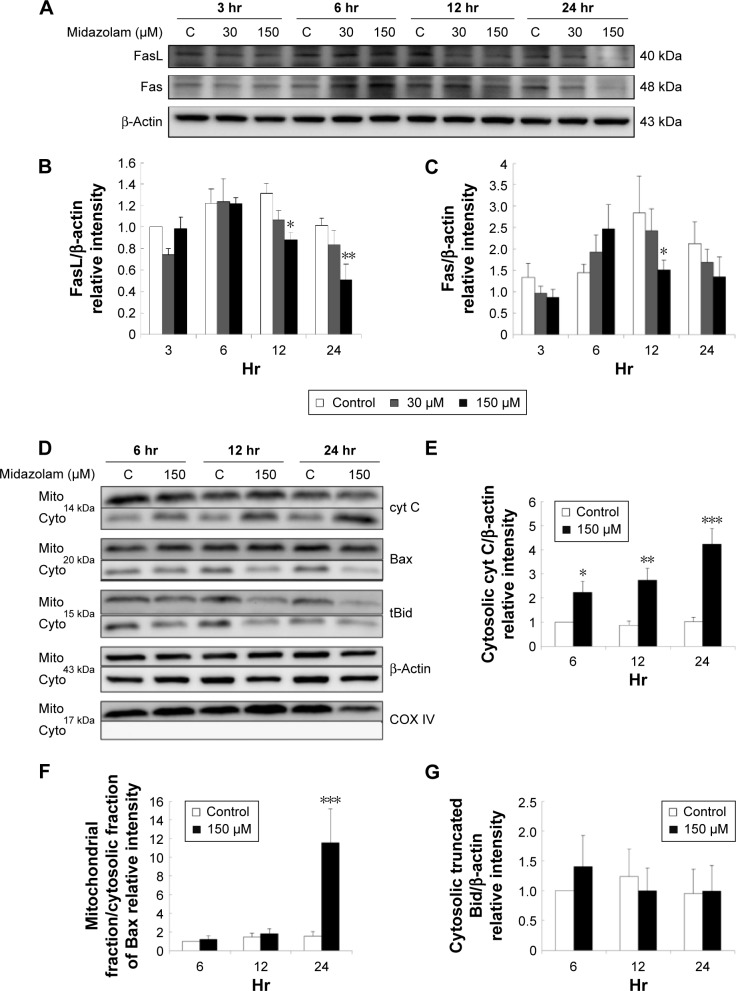
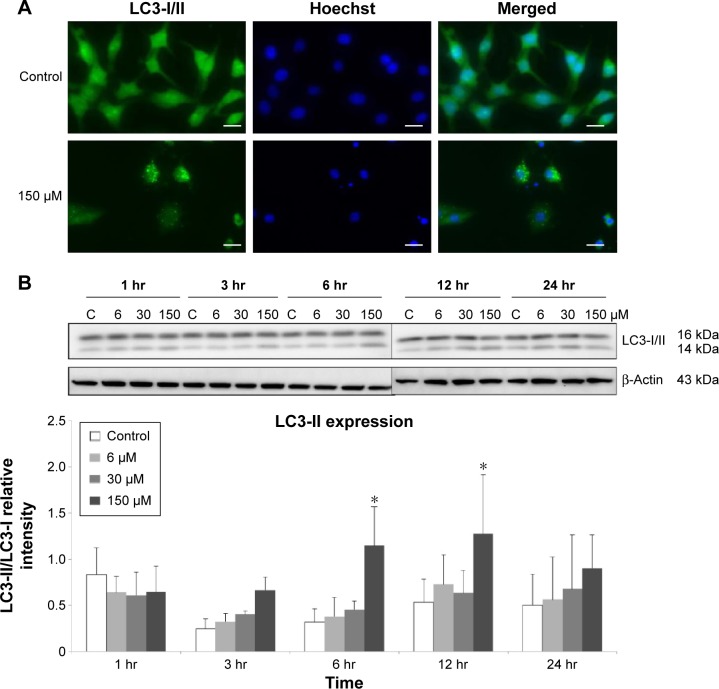
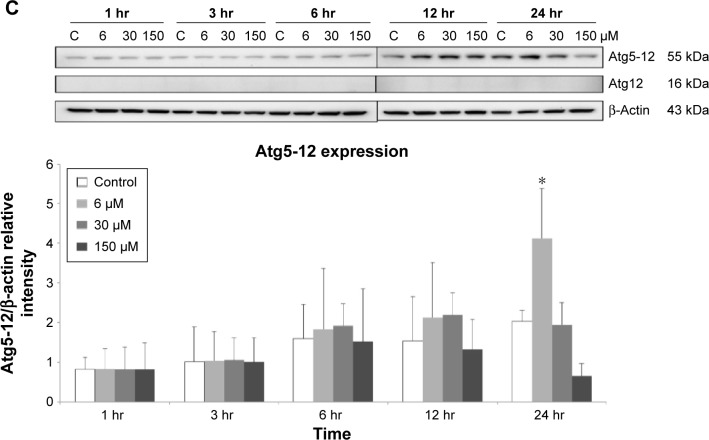
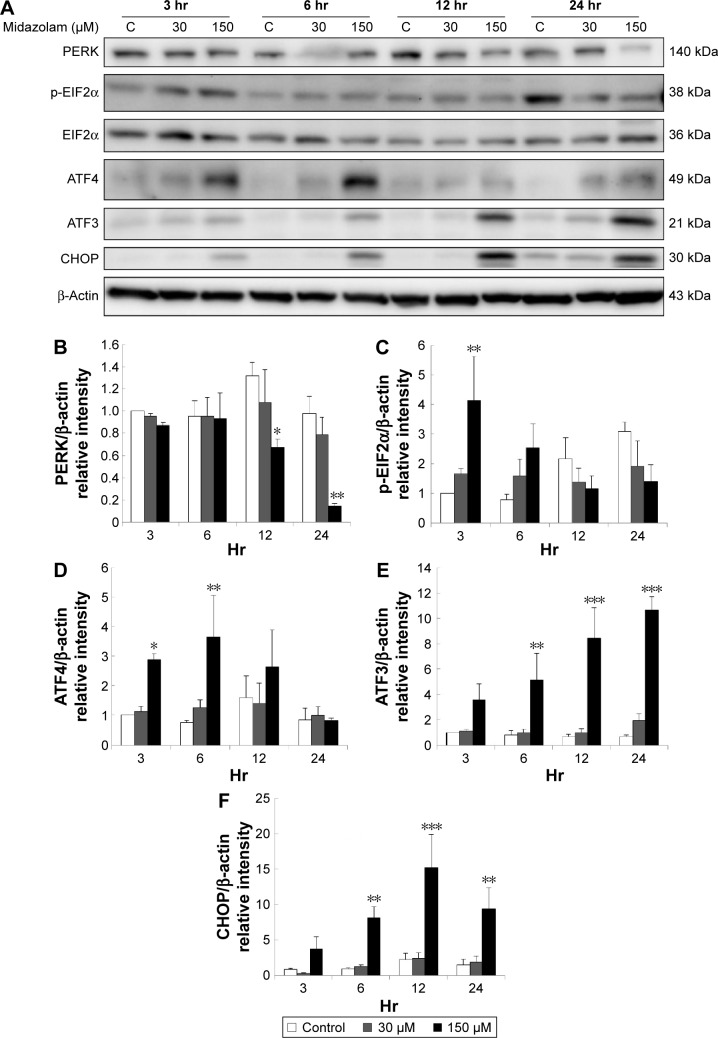
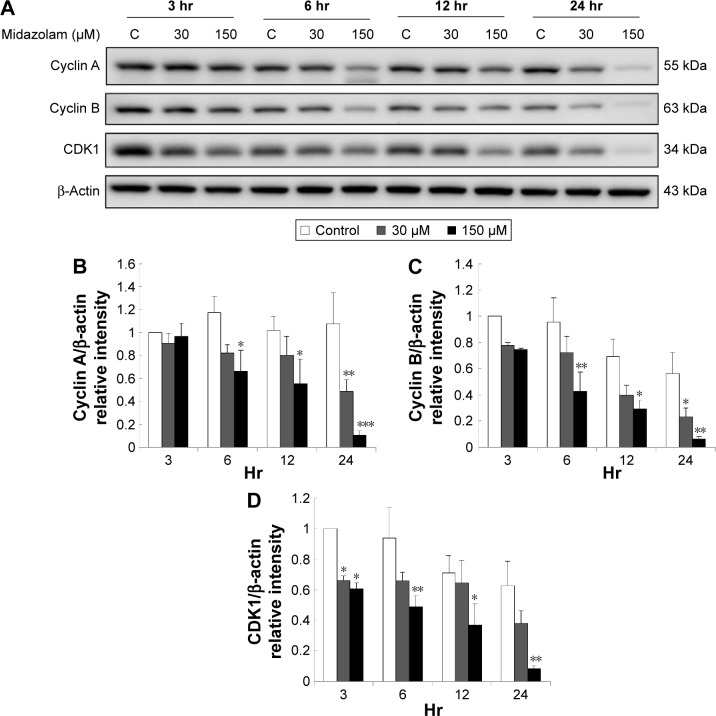
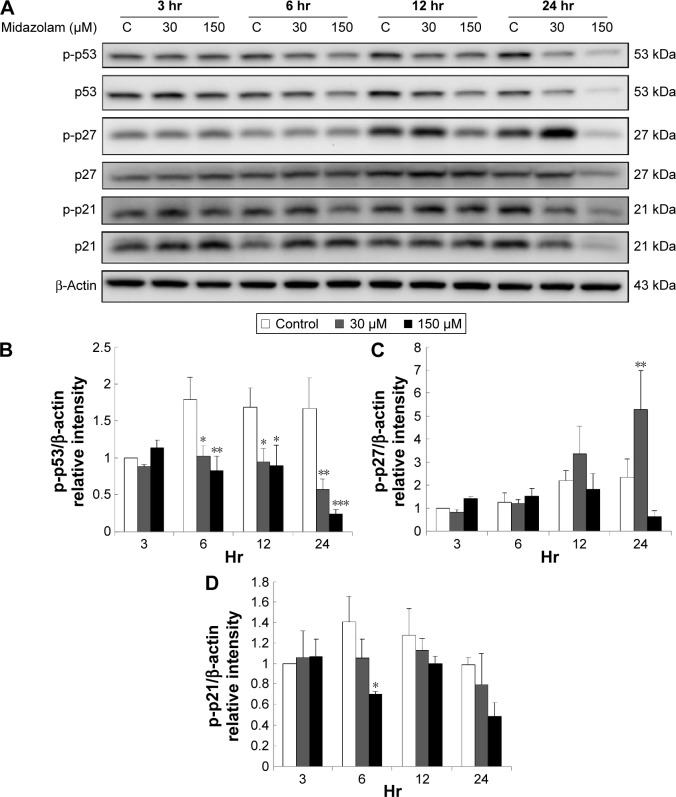
Results: Midazolam significantly decreased cell viability but increased sub-G1 phase cell numbers in MA-10 cells (P<0.05). Annexin V/propidium iodide double staining further confirmed that midazolam induced apoptosis. In addition, expressions of Fas and Fas ligand could be detected in MA-10 cells with midazolam treatments, and Bax translocation and cytochrome c release were also involved in midazolam-induced MA-10 cell apoptosis. Moreover, the staining and expression of LC3-II proteins could be observed with midazolam treatment, implying midazolam could induce autophagy to control MA-10 cell apoptosis. Furthermore, the expressions of p-EIF2α, ATF4, ATF3, and CHOP could be induced by midazolam, indicating that midazolam could stimulate apoptosis through ER stress in MA-10 cells. Additionally, the expressions of cyclin A, cyclin B, and CDK1 could be inhibited by midazolam, and the phosphorylation of p53, P27, and P21 could be adjusted by midazolam, suggesting that midazolam could manage cell cycle through the regulation of p53 pathway to induce apoptosis in MA-10 cells.

Conclusion: Midazolam could induce cell apoptosis through the activation of ER stress and the regulation of cell cycle through p53 pathway with the involvement of autophagy in MA-10 mouse Leydig tumor cells.

Keywords: ER stress; MA-10 cells; apoptosis; autophagy; caspase; cell cycle; midazolam; tumor.


Figures

Figure 1
Figure 1
Effects of midazolam on morphological changes, cell viability, and cell cycle related to cell death in MA-10 cells. Notes: A one-way analysis of variance and least significant difference comparison were performed. MA-10 cells were treated with midazolam (0, 30, and 150 μM) for 24 hours (hr) and observed under light microscopy (A). MA-10 cells were treated with midazolam (0, 6, 30, and150 μM) for 1, 3, 6, 12, and 24 hours, respectively, and viability was examined by MTT assay. Results were presented as percentages of cell growth relative to control groups (B). MA-10 cells were treated with midazolam (0, 30, and 150 μM) for 12 and 24 hours, and sub-G1 (C) and G2/M (D) phase cell numbers were detected. Cells were fixed and then stained with propidium iodide and analyzed by cell cycle analysis. *, **, and *** indicate statistical difference compared to control interrelated to P<0.05, P<0.01, and P<0.005, respectively. Yellow arrowheads indicate the membrane blebbing. The data are expressed as mean ± standard error.
Figure 2
Figure 2
Midazolam-induced cell apoptosis in MA-10 cells. Notes: A one-way analysis of variance and least significant difference comparison were performed. MA-10 cells were treated with midazolam (0, 30, and 150 μM) for 24 hours. The apoptotic status of midazolam-treated cells was detected by annexin V/propidium iodide (PI) double staining assay (A). The percentages of double-negative cells: viable cells; annexin V single-positive cells: early apoptotic cells; PI single positive cells: necrotic cells; and annexin V and PI double-positive cells: late apoptotic cells in each treatment were illustrated (B). The difference of annexin V-positive cells (early apoptotic plus late apoptotic status) was analyzed among treatments (C). *Indicates statistical difference compared to control (P<0.05). The data are expressed as mean ± standard error. Abbreviation: FITC, fluorescein isothiocyanate.
Figure 3
Figure 3
Effects of midazolam on the expressions of receptor and mitochondrial pathways in MA-10 cells. Notes: A one-way analysis of variance and least significant difference comparison were performed. MA-10 cells were treated with midazolam (0, 30, and 150 μM) for 3, 6, 12, and 24 hours (hr). FasL (40 kDa) and Fas (48 kDa) were detected by Western blot (A). The integrated optical densities of FasL (B) and Fas (C) proteins were normalized with β-actin (43 kDa) in each lane. MA-10 cells were treated with 0 or 150 μM midazolam for 6, 12, and 24 hours. Cytochrome c (cyt C) (14 kDa), Bax (20 kDa), Bid (22 kDa), and tBid (15 kDa) were detected in mitochondrial (mito) and cytosolic (cyto) fractions by Western blot (D), respectively. β-Actin (43 kDa) and COX IV (17 kDa) were used as loading controls (C) for cytosolic and mitochondrial fractions, respectively. The integrated optical densities of cytochrome c (E), Bax (F), and tBid (G) proteins were normalized with loading controls in each lane. *, **, and *** indicate statistical difference compared to control interrelated to P<0.05, P<0.01, and P<0.005, respectively. The data are expressed as mean ± standard error.
Figure 4
Figure 4
Midazolam increases autophagosome formation in MA-10 cells. Notes: A one-way analysis of variance and least significant difference comparison were performed. MA-10 cells were treated with 0 and 150 μM midazolam for 24 hours (hr), and cells were then fixed and co-stained for immunostaining (LC3 marker, green) and Hoechst (nucleus marker, blue) scale bar: 20 μM (A). MA-10 cells were treated with midazolam (0, 6, 30, and 150 μM) for 1, 3, 6, 12, and 24 hours, respectively, and LC3-II (14 kDa) protein was detected by Western blot. Integrated optical densities of LC3-II proteins were analyzed after normalization with LC3-I (16 kDa) in each lane (B). Atg5–12 (55 kDa) protein was detected by Western blot and proteins were analyzed after normalization with β-actin (43 kDa) in each lane (C). Data in (B) and (C) represent the mean ± standard error of the mean of three separate experiments. *Indicates statistical difference compared to control (C) interrelated to P<0.05.
Figure 4
Figure 4
Midazolam increases autophagosome formation in MA-10 cells. Notes: A one-way analysis of variance and least significant difference comparison were performed. MA-10 cells were treated with 0 and 150 μM midazolam for 24 hours (hr), and cells were then fixed and co-stained for immunostaining (LC3 marker, green) and Hoechst (nucleus marker, blue) scale bar: 20 μM (A). MA-10 cells were treated with midazolam (0, 6, 30, and 150 μM) for 1, 3, 6, 12, and 24 hours, respectively, and LC3-II (14 kDa) protein was detected by Western blot. Integrated optical densities of LC3-II proteins were analyzed after normalization with LC3-I (16 kDa) in each lane (B). Atg5–12 (55 kDa) protein was detected by Western blot and proteins were analyzed after normalization with β-actin (43 kDa) in each lane (C). Data in (B) and (C) represent the mean ± standard error of the mean of three separate experiments. *Indicates statistical difference compared to control (C) interrelated to P<0.05.
Figure 5
Figure 5
The involvement of endoplasmic reticulum stress pathways in midazolam-induced apoptosis in MA-10 cells. Notes: A one-way analysis of variance and least significant difference comparison were performed. MA-10 cells were treated with midazolam (0, 30, and 150 μM) for 3, 6, 12, and 24 hours (hr), respectively. ATF6β (76 kDa), phosphor-IRE1α (110 kDa), IRE1α (130 kDa), XBP1 (28 kDa), and cleaved CASP12 (42 kDa) were detected by Western blot (A). Integrated optical densities of ATF6β (B), phosphor-IRE1α (C), XBP1 (D), and cleaved CASP12 (E) proteins were normalized with β-actin (43 kDa) in each lane, respectively. *Indicates statistical difference compared to control (C) (P<0.05). P represents the positive control.
Figure 6
Figure 6
The involvement of endoplasmic reticulum stress pathways in midazolam-induced apoptosis in MA-10 cells. Notes: A one-way analysis of variance and least significant difference comparison were performed. MA-10 cells were treated with midazolam (0, 30, and 150 μM) for 3, 6, 12, and 24 hours (hr), respectively. PERK (140 kDa), phosphor-EIF2α (38 kDa), EIF2α (36 kDa), ATF4 (49 kDa), ATF3 (21 kDa), and CHOP (30 kDa) were detected by Western blot (A). Integrated optical densities of PERK (B), phosphor-EIF2α (C), ATF4 (D), ATF3 (E), and CHOP (F) proteins were normalized with β-actin (43 kDa) in each lane, respectively. *P<0.05, **P<0.01, and ***P<0.005 indicate statistical difference compared to control (C) respectively. The data are expressed as mean ± standard error.
Figure 7
Figure 7
The involvement of the cell cycle in midazolam-induced apoptosis in MA-10 cells. Notes: A one-way analysis of variance and least significant difference comparison were performed. MA-10 cells were treated with midazolam (0, 30, and 150 μM) for 3, 6, 12, and 24 hours (hr), respectively. Cyclin A (55 kDa), cyclin B (63 kDa), and CDK1 (34 kDa) were detected by Western blot (A). Integrated optical densities of cyclin A (B), cyclin B (C), and CDK1 (D) proteins were normalized with β-actin (43 kDa) in each lane, respectively. *P<0.05, **P<0.01, and ***P<0.005 indicate statistical difference compared to control (C) respectively. The data are expressed as mean ± standard error.
Figure 8
Figure 8
The involvement of cell cycle in midazolam-induced apoptosis in MA-10 cells. Notes: A one-way analysis of variance and least significant difference comparison were performed. MA-10 cells were treated with midazolam (0, 30, and 150 μM) for 3, 6, 12, and 24 hours (hr), respectively. Phosphor-p53 (53 kDa), p53, phosphor-p27 (27 kDa), p27, phosphor-p21 (21 kDa), and p21 were detected by Western blot (A). Integrated optical densities of phosphor-p53 (B), phosphor-p27 (C), and phosphor-p21 (D) proteins were normalized with β-actin (43 kDa) in each lane, respectively. *P<0.05, **P<0.01, and ***P<0.005 indicate statistical difference compared to control (C) respectively. The data are expressed as mean ± standard error.

Similar articles

Cited by

References

    1. Reves JG, Fragen RJ, Vinik HR, Greenblatt DJ. Midazolam: pharmacology and uses. Anesthesiology. 1985;62(3):310–324. - PubMed
    1. García-Pedrajas F, Arroyo J. Midazolam in anesthesiology. Rev Med Univ Navarra. 1989;33(4):211–221. - PubMed
    1. Olkkola KT, Ahonen J. Midazolam and other benzodiazepines. Handb Exp Pharmacol. 2008;(182):335–360. - PubMed
    1. So EC, Chang YT, Hsing CH, et al. The effect of midazolam on mouse Leydig cell steroidogenesis and apoptosis. Toxicol Lett. 2010;192(2):169–178. - PubMed
    1. So EC, Lin YX, Tseng CH, et al. Midazolam induces apoptosis in MA-10 mouse Leydig tumor cells through caspase activation and the involvement of MAPK signaling pathway. Onco Targets Ther. 2014;7:211–221. - PMC - PubMed