. 2016 Oct;3(4):041802.
doi: 10.1117/1.NPh.3.4.041802. Epub 2016 May 4.

Filling the gap: adding super-resolution to array tomography for correlated ultrastructural and molecular identification of electrical synapses at the C. elegans connectome

Affiliations

Filling the gap: adding super-resolution to array tomography for correlated ultrastructural and molecular identification of electrical synapses at the C. elegans connectome

Sebastian Matthias Markert et al. Neurophotonics. 2016 Oct.

Abstract

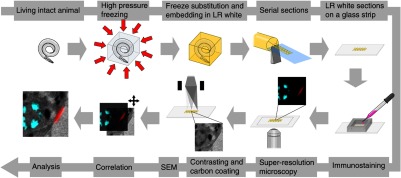
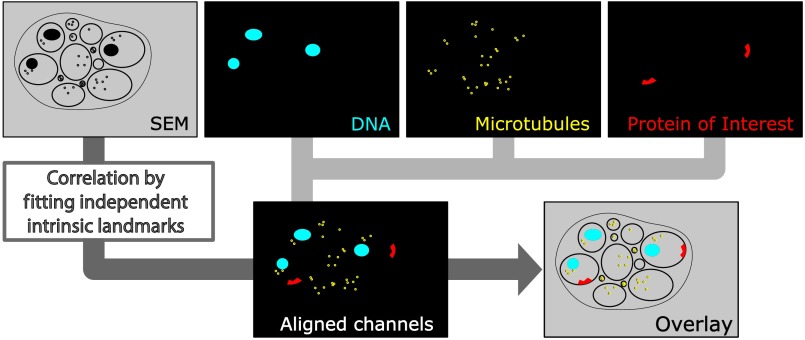
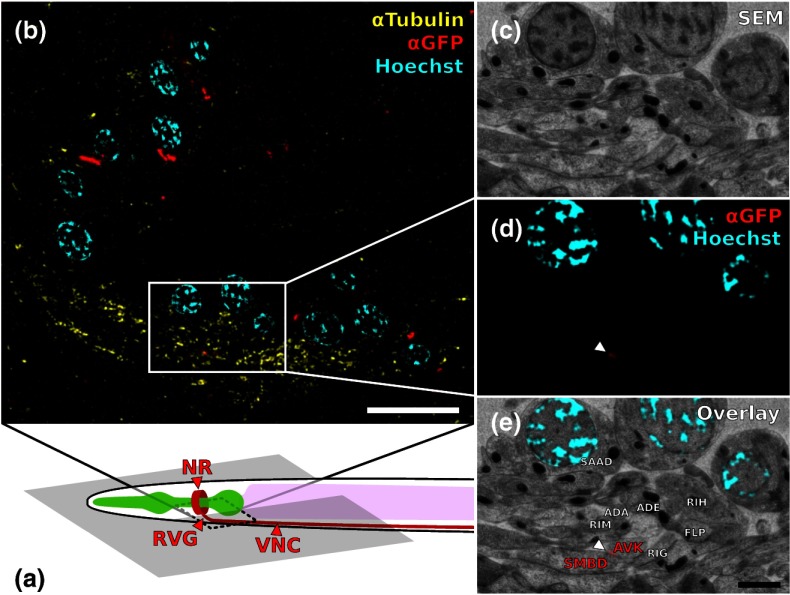
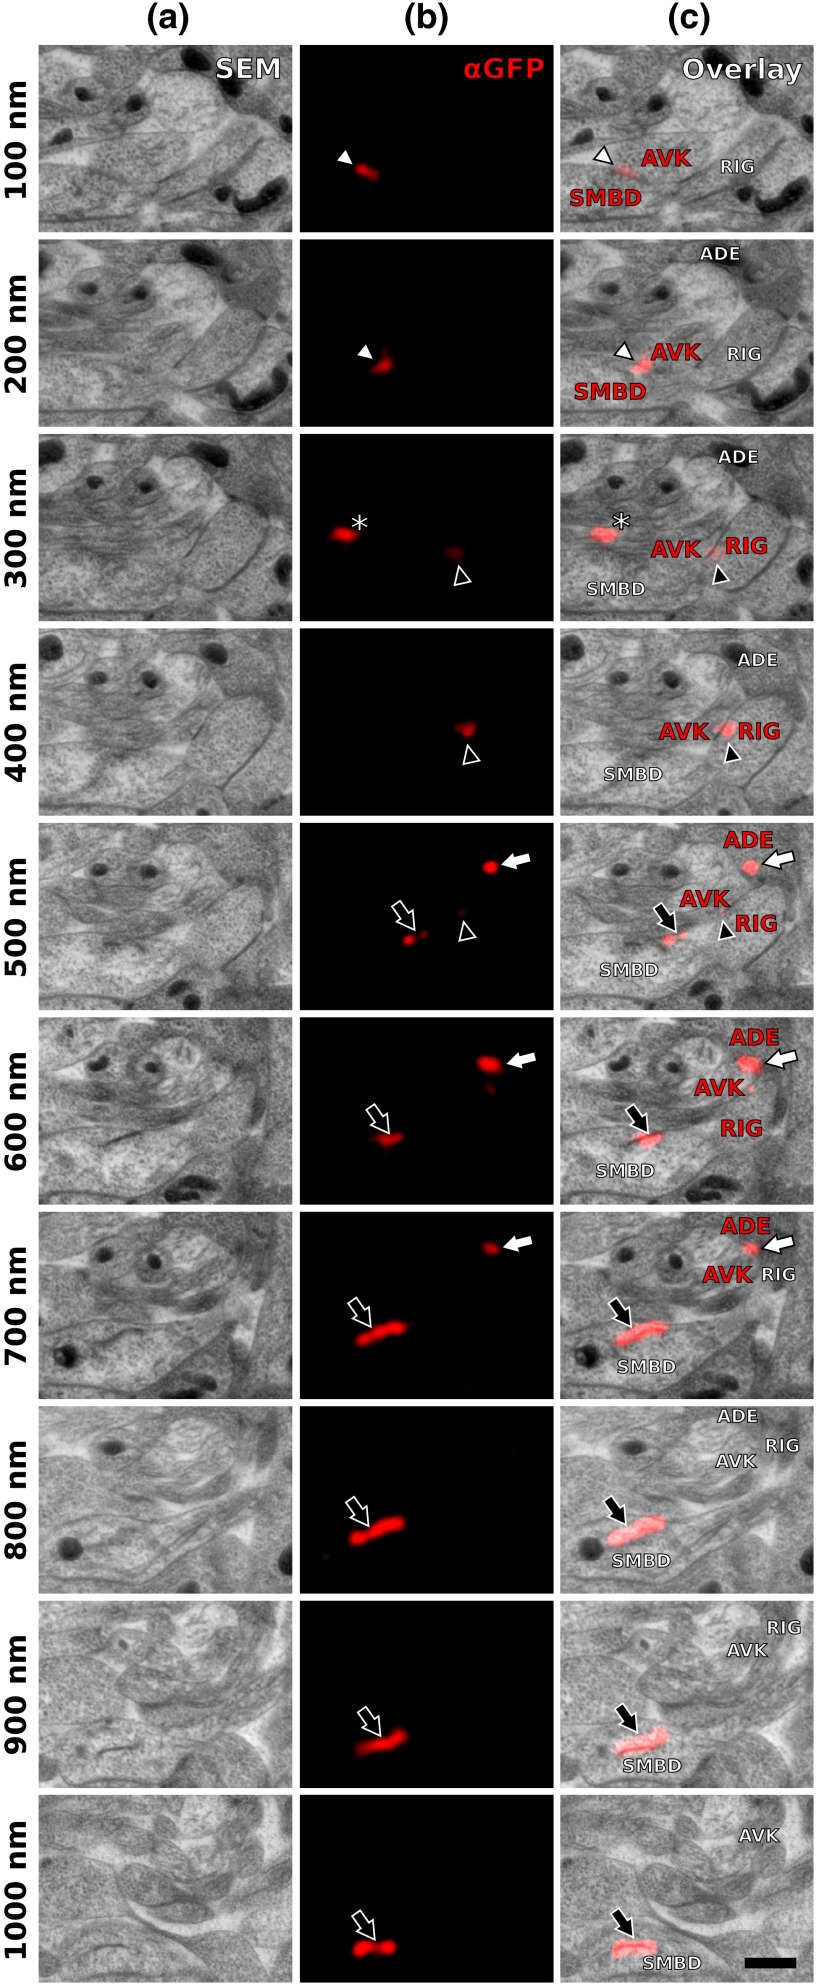
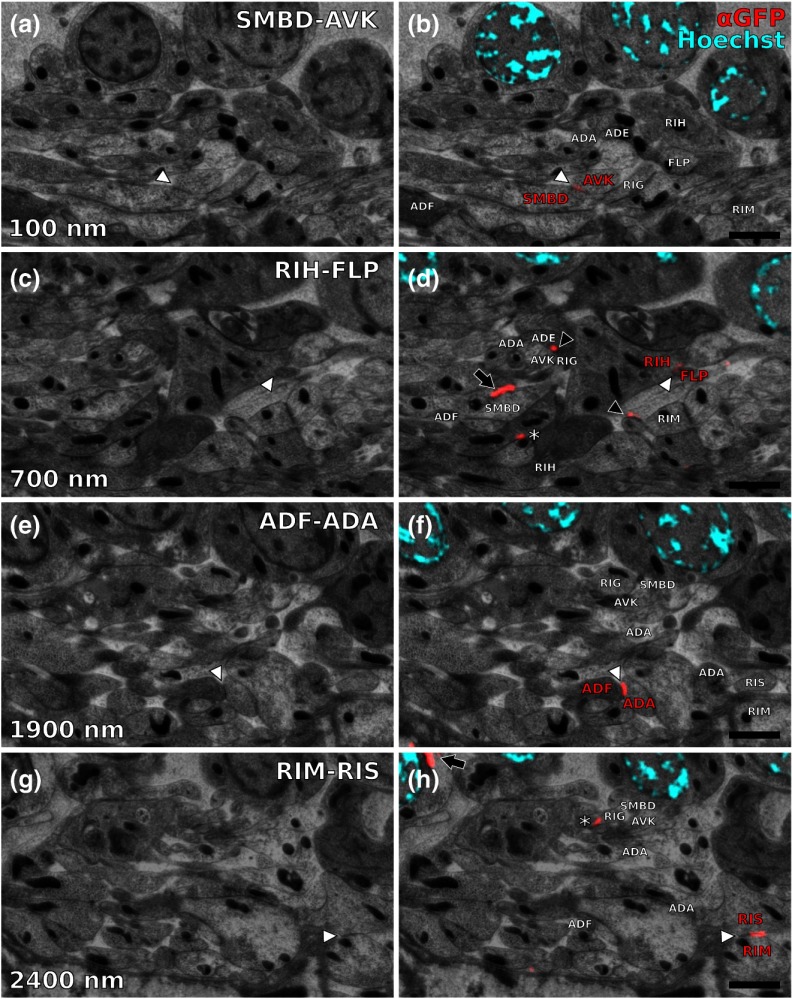
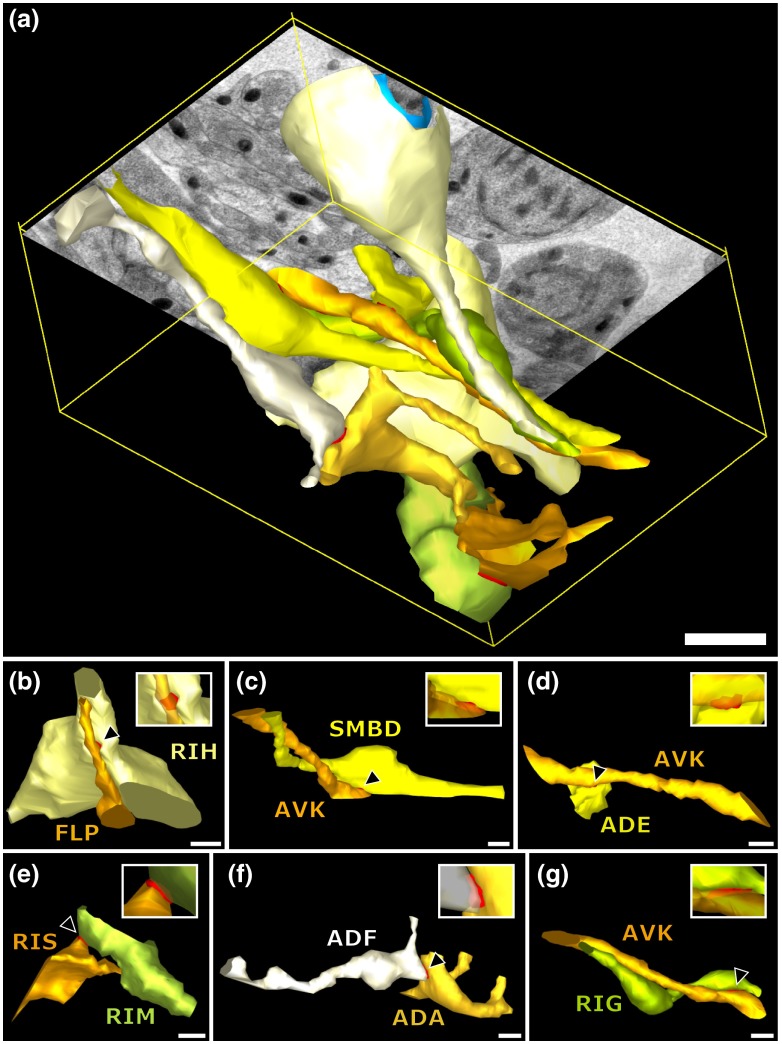
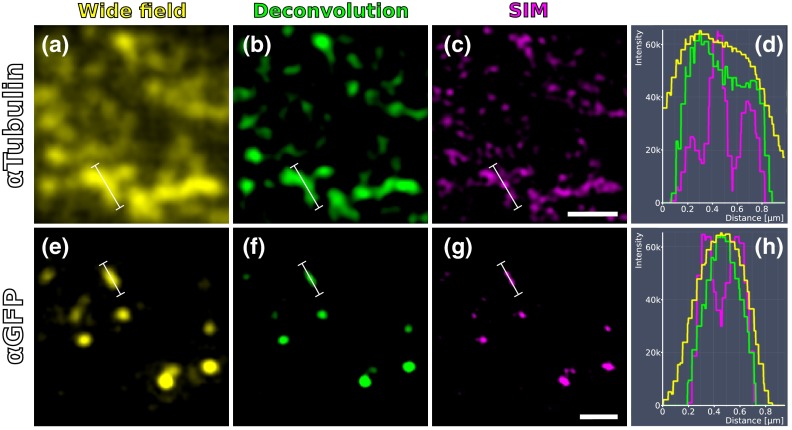
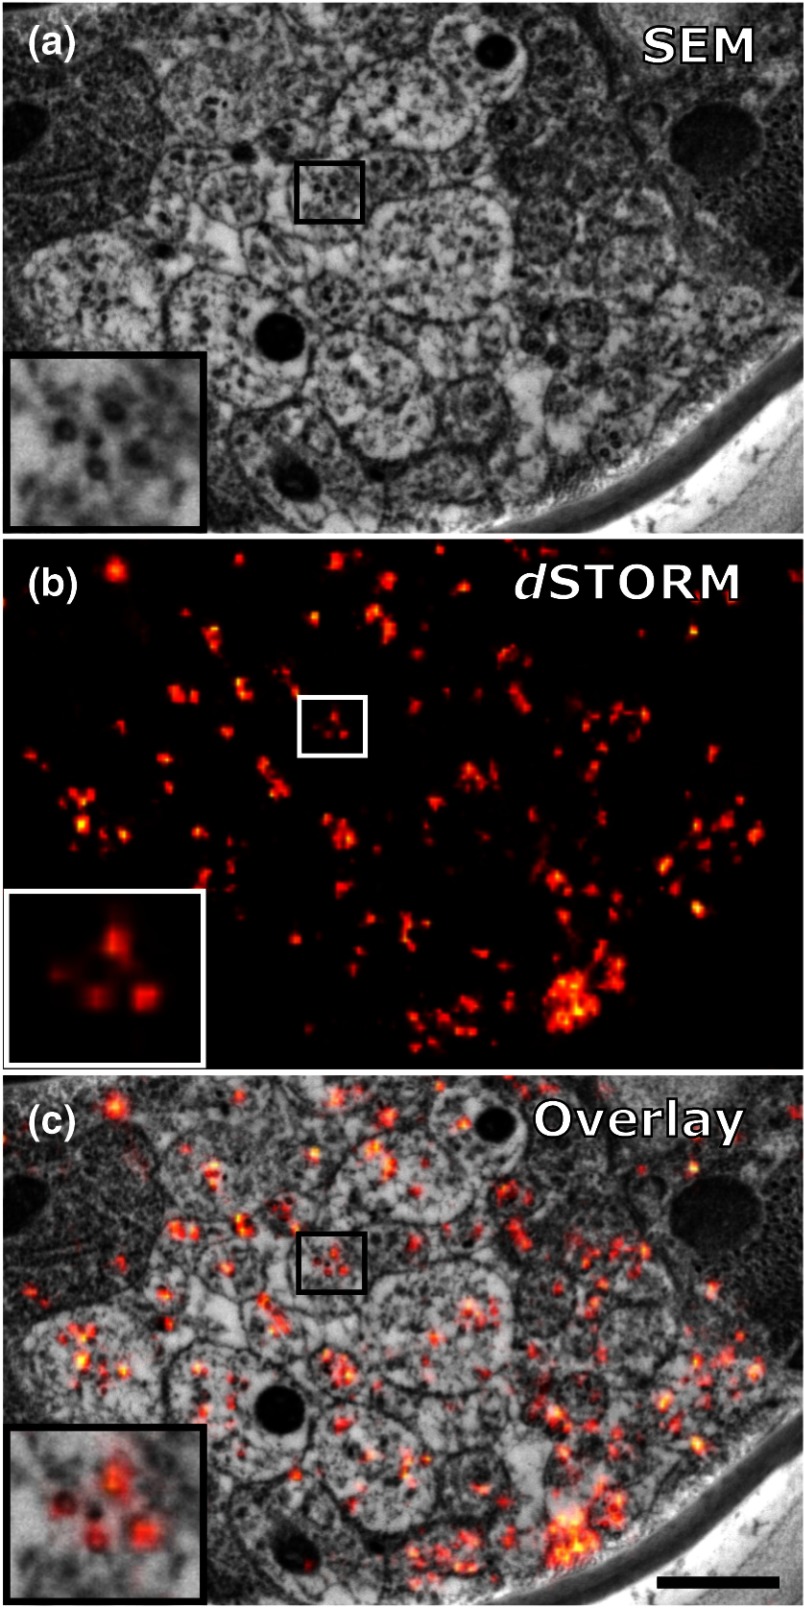
Correlating molecular labeling at the ultrastructural level with high confidence remains challenging. Array tomography (AT) allows for a combination of fluorescence and electron microscopy (EM) to visualize subcellular protein localization on serial EM sections. Here, we describe an application for AT that combines near-native tissue preservation via high-pressure freezing and freeze substitution with super-resolution light microscopy and high-resolution scanning electron microscopy (SEM) analysis on the same section. We established protocols that combine SEM with structured illumination microscopy (SIM) and direct stochastic optical reconstruction microscopy (dSTORM). We devised a method for easy, precise, and unbiased correlation of EM images and super-resolution imaging data using endogenous cellular landmarks and freely available image processing software. We demonstrate that these methods allow us to identify and label gap junctions in Caenorhabditis elegans with precision and confidence, and imaging of even smaller structures is feasible. With the emergence of connectomics, these methods will allow us to fill in the gap-acquiring the correlated ultrastructural and molecular identity of electrical synapses.

Keywords: Caenorhabditis elegans; correlative light and electron microscopy; direct stochastic optical reconstruction microscopy; gap junction; structured illumination microscopy; super-resolution microscopy.


Figures

Fig. 1
Fig. 1
Overview of the workflow from living animal to finished correlated image. See Sec. 2 for details.
Fig. 2
Fig. 2
Diagram of the correlation strategy using intrinsic landmarks. In addition to the protein of interest, one or more independent, well-described structures are labeled. These should be unambiguously identifiable in electron micrographs as well. After channel alignment of all fluorescent channels only the independent landmarks are used for correlation transformations. Thus, precise and unbiased localization of the protein of interest is achieved.
Fig. 3
Fig. 3
Correlation example. (a) Scheme of the cutting plane (gray) through the young adult hermaphrodite. (b) SIM image of a section. Nuclei (cyan) and microtubules (yellow) as well as UNC-7::GFP (red) are stained. High incidence of microtubules marks neuropil tissue, which is useful for orientation. Scale bar: 5  μm. (c) Inverted SEM image of a subregion of the RVG of the same section. (d) Detail of the SIM image corresponding to the SEM image in (c). (e) Overlay of (c) and (d). SIM images are correlated to the SEM images using in this case only the super-resolved Hoechst signal, but not the microtubule staining. The anti-GFP signal (labeling UNC-7::GFP) then is superimposed without further positional manipulation. In this example, a gap junction is seen (white arrowhead). Some relevant cell identities are annotated. See Fig. 5 for details. Scale bar: 1  μm.
Fig. 4
Fig. 4
Serial sections through the RVG of a young adult hermaphrodite reveal UNC-7::GFP containing gap junctions and ER. (a) Inverted SEM images of 10 serial 100 nm sections showing neuropil tissue. (b) SIM images of the same regions as in (a). Signals from anti-GFP immunostaining are displayed in red. (c) Overlay of (a) and (b). White and black arrowheads as well as the white arrow point to one gap junction each, as it appears in several consecutive sections of the series. Asterisk marks a signal that is only seen in a single section and is thus not considered a bona fide gap junction. Black arrow marks a pronounced UNC-7::GFP expression in what is very likely ER and not a gap junction. Relevant cell identities are annotated. Names of cells forming a gap junction in the particular section are given in red. Scale bar: 500 nm.
Fig. 5
Fig. 5
Selection of UNC-7::GFP-positive gap junctions in the wider context of the RVG. (a) Gap junction between SMBD and AVK (white arrowhead). (c) Gap junction between RIH and FLP (white arrowhead). (e) Gap junction between ADF and ADA (white arrowhead). (g) Gap junction between RIM and RIS (white arrowhead). (b), (d), (f), (h) Same SEM images as (a), (c), (e), (g), respectively, but with correlated SIM signals overlaid. All identified UNC-7::GFP-positive cells are annotated, if visible. Black arrowheads: other UNC-7::GFP-positive gap junctions. Black arrows: UNC-7::GFP contained in ER. Asterisks: signals only visible in one section, treated as random background labeling. Scale bars: 1  μm.
Fig. 6
Fig. 6
3-D models of neurite projections of 10 UNC-7::GFP gap junction forming neurons and SAAD somatic region. (a) Overview with first section of the SEM data set shown. Red: gap junctions. Light blue: nucleus of SAAD (shown for context). Yellowish colors: plasma membranes. Scale bar: 1  μm. (b)–(g) Individual pairs of neurons connected by a UNC-7::GFP-positive gap junctions. Black arrowheads: gap junctions (also shown in red). Insets: closer look on the gap junctions though partially transparent neurons. Neuronal identities are color coded. Scale bars: 500 nm.
Fig. 7
Fig. 7
Comparison of SIM and conventional fluorescence microscopy with and without deconvolution. (a) Wide-field fluorescence image of anti-tubulin staining on a 100-nm LR White section of the RVG of C. elegans. (b) Same region as in (a), but after deconvolution algorithm was applied. (c) Same region as in (a) and (b), but after super-resolution SIM algorithm was applied. (d) Intensity profile of the three imaging methods reveals that SIM makes it possible to discern more individual signals than deconvolution. The white lines in (a)–(c) correspond to the intensity profile displayed in (d). (e)–(h) Same as in (a)–(d), also the same section, but with anti-GFP staining displayed. Scale bars: 1  μm.
Fig. 8
Fig. 8
Microtubules in the ventral nerve cord of C. elegans correlated with dSTORM. (a) SEM image of the ventral nerve cord of an adult hermaphrodite cured in LR White at 52°C. Note the pronounced tissue extraction of the sample. Inlay: four microtubules. (b) dSTORM image of an IHC staining against α-tubulin at the same location and on the same section as in (a). (c) Overlay of (a) and (b). Scale bar: 500 nm.

References

    1. Micheva K. D., Smith S. J., “Array tomography,” Neuron 55(1), 25–36 (2007).NERNET10.1016/j.neuron.2007.06.014 - DOI - PMC - PubMed
    1. Kukulski W., et al. , “Correlated fluorescence and 3D electron microscopy with high sensitivity and spatial precision,” J. Cell. Biol. 192(1), 111–119 (2011).10.1083/jcb.201009037 - DOI - PMC - PubMed
    1. Hell S. W., Wichmann J., “Breaking the diffraction resolution limit by stimulated emission: stimulated-emission-depletion fluorescence microscopy,” Opt. Lett. 19(11), 780–782 (1994).OPLEDP10.1364/OL.19.000780 - DOI - PubMed
    1. Betzig E., et al. , “Imaging intracellular fluorescent proteins at nanometer resolution,” Science 313(5793), 1642–1645 (2006).SCIEAS10.1126/science.1127344 - DOI - PubMed
    1. Watanabe S., et al. , “Protein localization in electron micrographs using fluorescence nanoscopy,” Nat. Methods 8(1), 80–84 (2011).10.1038/nmeth.1537 - DOI - PMC - PubMed