. 2016 Jun 14;7(24):36940-36955.
doi: 10.18632/oncotarget.9230.

Estrogen regulates miRNA expression: implication of estrogen receptor and miR-124/AKT2 in tumor growth and angiogenesis

Affiliations

Estrogen regulates miRNA expression: implication of estrogen receptor and miR-124/AKT2 in tumor growth and angiogenesis

Cheng-Fei Jiang et al. Oncotarget. .

Abstract

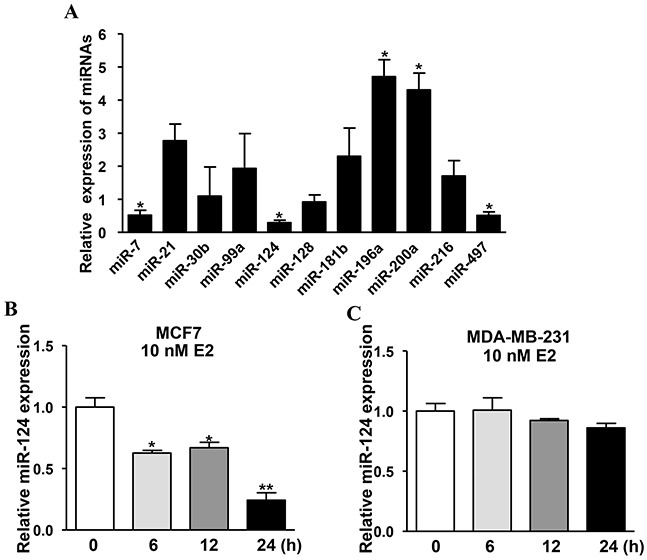
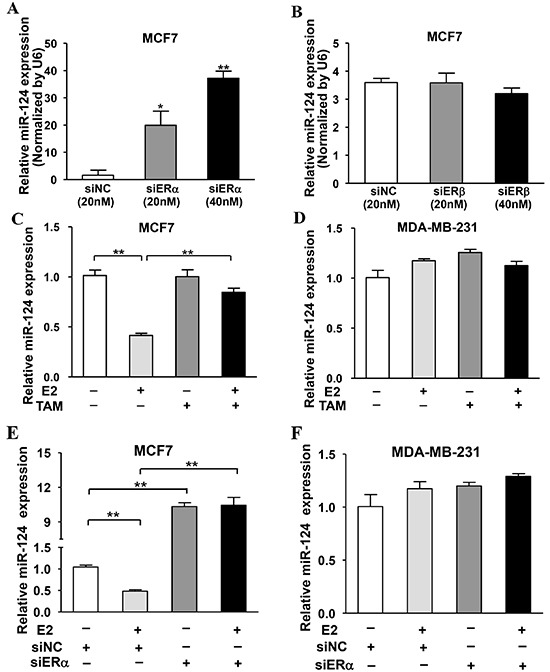
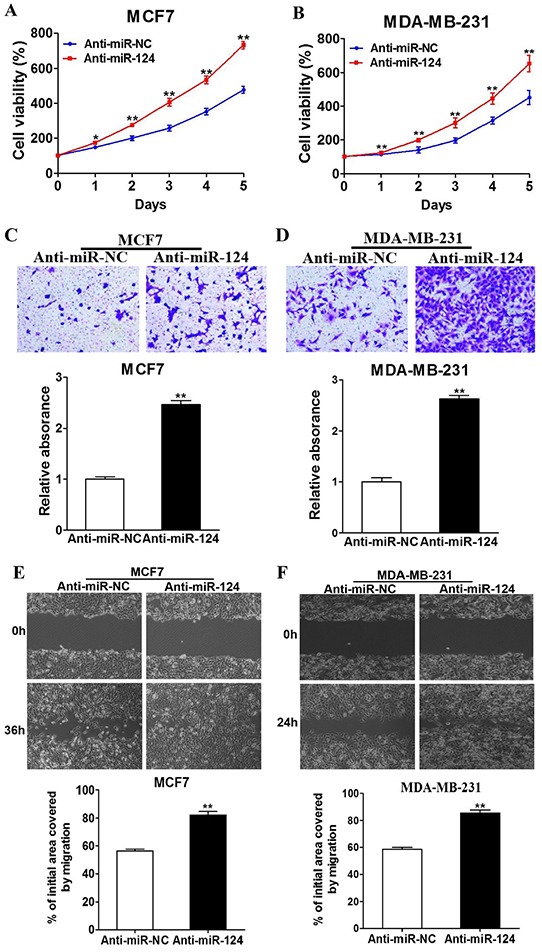
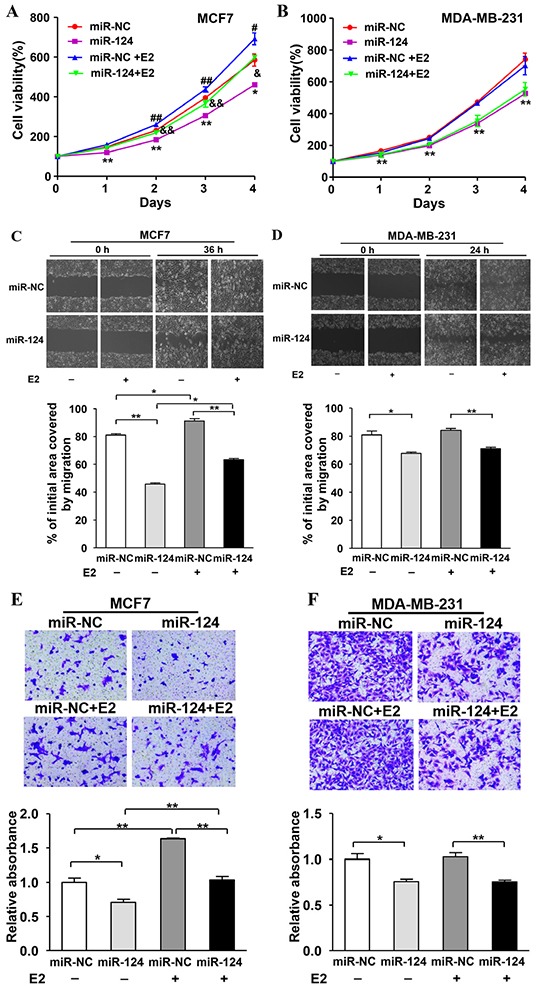
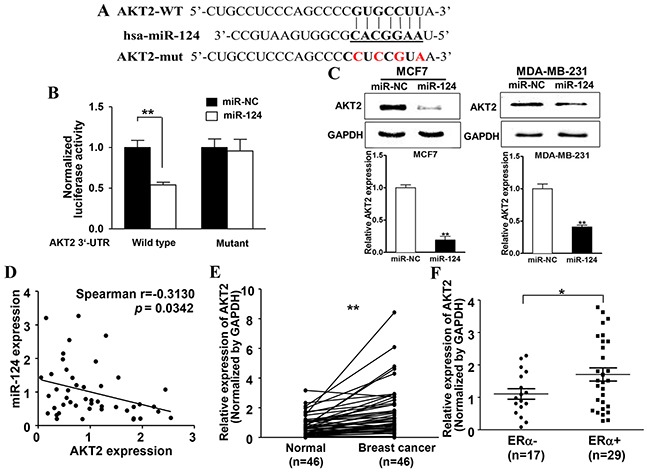
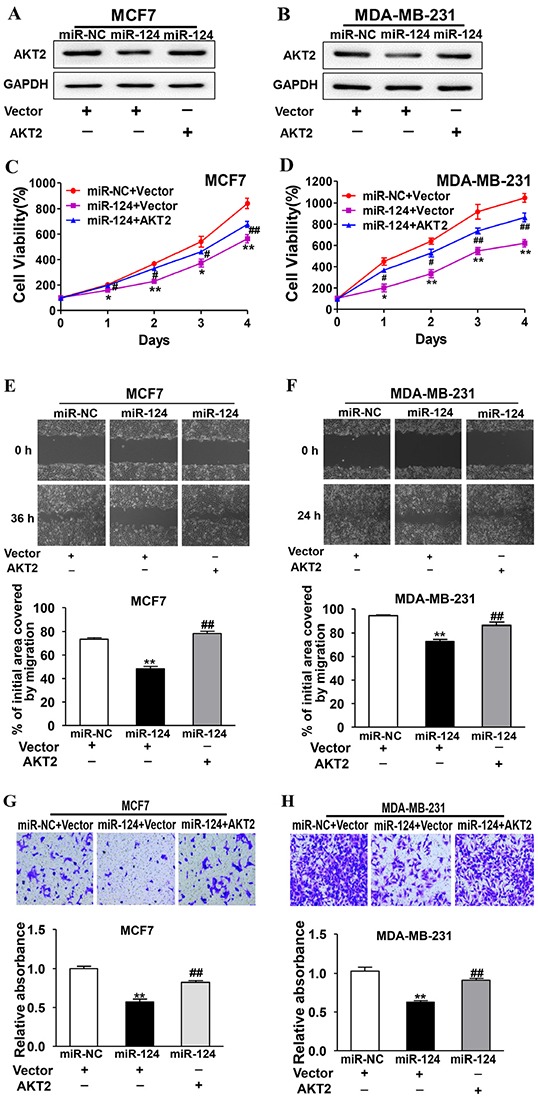
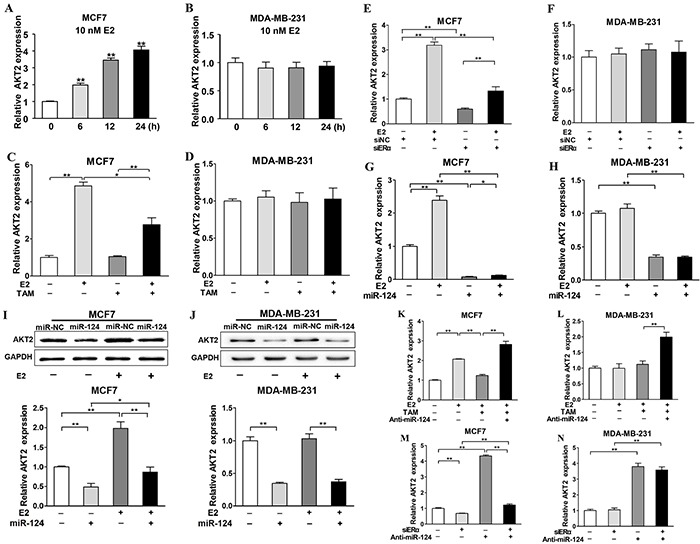
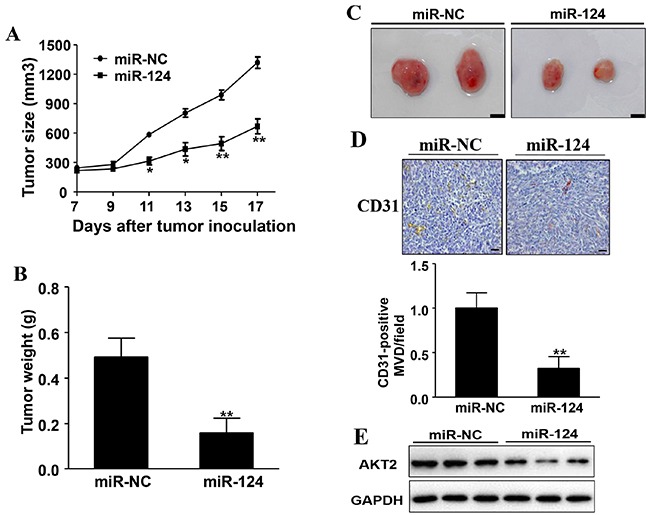
It is currently known that estrogen plays an important role in breast cancer (BC) development, but the underlying molecular mechanism remains to be elucidated. Accumulating evidence has revealed important roles of microRNAs in various kinds of human cancers, including BC. In this study, we found that among the microRNAs regulated by estrogen, miR-124 was the most prominent downregulated miRNA. miR-124 was downregulated by estradiol (E2) treatment in estrogen receptor (ER) positive BC cells, miR-124 overexpression suppressed cell proliferation, migration and invasion in BC cells; while the suppression of miR-124 using Anti-miR-124 inhibitor had opposite cellular functions. Under the E2 treatment, miR-124 had stronger effect to inhibit cellular functions in MCF7 cells than that in MDA-MB-231 cells. In addition, we identified that ERα, but not ERβ, was required for E2-induced miR-124 downregulation. Furthermore, AKT2, a known oncogene, was a novel direct target of miR-124. AKT2 expression levels were inversely correlated with miR-124 expression levels in human breast cancer specimens. AKT2 was overexpressed in BC specimens, and its expression levels were much higher in ERα positive cancer tissues than those ERα negative cancer tissues. Consistent with miR-124 suppression, E2 treatment increased AKT2 expression levels in MCF7 cells via ERα. Finally, overexpression of miR-124 in MCF7 cells significantly suppressed tumor growth and angiogenesis by targeting AKT2. Our results provide a mechanistic insight into a functional role of new ERα/miR-124/AKT2 signaling pathway in BC development. miR-124 and AKT2 may be used as biomarkers for ERα positive BC and therapeutic effect in the future.

Keywords: AKT2; breast cancer; estrogen; estrogen receptors; miR-124.


Conflict of interest statement

The authors declare that they have no conflict of interest.

Figures

Figure 1
Figure 1. Estradiol (E2) mediates levels of certain miRNAs, and miR-124 is the most prominently downregulated miRNA which is inhibited by E2 treatment in estrogen receptor (ER) positive BC cells
A. MCF7, the ER-positive BC cells were cultured estrogen-free medium for 72 h, then treated with 10 nM E2 or equal amount of ethyl alcohol (Eth) as solvent control. The expression levels of miRNAs were analyzed by qRT-PCR and U6 levels were used as internal control, and normalized to the values of Eth control. Data were presented as the means ± SD from three independent experiments with triple replicates per experiment. * indicates significant difference upon E2 treatment at P < 0.05. B. E2 treatment reduced miR-124 expression in MCF7 cells. Cells were cultured with E2 or Eth for 0, 6, 12 and 24 h. The relative miR-124 expression levels were analyzed as above. Data were presented as the means ± SD from three independent experiments with triple replicates per experiment. * and ** indicate significant difference under E2 treatment when compared to solvent control Eth with P < 0.05 and P < 0.01, respectively. C. E2 treatment had no effect on miR-124 expression in MDA-MB-231 cells. ER-negative BC cells MDA-MB-231 were treated and miR-124 was detected as above.
Figure 2
Figure 2. ERα, but not ERβ, was required for E2-suppressed miR-124 expression
A. Knockdown of ERα in MCF7 cells induced miR-124 expression. B. ERβ silencing had no effect on miR-124 expression. MCF7 cells were transfected with different dose of ERα siRNAs, ERβ siRNAs or negative control siRNAs (siNC). After 72 h, the relative expression levels of miR-124 were analyzed by qRT-PCR and normalized to U6 expression levels. Data were presented as the means ± SD from three independent experiments with triple replicates per experiment. * and ** indicate significant difference compared to control with P < 0.05 and P < 0.01, respectively. C. E2 treatment decreased miR-124 expression, which was restored by tamoxifen (TAM) treatment. MCF7 cells were cultured in estrogen-free medium and treated without or with 10 nM E2 and 100 nM TAM for 24 h. The expression of miR-124 was detected as above. Data were presented as means ± SD from three independent experiments with triple replicates per experiment. ** indicates significant difference between two groups at P < 0.01. D. E2 and TAM had no effect on miR-124 expression. MDA-MB-231 cells were treated and miR-124 was analyzed as above. E. Knockdown of ERα recovered E2-suppressed miR-124 levels in MCF7 cells. MCF7 cells were cultured as above, then transfected with siERα or siNC for 24 h. Cells were treated with or without 10 nM E2 for 24 h and the expression of miR-124 were detected as above. Data were presented as the means ± SD from three independent experiments with triple replicates per experiment. ** indicates significant difference between two groups at P < 0.01. F. E2 treatment and knockdown of ERα showed no effect on miR-124 expression in MDA-MB-231 cells.
Figure 3
Figure 3. Downregulation of endogenous miR-124 promotes the proliferation, migration and invasion of BC cells
A. and B. MCF7 and MDA-MB-231 cells were transfected with anti-miR-124 inhibitor (Anti-miR-124), or control anti-sense RNA (anti-miR-NC). Cell Counting Kit-8 (CCK-8) was used to detect cell vitality every 24 h, and the results were presented as the means± SD from three independent experiments performed in quintuple. * and ** indicate significant difference compared to anti-miR-NC with P < 0.05 and P < 0.01, respectively. C. and D. The treated cells were used to perform wound healing assay to estimate the ability of cell migration. A sterile 10 μl pipette tip was used to scratch the cells to form a wound when the different treated cells were cultured to 90% confluence. The wound gaps were photographed (top) and measured (bottom). Data were presented as the means±SD. ** indicates significant difference between two groups at P < 0.01 E. and F. The cells above were used to perform Matrigel invasion assay as described. After incubation for 24 h, the cells in the bottom of the invasion chamber were photographed and the acetic acid-eluted solution was quantified using a standard microplate reader at 570 nm. Data were presented as the means ± SD from three independent experiments with triple replicates per experiment. ** indicates significant difference between two groups at P < 0.01.
Figure 4
Figure 4. miR-124 overexpression inhibits E2-induced cell proliferation, migration and invasion in ER-positive BC cells
The estrogen-positive and -negative cell lines MCF7 and MDA-MB-231 were infected with lentivirus carrying miR-124 or miR-NC to establish stable cell lines. A. MCF7/miR-124 and MCF7/miR-NC stable cells were plated at 2,000 cells/well in 96-well plates. After adherence, cells were treated with E2 or Eth solvent. Cell Counting Kit-8 (CCK-8) was used to detect cell vitality every 24 h and the results were presented as the means± SD from three independent experiments performed in quintuple. * and ** indicate significant difference compared to miR-NC without E2 treatment group with P < 0.05 and P < 0.01, respectively; # and ## indicate significant difference upon E2 treatment with P < 0.05 and P < 0.01, respectively; & and && indicate significant difference when compared to miR-NC with E2 treatment group with P < 0.05 and P < 0.01, respectively. B. MDA-MB-231/miR-124 and MDA-MB-231/miR-NC stable cells were treated and analyzed as above. ** indicates significant difference compared to miR-NC without E2 treatment group at P < 0.01. C. and D. The stable cells above with or without E2 treatment were used to perform wound healing assay to estimate the ability of cell migration. A sterile 10 μl pipette tip was used to scratch the cells to form a wound when the different treated cells were cultured to 90% confluence. The wound gaps were photographed (top) and measured (bottom). Data were presented as the means± SD. * and ** indicate significant difference between two groups with P < 0.05 and P < 0.01, respectively. E. and F. The stable cells above were used to perform Matrigel invasion assay as described. In addition, the E2 or Eth solvent was mixed into the medium respectively in the lower chamber. After incubation for 24 h, the cells in the bottom of the invasion chamber were photographed and the acetic acid-eluted solution was quantified using a standard microplate reader at 570 nm. Data were presented as the means ± SD from three independent experiments with triple replicates per experiment. * and ** indicate significant difference between two groups with P < 0.05 and P < 0.01, respectively.
Figure 5
Figure 5. miR-124 directly targets and inhibits AKT2 expression, miR-124 levels inversely correlates with AKT2 expression levels in ERα-positive BC tissues
A. Putative seed-matching sites (in bold) or mutant sites (red) between miR-124 and 3′-UTR of AKT2. B. Luciferase reporter assay was performed using MDA-MB-231 cells to detect the relative luciferase activities of WT and mut AKT2 reporters. Renilla luciferase vector was used as an internal control. Data were presented as the means± SD from three independent experiments with triple replicates per experiment. ** indicates significant difference compared to control at P < 0.01. C. The expression of AKT2 and GAPDH was determined using immunoblotting in MCF7 and MDA-MB-231 cells overexpressing miR-124 and miR-NC. The densities of AKT2 were quantified by ImageJ software and GAPDH levels were used as internal control, and normalized to the values of Eth control. Data were presented as the means ± SD from three independent experiments with triple replicates per experiment. ** indicates significant difference compared to control at P < 0.01. D. Spearman's correlation analysis was used to determine the correlation between the expression levels of AKT2 and miR-124 in human BC specimens (n=46). Data were presented as the means ± SD from three independent experiments with triple replicates per experiment. E. The expression levels of AKT2 in adjacent normal tissues and human BC specimens were determined by qRT-PCR, and the fold changes were obtained from the ratio of AKT2 to GAPDH levels. Data were presented as mean from three independent experiments with triple replicates per experiment. ** indicates significant difference comparing normal tissues at P < 0.01. F. The relative AKT2 expression levels of BC tumors were analyzed according to ERα status (ERα-negative, n=17; ERα–positive, n =29). Data were presented as mean from three independent experiments with triple replicates per experiment. * indicates significant difference comparing ERα-negative and ERα–positive tumors at P < 0.05.
Figure 6
Figure 6. Forced expression of AKT2 reverses miR-124-suppressed cell proliferation, migration and invasion
miR-124- or miR-NC-overexpressing cells were transfected with vector or AKT2 cDNA without 3′-UTR. A. and B. The expression levels of AKT2 and GAPDH were determined by immunoblotting after 48 h. C. and D. Cell viability was detected using CCK-8 assay. Data were presented as the means ± SD from three independent experiments with triple replicates per experiment. * and ** indicate significant difference compared to miR-NC+vector group with P < 0.05 and P < 0.01, respectively. # and ## indicate significant difference compared to miR-124+vector group with P < 0.05 and P < 0.01, respectively. E. and F. Cells were treated and wound healing assay was performed as above. Data were presented as the means ± SD from three independent experiments with triple replicates per experiment. ** indicates significant difference compared to miR-NC+vector group at P < 0.01; ## indicates significant difference compared to miR-124+vector group at P < 0.01. G. and H. Transwell invasion assay was performed as above using control cells and cells overexpressing miR-124 with or without AKT2 overexpression. Data were presented as the means ± SD from three independent experiments with triple replicates per experiment. ** indicates significant difference compared to miR-NC+vector group at P < 0.01; ## indicates significant difference compared to miR-124+vector group at P < 0.01.
Figure 7
Figure 7. ERα is required for E2 upregulated-AKT2 expression, which can be inhibited by miR-124 in ERα-positive BC cells
A. and B. MCF7 and MDA-MB-231 cells were cultured as above and treated with E2 for 0, 6, 12 and 24 h. The relative AKT2 expression of each group was analyzed by qRT-PCR and represented the ratio to control group. Data were presented as the means ± SD from three independent experiments with triple replicates per experiment. ** indicates significant difference compared to control at P < 0.01. C. and D. TAM was used as the E2 antagonist and the expression levels of AKT2 were analyzed by qRT-PCR. Data were presented as the means ± SD from three independent experiments with triple replicates per experiment. * and ** indicate significant difference between two groups with P < 0.05 and P < 0.01, respectively. E. and F. Cells were cultured and treated as in Figure 2E, the expression levels of AKT2 were analyzed as above. Data were presented as the means ± SD from three independent experiments with triple replicates per experiment. ** indicates significant difference between two groups at P < 0.01. G. and H. The cells were cultured as above and the expression levels of AKT2 were determined by qRT-PCR in miR-124- and miR-NC-overexpressing cells without or with E2 treatment for 24 h using GAPDH levels as internal control, and normalized to the value of Eth control. Data were presented as the means ± SD from three independent experiments with triple replicates per experiment. * and ** indicate significant differences between two groups with P < 0.05 and P < 0.01, respectively. I. and J. The expression levels of AKT2 and GAPDH were determined by immunoblotting in miR-124- and miR-NC-overexpressing cells without or with E2 treatment for 48 h. The densities of AKT2 were quantified by Image J software and GAPDH levels were used as internal control, and normalized to the values of Eth control. Data were presented as the means ± SD from three independent experiments with triple replicates per experiment. * and ** indicate significant differences between two groups with P < 0.05 and P < 0.01, respectively. K. and L. MCF7 and MDA-MB-231 cells were cultured as above and transfected with siRNAs, and divided in four groups including siNC+Anti-miR-NC, siERα+Anti-miR-NC, siNC+Anti-miR-124, siERα+ Anti-miR-124 group. After 24 h, the expression levels of AKT2 were determined by qRT-PCR using GAPDH levels as internal control, and normalized to the values of siNC+Anti-miR-NC group. Data were presented as the means ± SD from three independent experiments with triple replicates per experiment. ** indicates significant difference between two groups at P < 0.01 M. and N. Cells were cultured as above and transfected with Anti-miR-NC or Anti-miR-124. After 24 h, the cells were treated with or without 10 nM E2 and 100nM TAM for 24 h. The expression levels of AKT2 were determined by qRT-PCR using GAPDH levels as internal control, and normalized to the values of Eth+Anti-miR-NC group. Data were presented as the means ± SD from three independent experiments with triple replicates per experiment. ** indicates significant difference between two groups at P < 0.01.
Figure 8
Figure 8. Overexpression of miR-124 inhibits tumor growth and angiogenesis
A. MCF7/miR-124 and MCF7/miR-NC cells were dispersed in 100 μl of serum-free DMEM medium and were subcutaneously injected into both sides of posterior flank of the nude mice (n=4). Tumors were measured every two days since they were apparently seen and the volumes were calculated using the following formula: volume = 0.5 × Length × Width2. * and ** indicate significant difference compared to miR-NC group with P < 0.05 and P < 0.01, respectively. B. The tumor was excised and weighed after 17 days. Data were presented as the means ± SD. ** indicates significant difference compared to miR-NC group at P < 0.01. C. The representative pictures of trimmed tumors (Bar= 10mm). D. The expression levels of CD31 were analyzed in tumor tissues by immunohistochemistry. The density of CD31 levels was quantified by ImageJ software. Magnification, ×200, Scale bar, 20 μm. E. The whole protein was extracted from xenografts and subjected to immunoblotting assay for AKT2 expression. GAPDH expression was served as an internal control.

Similar articles

Cited by

References

    1. Pinho FG, Frampton AE, Nunes J, Krell J, Alshaker H, Jacob J, Pellegrino L, Roca-Alonso L, de Giorgio A, Harding V, Waxman J, Stebbing J, Pchejetski D, Castellano L. Downregulation of microRNA-515-5p by the estrogen receptor modulates sphingosine kinase 1 and breast cancer cell proliferation. Cancer research. 2013;73:5936–5948. - PubMed
    1. Clemons M, Goss P. Estrogen and the risk of breast cancer. N Engl J Med. 2001;344:276–285. - PubMed
    1. Yager JD, Davidson NE. Estrogen carcinogenesis in breast cancer. N Engl J Med. 2006;354:270–282. - PubMed
    1. Sommer S, Fuqua SA. Estrogen receptor and breast cancer. Semin Cancer Biol. 2001;11:339–352. - PubMed
    1. Ross-Innes CS, Stark R, Teschendorff AE, Holmes KA, Ali HR, Dunning MJ, Brown GD, Gojis O, Ellis IO, Green AR, Ali S, Chin SF, Palmieri C, Caldas C, Carroll JS. Differential oestrogen receptor binding is associated with clinical outcome in breast cancer. Nature. 2012;481:389–393. - PMC - PubMed

MeSH terms