The role of Wnt/β-catenin signaling pathway in melanoma epithelial-to-mesenchymal-like switching: evidences from patients-derived cell lines
- PMID: 27175588
- PMCID: PMC5190024
- DOI: 10.18632/oncotarget.9232
The role of Wnt/β-catenin signaling pathway in melanoma epithelial-to-mesenchymal-like switching: evidences from patients-derived cell lines
Abstract
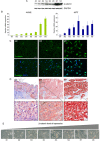
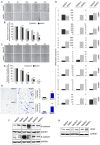
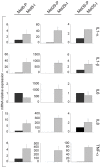
Deregulations or mutations of WNT/β-catenin signaling have been associated to both tumour formation and progression. However, contradictory results concerning the role of β-catenin in human melanoma address an open question on its oncogenic nature and prognostic value in this tumour. Changes in WNT signaling pathways have been linked to phenotype switching of melanoma cells between a highly proliferative/non-invasive and a slow proliferative/metastatic condition. We used a novel panel of cell lines isolated from melanoma specimens, at initial passages, to investigate phenotype differences related to the levels and activity of WNT/β-catenin signaling pathway. This in vitro cell system revealed a marked heterogeneity that comprises, in some cases, two distinct tumour-derived subpopulations of cells presenting a different activation level and cellular distribution of β-catenin. In cells derived from the same tumor, we demonstrated that the prevalence of LEF1 (high β-catenin expressing cells) or TCF4 (low β-catenin expressing cells) as β-catenin partner for DNA binding, is associated to the expression of two distinct profiles of WNT-responsive genes. Interestingly, melanoma cells expressing relative low level of β-catenin and an invasive markers signature were associated to the TNF-α-induced pro-inflammatory pathway and to the chemotherapy resistance, suggesting that the co-existence of melanoma subpopulations with distinct biological properties could influence the impact of chemo- and immunotherapy.
Keywords: WNT/β-catenin; melanoma heterogeneity; metastases; proliferation.
Conflict of interest statement
All authors state no conflict of interest.
Figures


Similar articles
-
Differential LEF1 and TCF4 expression is involved in melanoma cell phenotype switching.Pigment Cell Melanoma Res. 2011 Aug;24(4):631-42. doi: 10.1111/j.1755-148X.2011.00871.x. Epub 2011 Jun 9. Pigment Cell Melanoma Res. 2011. PMID: 21599871
-
SNAIL1 employs β-Catenin-LEF1 complexes to control colorectal cancer cell invasion and proliferation.Int J Cancer. 2020 Apr 15;146(8):2229-2242. doi: 10.1002/ijc.32644. Epub 2019 Sep 18. Int J Cancer. 2020. PMID: 31463973
-
[Nuclear beta-catenin localization is not sufficient for canonical Wnt signaling activation in human meianoma cell lines].Mol Biol (Mosk). 2011 Sep-Oct;45(5):884-91. Mol Biol (Mosk). 2011. PMID: 22393786 Russian.
-
The WNT-less wonder: WNT-independent β-catenin signaling.Pigment Cell Melanoma Res. 2016 Sep;29(5):524-40. doi: 10.1111/pcmr.12501. Epub 2016 Aug 1. Pigment Cell Melanoma Res. 2016. PMID: 27311806 Review.
-
The Wnts of change: How Wnts regulate phenotype switching in melanoma.Biochim Biophys Acta. 2015 Dec;1856(2):244-51. doi: 10.1016/j.bbcan.2015.10.002. Epub 2015 Nov 4. Biochim Biophys Acta. 2015. PMID: 26546268 Free PMC article. Review.
Cited by
-
Epidemiological link between obesity, type 2 diabetes mellitus and cancer.World J Methodol. 2021 May 20;11(3):23-45. doi: 10.5662/wjm.v11.i3.23. eCollection 2021 May 20. World J Methodol. 2021. PMID: 34026577 Free PMC article. Review.
-
Depicting the Implication of miR-378a in Cancers.Technol Cancer Res Treat. 2022 Jan-Dec;21:15330338221134385. doi: 10.1177/15330338221134385. Technol Cancer Res Treat. 2022. PMID: 36285472 Free PMC article. Review.
-
β-Catenin Expression and Activation in Conjunctival Melanoma.Dermatopathology (Basel). 2019 Jun 26;6(2):50-62. doi: 10.1159/000500682. eCollection 2019 Apr-Jun. Dermatopathology (Basel). 2019. PMID: 31700844 Free PMC article.
-
Individualized Proteogenomics Reveals the Mutational Landscape of Melanoma Patients in Response to Immunotherapy.Cancers (Basel). 2021 Oct 28;13(21):5411. doi: 10.3390/cancers13215411. Cancers (Basel). 2021. PMID: 34771574 Free PMC article.
-
Double-sided niche regulation in skin stem cell and cancer: mechanisms and clinical applications.Mol Cancer. 2025 May 21;24(1):147. doi: 10.1186/s12943-025-02289-8. Mol Cancer. 2025. PMID: 40399946 Free PMC article. Review.
References
-
- Moon RT, Kohn AD, De Ferrari GV, Kaykas A. Wnt and b-catenin signalling: diseases and therapies. Nat Rev Genet. 2004;5:691–701. - PubMed
-
- Morin PJ, Sparks AB, Korinek V, Barker N, Clevers H, Vogelstein B, Kinzler KW. Activation of beta-catenin-Tcf signaling in colon cancer by mutations in beta-catenin or APC. Science. 1997;275:1787–1790. - PubMed
-
- Robinson DR, Zylstra CR, Williams BO. Wnt signaling and prostate cancer. Curr Drug Targets. 2008;9:571–580. - PubMed
MeSH terms
Substances
LinkOut - more resources
Full Text Sources
Other Literature Sources
Medical
Miscellaneous

