

Transcription Analysis of the Myometrium of Labouring and Non-Labouring Women
- PMID: 27176052
- PMCID: PMC4866706
- DOI: 10.1371/journal.pone.0155413
Transcription Analysis of the Myometrium of Labouring and Non-Labouring Women
Abstract
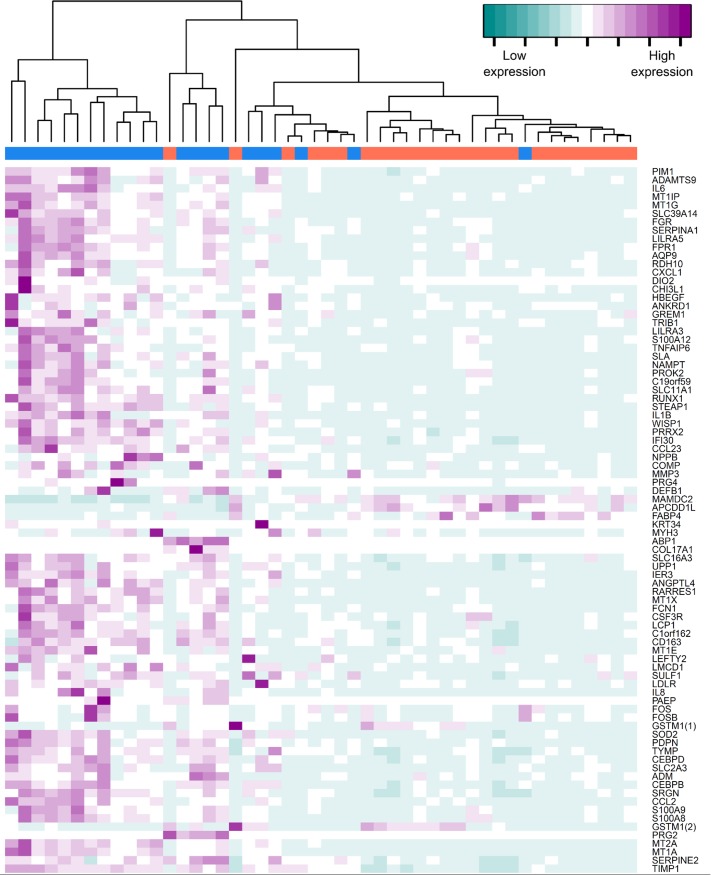
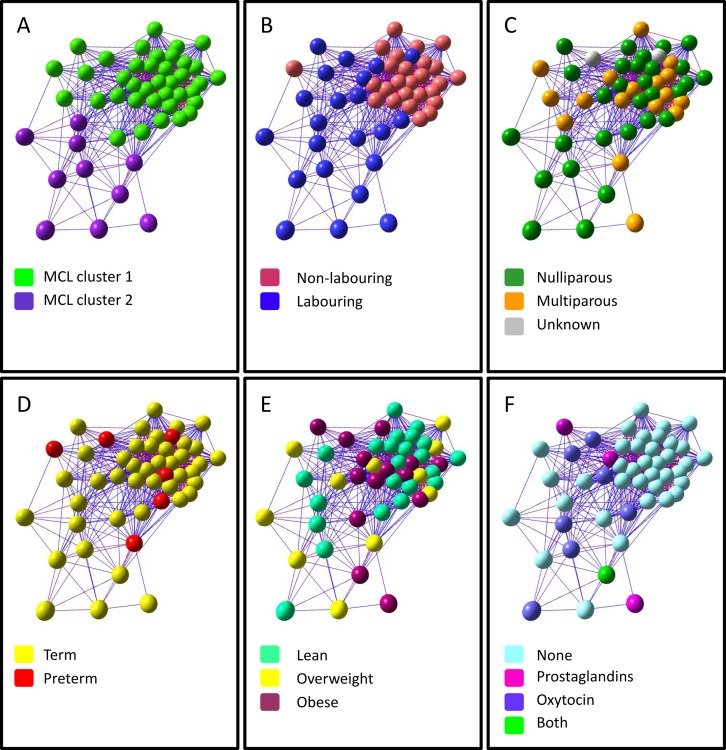
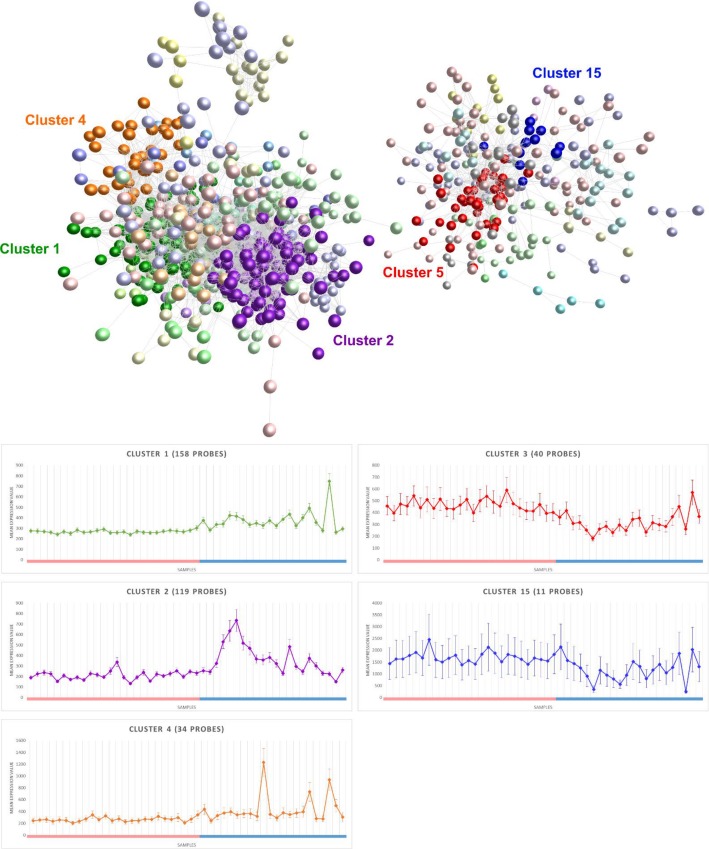
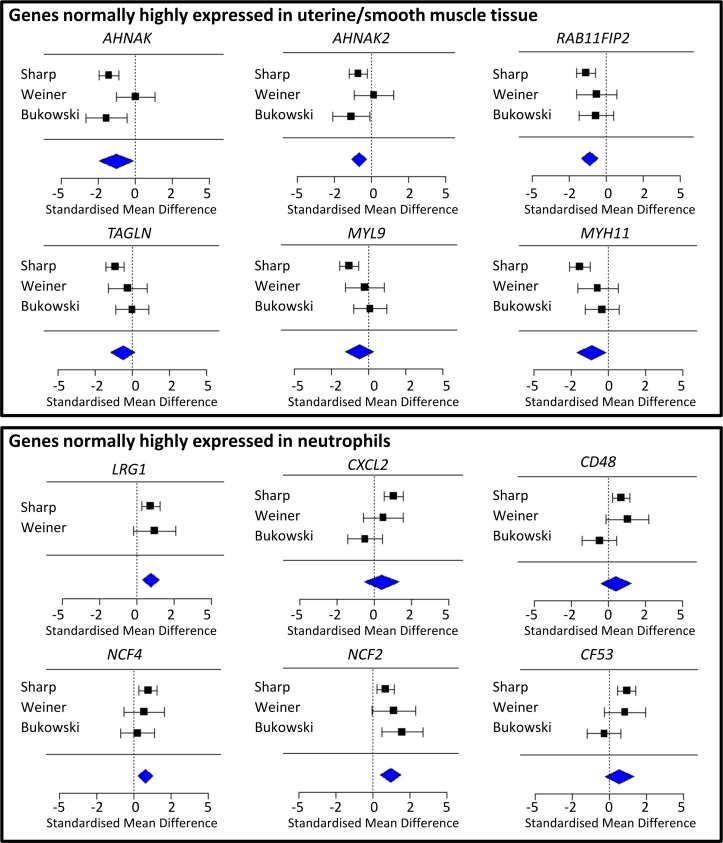
An incomplete understanding of the molecular mechanisms that initiate normal human labour at term seriously hampers the development of effective ways to predict, prevent and treat disorders such as preterm labour. Appropriate analysis of large microarray experiments that compare gene expression in non-labouring and labouring gestational tissues is necessary to help bridge these gaps in our knowledge. In this work, gene expression in 48 (22 labouring, 26 non-labouring) lower-segment myometrial samples collected at Caesarean section were analysed using Illumina HT-12 v4.0 BeadChips. Normalised data were compared between labouring and non-labouring groups using traditional statistical methods and a novel network graph approach. We sought technical validation with quantitative real-time PCR, and biological replication through inverse variance-weighted meta-analysis with published microarray data. We have extended the list of genes suggested to be associated with labour: Compared to non-labouring samples, labouring samples showed apparent higher expression at 960 probes (949 genes) and apparent lower expression at 801 probes (789 genes) (absolute fold change ≥1.2, rank product percentage of false positive value (RP-PFP) <0.05). Although half of the women in the labouring group had received pharmaceutical treatment to induce or augment labour, sensitivity analysis suggested that this did not confound our results. In agreement with previous studies, functional analysis suggested that labour was characterised by an increase in the expression of inflammatory genes and network analysis suggested a strong neutrophil signature. Our analysis also suggested that labour is characterised by a decrease in the expression of muscle-specific processes, which has not been explicitly discussed previously. We validated these findings through the first formal meta-analysis of raw data from previous experiments and we hypothesise that this represents a change in the composition of myometrial tissue at labour. Further work will be necessary to reveal whether these results are solely due to leukocyte infiltration into the myometrium as a mechanism initiating labour, or in addition whether they also represent gene changes in the myocytes themselves. We have made all our data available at www.ebi.ac.uk/arrayexpress/ (accession number E-MTAB-3136) to facilitate progression of this work.
Conflict of interest statement
Figures
Similar articles
-
Labour classified by cervical dilatation & fetal membrane rupture demonstrates differential impact on RNA-seq data for human myometrium tissues.PLoS One. 2021 Nov 19;16(11):e0260119. doi: 10.1371/journal.pone.0260119. eCollection 2021. PLoS One. 2021. PMID: 34797869 Free PMC article.
-
A20, an essential component of the ubiquitin-editing protein complex, is a negative regulator of inflammation in human myometrium and foetal membranes.Mol Hum Reprod. 2017 Sep 1;23(9):628-645. doi: 10.1093/molehr/gax041. Mol Hum Reprod. 2017. PMID: 28911210
-
Immune cell and transcriptomic analysis of the human decidua in term and preterm parturition.Mol Hum Reprod. 2017 Oct 1;23(10):708-724. doi: 10.1093/molehr/gax038. Mol Hum Reprod. 2017. PMID: 28962035 Free PMC article.
-
Integration of endocrine and mechanical signals in the regulation of myometrial functions during pregnancy and labour.Eur J Obstet Gynecol Reprod Biol. 2009 May;144 Suppl 1:S2-10. doi: 10.1016/j.ejogrb.2009.02.044. Epub 2009 Mar 18. Eur J Obstet Gynecol Reprod Biol. 2009. PMID: 19299064 Review.
-
Myometrial activation: Novel concepts underlying labor.Placenta. 2020 Mar;92:28-36. doi: 10.1016/j.placenta.2020.02.005. Epub 2020 Feb 4. Placenta. 2020. PMID: 32056784 Review.
Cited by
-
TBX2, a Novel Regulator of Labour.Medicina (Kaunas). 2021 May 21;57(6):515. doi: 10.3390/medicina57060515. Medicina (Kaunas). 2021. PMID: 34064060 Free PMC article.
-
Labour classified by cervical dilatation & fetal membrane rupture demonstrates differential impact on RNA-seq data for human myometrium tissues.PLoS One. 2021 Nov 19;16(11):e0260119. doi: 10.1371/journal.pone.0260119. eCollection 2021. PLoS One. 2021. PMID: 34797869 Free PMC article.
-
Increased expression of toll-like receptors 2 and 9 is associated with reduced DNA methylation in spontaneous preterm labor.J Reprod Immunol. 2017 Jun;121:35-41. doi: 10.1016/j.jri.2017.05.003. Epub 2017 Jun 3. J Reprod Immunol. 2017. PMID: 28622534 Free PMC article.
-
Pregnancy-specific transcriptional changes upon endotoxin exposure in mice.J Perinat Med. 2020 Sep 25;48(7):700-722. doi: 10.1515/jpm-2020-0159. J Perinat Med. 2020. PMID: 32866128 Free PMC article.
-
Multiple pregnancies, the myometrium and the role of mechanical factors in the timing of labour.Curr Res Physiol. 2023 Aug 24;6:100105. doi: 10.1016/j.crphys.2023.100105. eCollection 2023. Curr Res Physiol. 2023. PMID: 38107788 Free PMC article.
References
-
- Berkowitz GS, Papiernik E (1993) Epidemiology of preterm birth. Epidemiol Rev 15: 414–443. - PubMed
Publication types
MeSH terms
Grants and funding
LinkOut - more resources
Full Text Sources
Other Literature Sources
Medical
