. 2016 May 12:7:11320.
doi: 10.1038/ncomms11320.

A human genome-wide loss-of-function screen identifies effective chikungunya antiviral drugs

Affiliations

A human genome-wide loss-of-function screen identifies effective chikungunya antiviral drugs

Alexander Karlas et al. Nat Commun. .

Abstract

Chikungunya virus (CHIKV) is a globally spreading alphavirus against which there is no commercially available vaccine or therapy. Here we use a genome-wide siRNA screen to identify 156 proviral and 41 antiviral host factors affecting CHIKV replication. We analyse the cellular pathways in which human proviral genes are involved and identify druggable targets. Twenty-one small-molecule inhibitors, some of which are FDA approved, targeting six proviral factors or pathways, have high antiviral activity in vitro, with low toxicity. Three identified inhibitors have prophylactic antiviral effects in mouse models of chikungunya infection. Two of them, the calmodulin inhibitor pimozide and the fatty acid synthesis inhibitor TOFA, have a therapeutic effect in vivo when combined. These results demonstrate the value of loss-of-function screening and pathway analysis for the rational identification of small molecules with therapeutic potential and pave the way for the development of new, host-directed, antiviral agents.


Figures

Figure 1
Figure 1. Primary screen for CHIKV host cell factors.
(a) Outline of screening procedure. (b) Heatmap of all identified proviral and antiviral hits showing replication data (Z-scores) of the four most efficient siRNAs. Arrowheads indicate genes experimentally characterized in this study. (c) Requirement of identified proviral factors for other viruses based on published loss-of-function studies. Viruses other than CHIKV are indicated by specific colours, and colour-coded boxes contain genes shared between CHIKV and the corresponding virus. White boxes contain genes shared between CHIKV and more than one other virus. Full details in Supplementary Data 3. (d) Heatmap illustrating the replication capability of CHIKV in Cas9-positive HEK-293T cells expressing the indicated gRNAs. Cells were infected with CHIK-GFP at MOI 6 for 24 h (n=9). (e) Validation of CLK1 as CHIKV relevant host factor. Infection rate of A549 cells depleted for CLK1 by CRISPR/Cas9 (see Supplementary Fig. 1j for more details) and infected with CHIKV-GFP for the indicated periods of time (n=9 for each data set). Data represent the means±s.e.m. of three independent experiments and were analysed using one-way analysis of variance with Tukey's post test. (*P<0.05; NSP≥0.05). CTRL, control; NS, not significant.
Figure 2
Figure 2. Screening results analysis.
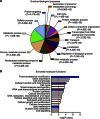
(a,b) PANTHER (http://www.pantherdb.org/) and Ingenuity (www.ingenuity.com) gene ontology (GO) analysis for enrichment of certain categories in the context of biological processes or molecular functions, respectively. See Supplementary Fig. 2 for a graphical illustration of some pathways included in the GO terms labelled in blue in b.
Figure 3
Figure 3. Fatty acid synthesis requirement for CHIKV life cycle.
(a) Impact of FASN or ACLY knockdown on CHIKV replication. Closed and open symbols indicate replicates from the primary screen and during validation, respectively. (b) Western blot showing silencing efficiency of siRNAs used in c. (c) Impact of FASN-, ACC- and ACLY-specific siRNAs on CHIKV replication (n=10 for each data set). (d) Confocal section of CHIKV replicon-infected HeLa cells labelled for FASN, dsRNA and 4,6-diamidino-2-phenylindole (DAPI; blue). Scale bar, 10 μm. (e) Co-localization analysis of cells labelled as in d and in Supplementary Fig. 3b, plotted as Pearson's coefficient per cell. Each symbol corresponds to a cell stack from three independent experiments (n=29 cells for FASN, 30 cells for ACC and 31 cells for ACLY); median values shown in red. (f) Effect of FASN (cerulenin, n=12 for each data set), ACC (TOFA, n=11 for each data set) and ACLY (BMS-303141 n=11 for each data set) inhibitors on CHIKV replication. (g) Real-time cell toxicity assay performed on HeLa cells (n=3 for each point). Excepted for b and d where representative images are shown and for g where the mean±s.d. is shown for each point of a representative experiment, all data represent the means±s.e.m. of three independent experiments analysed using one-way analysis of variance with Tukey's post test (*P<0.05; **P<0.01; ***P<0.001; NSP≥0.05). NS, not significant.
Figure 4
Figure 4. Effect of the identified antiviral drugs on different classes of viruses.
Dose–response curves (coloured solid lines) performed on HEK-293 cells or A549 cells (in case of IAV infection), pretreated for 2 h with the indicated drugs and then infected with distant classes of viruses. Black solid lines and coloured dashed lines indicate the corresponding dose–response curves determined for cell viability and CHIKV infection, respectively (Table 1; Supplementary Fig. 4). Data were obtained from the combination of at least two independent experiments (n is indicated in each panel) and are depicted as mean±s.e.m. for each point.
Figure 5
Figure 5. In vitro validation of selected chemical inhibitors and proviral factors.
(ag) Infection rate and cell viability for compounds specific to vATPase (bafilomycin, n=12, 6, 12 and 6 for all conditions at increasing concentrations), calmodulin (pimozide, n=12, 12, 12 and 9 for all conditions at increasing concentrations and W7, n=9 for all data sets), fatty acid synthesis (cerulenin, n=9, 6, 6 and 9 for all conditions at increasing concentrations), FLT4 (tivozanib, n=12, 6, 9 and 12 for all conditions at increasing concentrations) and KAT5 (anacardic acid, n=9 for all data sets) administrated to CHIKV-infected HEK-293T cells as indicated. Cells were treated 2 h before (solid lines) or 2 h after (dashed lines) infection with CHIKV C21 (MOI 40) and left until 8 h p.i. to avoid multiple cycles of infection. Viral infectivity and cell viability were then measured by flow cytometry after intracellular staining of CHIKV capsid (CHIKV-C, see a for an example). Equal amounts of supernatants from the 2 h post treatment conditions were measured for viral infectivity on Vero cells (dotted lines) to detect eventual defects in viral release. (h,i) Quantitative PCR with reverse transcription quantification of cell- (n=20, 9, 9, 12, 12 and 9 in displayed order) (h) and supernatant-associated (n=18, 6, 6, 12, 12 and 9 in displayed order) (i) vRNA performed on RNA extracts of HeLa cells infected with CHIKV C21 (MOI: 50) for 1 h and treated with cerulenin (50 μM), TOFA (25 μM), pimozide (pimo, 10 μM), W7 (20 μM), tivozanib (tivo, 5 μM) or vehicle alone for an additional 7 h. (j) Cell viability measured at the end of the experiment shown in h, using the CellTiter-Glo kit (n=9 for all data sets). (k,l) Cell- and supernatant-associated vRNA measured on CHIKV-infected HeLa cells treated with the indicated drugs from 6 to 8 h p.i. (n=18, 9, 8, 9, 9 and 9 for m and n=18, 9, 9, 9, 9 and 9 for n in displayed order). Data represent mean+s.e.m. of at least three independent experiments, analysed by one-way analysis of variance with Tukey's post test (***P<0.001; NSP≥0.05).
Figure 6
Figure 6. In vivo validation of selected chemical inhibitors and proviral factors.
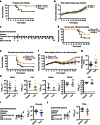
(a,b) Health status and body weight evolution in 9-day-old C57BL/6clk1−/− or C57BL/6clk1+/+ mice infected intradermally with CHIKV C21 (104 PFU) and killed at the appearance of paralysis. (c) Experimental design of the intradermal infection of the young mouse model used for tivozanib. (df) Effect of daily tivozanib (tivo) treatment on C57BL/6 mouse survival, paralysis and body weight change in response to CHIKV C21 infection. (g) Health status of each mouse with paralysis, estimated by measuring the area under the body weight curve. (h) CHIKV viral load measured 3 days post infection in the indicated organs obtained from mice treated with tivozanib as in c (n=9 for all data sets). (i,j) Experimental design of the footpad infection of adult mice model used and viral titres measured in C57BL/6 mice treated with pimozide (pimo, per os, n=15 for both data sets) or TOFA (i.p., n=11 for both data sets) or the corresponding vehicles before infection with CHIKV C21 (103 PFU). Data in b,f and g represented as the mean±s.e.m.; in h,i and j as the median±interquartile range; each dot represents one mouse. All data obtained from at least two independent experiments. Statistics were calculated using Log-rank (Mantel–Cox) test in a,d and e, two-sided t-test for two independent samples in g and Mann–Whitney test in h,i and j, (*P<0.05; NSP≥0.05). AUC, area under curve; d, days; i.p., intraperitoneal; NS, not significant.
Figure 7
Figure 7. Impact of pimozide and TOFA combination on CHIKV replication in vitro and in vivo.
(ac) Infection rate (n=9 for all data sets at increasing concentrations; n=51 for DMSO) (a), supernatant titration (n=8 for all data sets at increasing concentrations; n=57 for DMSO) (b) and cell viability (c) of HEK-293T cells infected with CHIKV-GFP (MOI: 0.5) for 1 h, and then exposed to the indicated concentrations of antiviral drugs for 23 h. Solid and dashed black lines indicate the mean±s.e.m. of the DMSO control (pimo=pimozide). Data in a and c were measured by flow cytometry. (d) Experimental design of the footpad CHIKV infection model of adult mice used to measure the therapeutic effect on CHIKV replication of pimozide, TOFA or their combination (n=13 for all data set, one outlier for pimo is not shown in the graph but was considered for statistics). (e) Footpad swelling measured 4 days post infection in mice treated as in d (n=11, 10, 12 and 12 in displayed order). The experiment shown in e was repeated twice. All the other data were obtained from at least three independent experiments. Data in a,b and c are expressed as the mean±s.e.m. and in d and e are shown as the median±interquartile range; each dot represents one mouse. Statistics were calculated using the Kruskal–Wallis test with the Dunn's post test (*P<0.05; NSP≥0.05) NS, not significant.

Similar articles

Cited by

References

    1. Weaver S. C. & Lecuit M. Chikungunya virus and the global spread of a mosquito-borne disease. New Engl. J. Med. 372, 1231–1239 (2015). - PubMed
    1. Bekerman E. & Einav S. Infectious disease. Combating emerging viral threats. Science 348, 282–283 (2015). - PMC - PubMed
    1. De Clercq E. The design of drugs for HIV and HCV. Nat. Rev. Drug Discov. 6, 1001–1018 (2007). - PubMed
    1. Scheel T. K. & Rice C. M. Understanding the hepatitis C virus life cycle paves the way for highly effective therapies. Nat. Med. 19, 837–849 (2013). - PMC - PubMed
    1. Lanford R. E. et al.. Therapeutic silencing of microRNA-122 in primates with chronic hepatitis C virus infection. Science 327, 198–201 (2010). - PMC - PubMed

Publication types

MeSH terms