

Trends in Mortality Disparities by Area-Based Poverty in New York City, 1990-2010
- PMID: 27177681
- PMCID: PMC4899332
- DOI: 10.1007/s11524-016-0048-7
Trends in Mortality Disparities by Area-Based Poverty in New York City, 1990-2010
Abstract
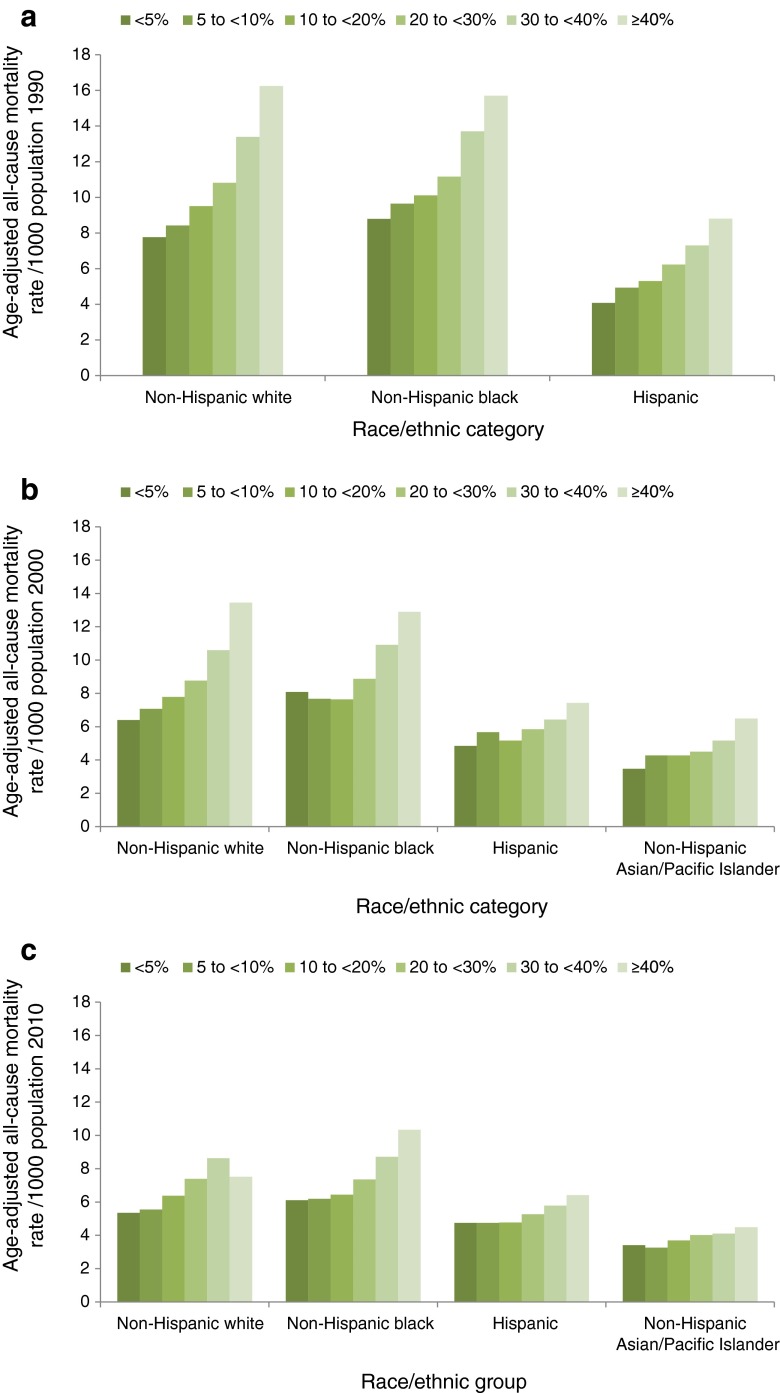
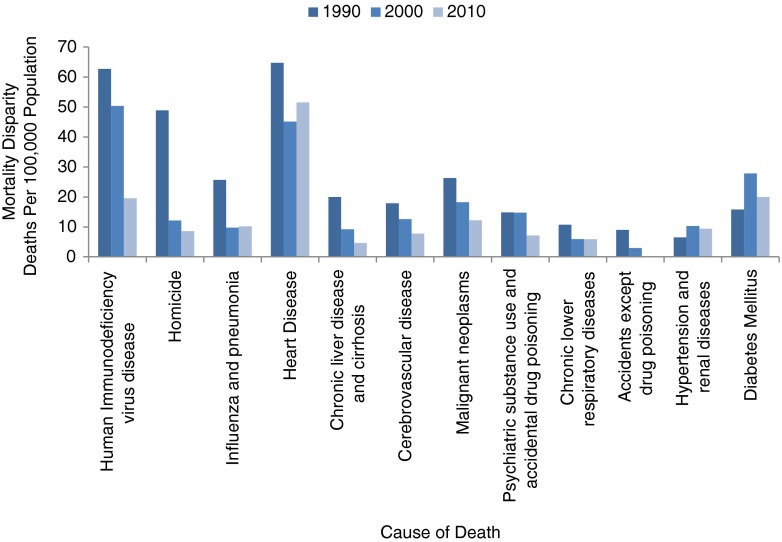
Residing in a high-poverty area has consistently been associated with higher mortality rates, but the association between poverty and mortality can change over time. We examine the association between neighborhood poverty and mortality in New York City (NYC) during 1990-2010 to document mortality disparity changes over time and determine causes of death for which disparities are greatest. We used NYC and New York state mortality data for years 1990, 2000, and 2010 to calculate all-cause and cause-specific age-adjusted death rates (AADRs) by census tract poverty (CTP), which is the proportion of persons in a census tract living below the federal poverty threshold. We calculated mortality disparities, measured as the difference in AADR between the lowest and highest CTP groups, within and across race/ethnicity, nativity, and sex categories by year. We observed higher all-cause AADRs with higher CTP for each year for all race/ethnicities, both sexes, and US-born persons. Mortality disparities decreased progressively during 1990-2010 for the NYC population overall, for each race/ethnic group, and for the majority of causes of death. The overall mortality disparity between the highest and lowest CTP groups during 2010 was 2.55 deaths/1000 population. The largest contributors to mortality disparities were heart disease (51.52 deaths/100,000 population), human immunodeficiency virus (19.96/100,000 population), and diabetes (19.59/100,000 population). We show that progress was made in narrowing socioeconomic disparities in mortality during 1990-2010, but substantial disparities remain. Future efforts toward achieving health equity in NYC mortality should focus on areas contributing most to disparities.
Keywords: Ethnic groups; Geography; Mortality; Poverty; Socioeconomic factors.
Figures
References
-
- U.S. Department of Health and Human Services (HHS), Office of Disease Prevention and Health Promotion. Healthy People 2020. Washington, DC: HHS; 2015. Available at: http://www.healthypeople.gov/2020/about/foundation-health-measures/Dispa.... Accessed July 10, 2015
-
- Karpati A, Kerker B, Mostashari F, et al. Health disparities in New York City. New York, NY: New York City Department of Health and Mental Hygiene; 2004. Available at: http://www.nyc.gov/html/doh/downloads/pdf/epi/disparities-2004.pdf. Accessed July 10, 2015
-
- Zimmerman R, Li W, Lee E, et al. Summary of vital statistics, 2013: mortality. New York, NY: New York City Department of Health and Mental Hygiene, Office of Vital Statistics; 2015. Available at: http://www.nyc.gov/html/doh/html/data/vs-summary.shtml. Accessed July 10, 2015
-
- Toprani A, Hadler JL. Selecting and applying a standard area-based socioeconomic status measure for public health data: analysis for New York City. New York, NY: New York City Department of Health and Mental Hygiene: Epi Research Report; 2013. Available at: http://www.nyc.gov/html/doh/downloads/pdf/epi/epiresearch-SES-measure.pdf. Accessed July 10, 2015.
MeSH terms
LinkOut - more resources
Full Text Sources
Other Literature Sources
