. 2016 Oct;64(4):1105-20.
doi: 10.1002/hep.28637. Epub 2016 Jun 11.

Hepatocellular carcinoma repression by TNFα-mediated synergistic lethal effect of mitosis defect-induced senescence and cell death sensitization

Affiliations

Hepatocellular carcinoma repression by TNFα-mediated synergistic lethal effect of mitosis defect-induced senescence and cell death sensitization

Dan Li et al. Hepatology. 2016 Oct.

Abstract

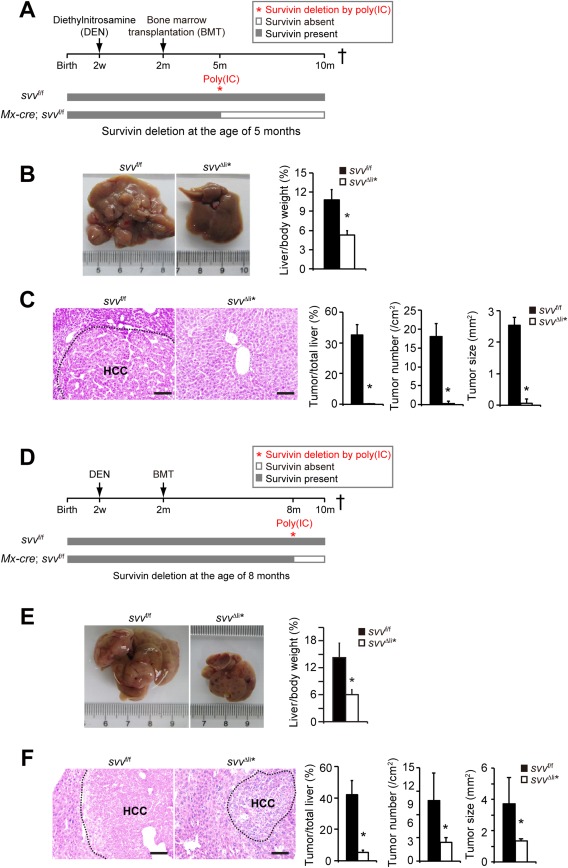
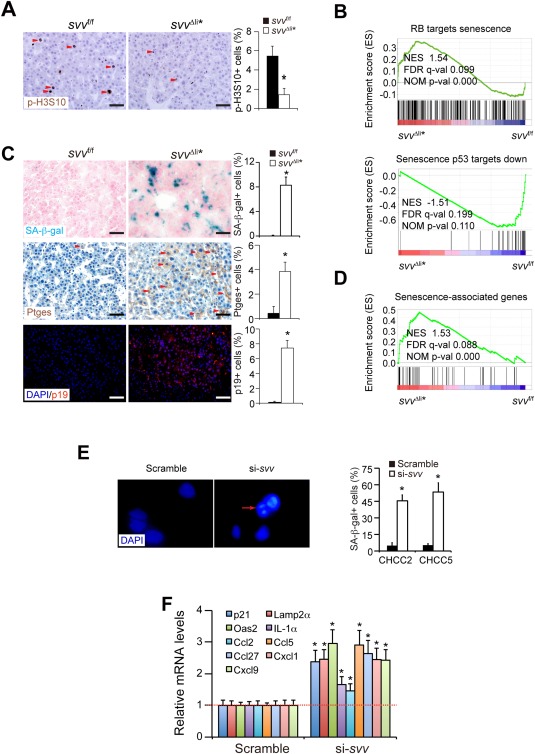
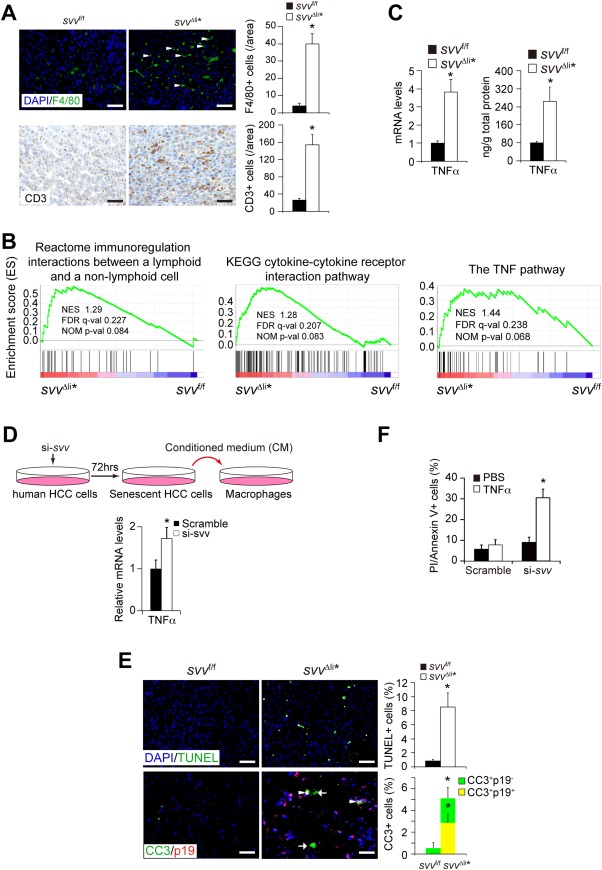
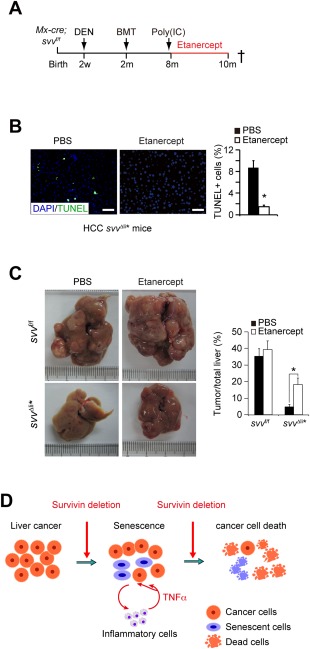
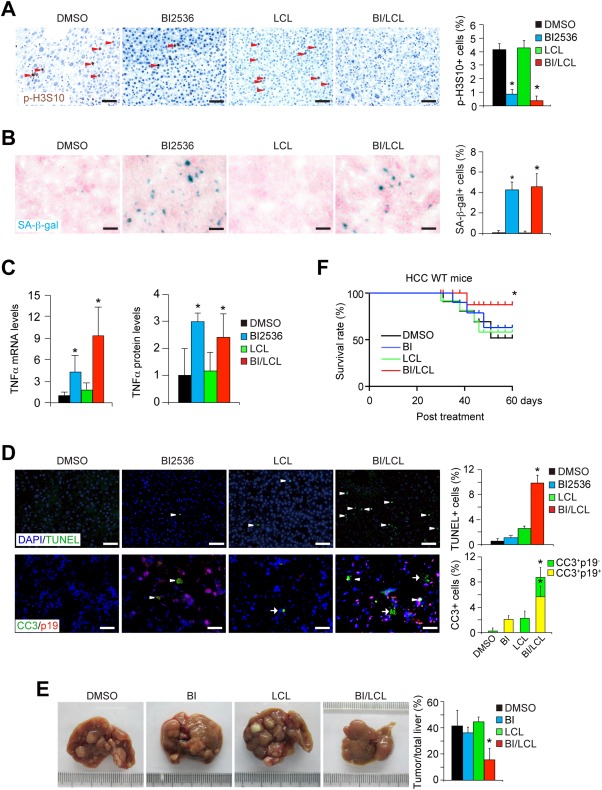
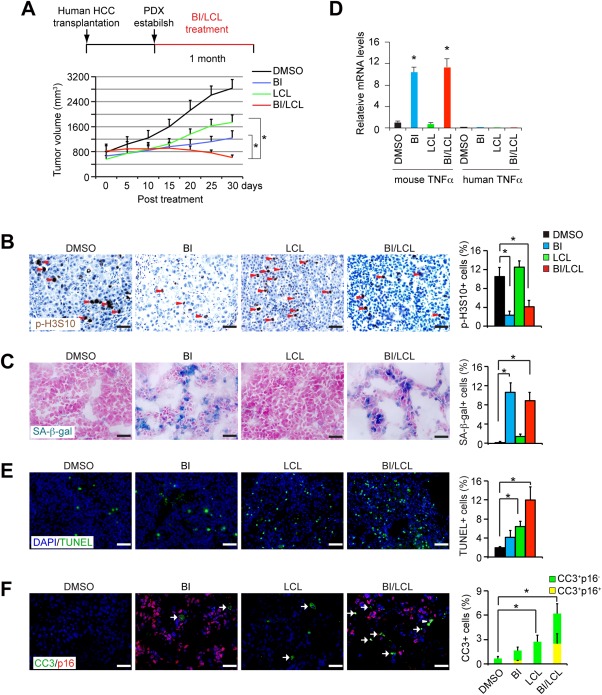
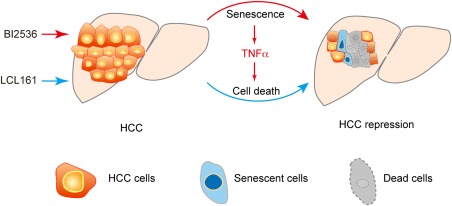
Hepatocellular carcinoma (HCC) is a cancer lacking effective therapies. Several measures have been proposed to treat HCCs, such as senescence induction, mitotic inhibition, and cell death promotion. However, data from other cancers suggest that single use of these approaches may not be effective. Here, by genetic targeting of Survivin, an inhibitor of apoptosis protein (IAP) that plays dual roles in mitosis and cell survival, we identified a tumor necrosis factor alpha (TNFα)-mediated synergistic lethal effect between senescence and apoptosis sensitization in malignant HCCs. Survivin deficiency results in mitosis defect-associated senescence in HCC cells, which triggers local inflammation and increased TNFα. Survivin inactivation also sensitizes HCC cells to TNFα-triggered cell death, which leads to marked HCC regression. Based on these findings, we designed a combination treatment using mitosis inhibitor and proapoptosis compounds. This treatment recapitulates the therapeutic effect of Survivin deletion and effectively eliminates HCCs, thus representing a potential strategy for HCC therapy.

Conclusion: Survivin ablation dramatically suppresses human and mouse HCCs by triggering senescence-associated TNFα and sensitizing HCC cells to TNFα-induced cell death. Combined use of mitotic inhibitor and second mitochondrial-derived activator of caspases mimetic can induce senescence-associated TNFα and enhance TNFα-induced cell death and synergistically eliminate HCC. (Hepatology 2016;64:1105-1120).


Figures

Figure 1
Figure 1
Survivin is essential in HCC development. (A) Experimental design for the DEN‐induced HCC model. Mx‐cre; svv f/f and svv f/f control mice were treated with DEN at 2 weeks of age and γ‐irradiated, followed by transplantation with bone marrows from svv f/f mice at the age of 2 months. No HCCs were detectable at the time of bone marrow transplantation. Five‐month‐old Mx‐cre; svv f/f and control mice were injected with poly(IC) intraperitoneally to induce liver‐specific Survivin gene depletion. Mx‐cre; svv f/f mice were referred to as svv Δli* after poly(IC)‐induced depletion of Survivin. All mice were sacrificed for HCC analysis at the age of 10 months. (B,C) DEN‐induced HCCs were analyzed in svv Δli* and svv f/f mice 5 months after poly(IC) treatment. (B) Liver/body weight ratios were measured. n = 5 for svv f/f mice; n = 6 for svv Δli* mice. (C) Hematoxylin and eosin (H&E) staining of liver sections. HCC was encircled with a dashed line. HCCs were quantified. n = 5 for svv f/f mice; n = 5 for svv Δli* mice. (D) Similar treatment as described in (A) was applied to Mx‐cre; svv f/f and svv f/f mice. However, Survivin was depleted with poly(IC) in Mx‐cre; svv f/f mice at the age of 8 months. (E,F) DEN‐induced HCC was analyzed in svv Δli* mice at the age of 10 months. (E) Liver/body weight ratios were measured. n = 7 for svv f/f mice; n = 5 for svv Δli* mice. (F) H&E staining of liver sections. HCCs were encircled with dashed lines, and HCCs were quantified. n = 5 for svv f/f mice; n = 5 for svv Δli* mice. Scale bars, 100 μm. * P < 0.05, t test.
Figure 2
Figure 2
Survivin deficiency induces a mitosis defect and cellular senescence. (A) Mitotic HCC cells were analyzed by immunohistochemical staining for phosphorylated H3S10 (p‐H3S10). HCCs were harvested 1 week after poly(IC)‐induced Survivin depletion. (B) GSEA analysis showed that the expression profile of RB‐related senescence and p53‐related senescence were enriched in svv Δli* liver cancers. (C) SA‐β‐gal staining (blue) on cryosections of HCCs from svv Δli* mice 1 week after polyIC treatment. SA‐β‐gal‐positive HCC cells were quantified. Cancer cells expressing senescence marker genes Ptges and p19Arf were determined by immune staining on paraffin sections. Arrowheads indicate Ptges‐positive cancer cells. Quantification of Ptges‐ and p19Arf‐positive cancer cells are shown. n = 4 for each group for (A) and (C). (D) GSEA of expression profiles of senescence‐associated genes in DEN‐induced HCCs from svv f/f and svv Δli* mice 1 week after poly(IC) treatment. Senescence‐associated genes were taken from the study of Pribluda et al.28 (E) Two primary human HCC cells were transfected with Survivin‐specific siRNAs to silence Survivin. SAHFs were characterized by DAPI‐DNA staining. SAHF are indicated by arrows. SA‐β‐gal‐positive cells were quantified 72 hours after siRNA transfection. All results represent three independent experiments. * P < 0.05, t test. (F) qPCR analysis of senescence‐associated genes in Survivin‐silenced human HCC cells. Results represent three independent experiments. Scale bars, 50 μm. * P < 0.05, t test. Abbreviations: DAPI, 4′,6‐diamidino‐2‐phenylindole; FDR, false discovery rate; NES, normalized enrichment score; NOM, nominal.
Figure 3
Figure 3
Survivin deficiency induces senescence‐associated inflammation and TNFα expression. (A) Immunofluorescent staining of F4/80 and CD3 showed increased infiltration of macrophages and T cells, respectively, in svv Δli* liver cancers. F4/80‐positive and CD3‐positive cells were quantified. n = 4 for each group. (B) GSEA analysis showed enrichment of inflammation pathway and the TNFα pathway genes in svv Δli* liver cancers. (C) TNFα mRNA and protein levels in svv Δli* HCCs were determined by qPCR and enzyme‐linked immunosorbent assay. n = 4 for each group. (D) Conditioned medium of senescent human HCC cells stimulates THP1‐derived macrophages to secret TNFα. Human HCC cells were induced to be senescent by siRNA against Survivin. Conditioned medium from senescent culture were collected at 72 hours. THP‐1‐derived macrophages were cultured with conditioned medium of senescent HCC cells for another 24 hours. mRNA levels of TNFα were analyzed by qPCR. Results represent two independent experiments. * P < 0.05, t test. (E) Cell death was detected by TUNEL staining in HCCs 1 week after poly(IC) treatment. TUNEL‐positive cancer cells were quantified. n = 4 for each group. Costaining of cleaved caspase 3 (CC3; for dead cells) and p19Arf (p19; for senescent cells) on HCCs 1 week after poly(IC) treatment. CC3‐positive p19Arf‐negative cells are indicated by arrows. CC3‐positive p19Arf‐positive cancer cells are indicated by arrowheads. Quantification of CC3‐positive and p19Arf‐positive cells showed both senescent and neighboring nonsenescent cells undergoing cell death. n = 3 for each group. (F) Two primary human HCC cells were transfected with siRNAs against Survivin and then treated with 10ng/mL of human TNFα (hTNFα) to induce cell death. Dead cells were stained by propidium iodide and Annexin V and then analyzed by fluorescence‐activated cell sorting. Results represent three independent experiments. Abbreviations: DAPI, 4′,6‐diamidino‐2‐phenylindole; FDR, false discovery rate; KEGG, Kyoto Encyclopedia of Genes and Genomes; NES, normalized enrichment score; NOM, nominal; PBS, phosphate‐buffered saline.
Figure 4
Figure 4
Survivin protects HCC cells from inflammatory TNFα‐mediated cell death. (A) Experimental scheme of etanercept treatment. Survivin was deleted in HCC‐bearing Mx‐cre; svv f/f at the age of 8 months. These mice were then treated with etanercept at 10 mg/kg body weight intraperitoneally twice a week. (B) Cell death in svv Δli* HCCs was dramatically reduced after etanercept treatment for 1 week as determined by TUNEL staining. (C) HCC development was analyzed in svv Δli* mice after etanercept treatment. HCCs were quantified. n = 3 for each group. * P < 0.05, t test. (D) Schematic of TNFα‐mediated synergistic lethal effect of senescence and apoptosis sensitization; Survivin depletion induced impaired mitosis and senescence in cancer cells, whereas infiltration of inflammatory cells and senescence‐associated TNFα triggered cell death in senescent and neighboring nonsenescent cancer cells lacking Survivin. Abbreviations: BMT, bone marrow transplantation; DAPI, 4′,6‐diamidino‐2‐phenylindole; PBS, phosphate‐buffered saline.
Figure 5
Figure 5
Regression of HCCs by combined treatment with mitotic inhibitor and SMAC mimetic. (A,B) HCCs were induced in wild‐type mice at the age of 2 weeks:. 25 mg/kg body weight BI2536 (BI), LCL161 (LCL) alone, or combination with BI2536 and LCL161 (BI/LCL) were injected into cancer‐bearing mice every other day at the age of 8 months. Mitosis and senescence in HCCs were characterized 2 weeks after BI2536 treatment. Mitosis of HCC cells was analyzed by p‐H3S10 immunohistochemical staining. p‐H3S10‐positive cancer cells were quantified (A). n = 4 for each group. SA‐β‐gal staining showed increased senescence in BI2536‐treated or BI/LCL combined‐treated HCCs. SA‐β‐gal‐positive HCC cells were quantified (B). (C) TNFα mRNA and protein levels in HCCs from mice treated by BI2536, LCL161 alone, or BI/LCL combination for 2 weeks were determined by qPCR and enzyme‐linked immunosorbent assay. n = 4 for each group. (D) Cell death was determined by TUNEL staining of HCCs 2 weeks after treatment. Positively stained cancer cells were quantified. Cleaved caspase 3 (CC3) and p19Arf were costained on HCC sections. CC3‐positive p19Arf‐negative cells are indicated by arrows. CC3‐positive p19Arf‐positive cancer cells are indicated by arrowheads. CC3‐positive cells and p19Arf‐positive cells were quantified. n = 3 for each group. (E) Therapeutic effects were monitored and HCCs were quantified after 2 months after BI2536, LCL161 alone, or BI/LCL combination treatment. n = 5 for DMSO group; n = 4 for BI group; n = 4 for LCL group; n = 5 for BI/LCL group. (F) Kaplan‐Meier survival analysis showed that combined treatment of BI2536 and LCL161 significantly improved the survival of HCC‐bearing mice (log‐rank test, P < 0.01). n = 11 for DMSO group; n = 10 for BI2536 group; n = 7 for LCL group; n = 12 for BI/LCL group. * P < 0.05, t test. Abbreviations: DAPI, 4′,6‐diamidino‐2‐phenylindole; DMSO, dimethyl sulfoxide.
Figure 6
Figure 6
Mitotic inhibitor and SMAC mimetic synergistically eliminate human PDX HCCs. (A) PDX HCCs developed in athymic nude mice and treated with BI2536 and LCL161 alone or combined for 1 month. For each experimental group, we transplanted 5 human HCCs with 2 PDX tumors for each HCC. Growth of the PDX HCC was monitored during combination treatment with BI2536 (25 mg/kg) and LCL161 (25 mg/kg) for 1 month. n = 10 for each group. (B,C) Cell mitosis and senescence in PDX cancers were determined by p‐H3S10 (B) and SA‐β‐gal (C) staining, respectively. Positively stained cancer cells were quantified. n = 3 for each group. (D) PDX liver cancers were treated with BI2536, LCL161, or combination of BI2536 and LCL161. Species‐specific qPCR was applied to analyzed mouse and human TNFα mRNA levels in PDX cancers. n = 3 for each group. (E) Cell death was determined by TUNEL staining. Positively stained HCC cells were quantified. n = 3 for each group. (F) Cleaved caspase 3 (CC3) and p16 were costained on HCC tissues. CC3‐positive p16‐negative cells are indicated by arrows. CC3‐positive p16‐positive cancer cells are indicated by arrowheads. CC3‐positive cells and p16‐positive cells were quantified. n = 3 for each group. Scale bars, 50 μm. Abbreviations: DAPI, 4′,6‐diamidino‐2‐phenylindole; DMSO, dimethyl sulfoxide.
Figure 7
Figure 7
Proposed therapeutic strategy. Schematic summarization of the proposed HCC therapeutic strategy, which shows that PLK1 inhibitor BI2536 induced mitosis defect and senescence, and the SMAC mimetic, LCL161, sensitized HCC cells to TNFα‐induced cell death. Combined treatment with these two drugs markedly repressed HCC.

References

    1. El‐Serag HB. Hepatocellular carcinoma. N Engl J Med 2011;365:1118‐1127. - PubMed
    1. Llovet JM, Ricci S, Mazzaferro V, Hilgard P, Gane E, Blanc JF, et al. Sorafenib in advanced hepatocellular carcinoma. N Engl J Med 2008;359:378‐390. - PubMed
    1. Michelotti GA, Machado MV, Diehl AM. NAFLD, NASH and liver cancer. Nat Rev Gastroenterol Hepatol 2013;10:656‐665. - PubMed
    1. Forner A, Llovet JM, Bruix J. Hepatocellular carcinoma. Lancet 2012;379:1245‐1255. - PubMed
    1. Kuilman T, Peeper DS. Senescence‐messaging secretome: SMS‐ing cellular stress. Nat Rev Cancer 2009;9:81‐94. - PubMed