

Quantitative mapping of cerebrovascular reactivity using resting-state BOLD fMRI: Validation in healthy adults
- PMID: 27177763
- PMCID: PMC5148619
- DOI: 10.1016/j.neuroimage.2016.05.025
Quantitative mapping of cerebrovascular reactivity using resting-state BOLD fMRI: Validation in healthy adults
Abstract
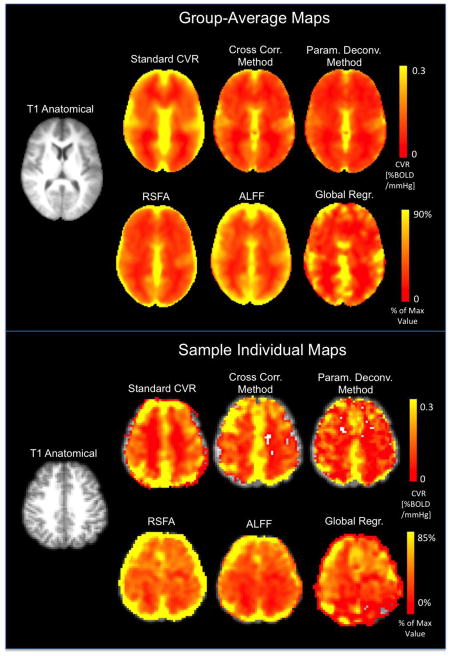
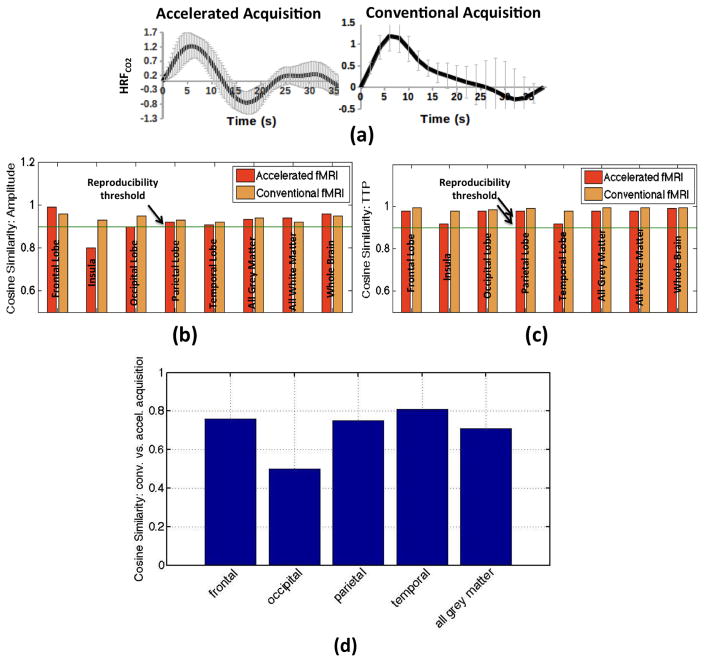
In conventional neuroimaging, cerebrovascular reactivity (CVR) is quantified primarily using the blood-oxygenation level-dependent (BOLD) functional MRI (fMRI) signal, specifically, as the BOLD response to intravascular carbon dioxide (CO2) modulations, in units of [%ΔBOLD/mmHg]. While this method has achieved wide appeal and clinical translation, the tolerability of CO2-related tasks amongst patients and the elderly remains a challenge in more routine and large-scale applications. In this work, we propose an improved method to quantify CVR by exploiting intrinsic fluctuations in CO2 and corresponding changes in the resting-state BOLD signal (rs-qCVR). Our rs-qCVR approach requires simultaneous monitoring of PETCO2, cardiac pulsation and respiratory volume. In 16 healthy adults, we compare our quantitative CVR estimation technique to the prospective CO2-targeting based CVR quantification approach (qCVR, the "standard"). We also compare our rs-CVR to non-quantitative alternatives including the resting-state fluctuation amplitude (RSFA), amplitude of low-frequency fluctuation (ALFF) and global-signal regression. When all subjects were pooled, only RSFA and ALFF were significantly associated with qCVR. However, for characterizing regional CVR variations within each subject, only the PETCO2-based rs-qCVR measure is strongly associated with standard qCVR in 100% of the subjects (p≤0.1). In contrast, for the more qualitative CVR measures, significant within-subject association with qCVR was only achieved in 50-70% of the subjects. Our work establishes the feasibility of extracting quantitative CVR maps using rs-fMRI, opening the possibility of mapping functional connectivity and qCVR simultaneously.
Keywords: Cerebrovascular reactivity; Deconvolution; End-tidal CO(2); Heart-rate variability; Hemodynamic response function; Non-invasive vascular mapping; Respiratory-volume variability; Resting-state fMRI.
Copyright © 2016 Elsevier Inc. All rights reserved.
Figures


Similar articles
-
Comparing end-tidal CO2, respiration volume per time (RVT), and average gray matter signal for mapping cerebrovascular reactivity amplitude and delay with breath-hold task BOLD fMRI.Neuroimage. 2023 May 15;272:120038. doi: 10.1016/j.neuroimage.2023.120038. Epub 2023 Mar 22. Neuroimage. 2023. PMID: 36958618 Free PMC article.
-
Effect sizes of BOLD CVR, resting-state signal fluctuations and time delay measures for the assessment of hemodynamic impairment in carotid occlusion patients.Neuroimage. 2018 Oct 1;179:530-539. doi: 10.1016/j.neuroimage.2018.06.017. Epub 2018 Jun 18. Neuroimage. 2018. PMID: 29913284 Free PMC article.
-
The association between cerebrovascular reactivity and resting-state fMRI functional connectivity in healthy adults: The influence of basal carbon dioxide.Neuroimage. 2016 May 15;132:301-313. doi: 10.1016/j.neuroimage.2016.02.051. Epub 2016 Feb 23. Neuroimage. 2016. PMID: 26908321 Free PMC article.
-
Cerebrovascular reactivity (CVR) MRI with CO2 challenge: A technical review.Neuroimage. 2019 Feb 15;187:104-115. doi: 10.1016/j.neuroimage.2018.03.047. Epub 2018 Mar 21. Neuroimage. 2019. PMID: 29574034 Free PMC article. Review.
-
Resting-state fMRI confounds and cleanup.Neuroimage. 2013 Oct 15;80:349-59. doi: 10.1016/j.neuroimage.2013.04.001. Epub 2013 Apr 6. Neuroimage. 2013. PMID: 23571418 Free PMC article. Review.
Cited by
-
CVR-MRICloud: An online processing tool for CO2-inhalation and resting-state cerebrovascular reactivity (CVR) MRI data.PLoS One. 2022 Sep 28;17(9):e0274220. doi: 10.1371/journal.pone.0274220. eCollection 2022. PLoS One. 2022. PMID: 36170233 Free PMC article.
-
Design and Harmonization Approach for the Multi-Institutional Neurocognitive Discovery Study (MINDS) of Adult Congenital Heart Disease (ACHD) Neuroimaging Ancillary Study: A Technical Note.J Cardiovasc Dev Dis. 2023 Sep 6;10(9):381. doi: 10.3390/jcdd10090381. J Cardiovasc Dev Dis. 2023. PMID: 37754810 Free PMC article.
-
Cortical laminar resting-state signal fluctuations scale with the hypercapnic blood oxygenation level-dependent response.Hum Brain Mapp. 2020 Jun 1;41(8):2014-2027. doi: 10.1002/hbm.24926. Epub 2020 Jan 20. Hum Brain Mapp. 2020. PMID: 31957959 Free PMC article.
-
Resting-state "physiological networks".Neuroimage. 2020 Jun;213:116707. doi: 10.1016/j.neuroimage.2020.116707. Epub 2020 Mar 5. Neuroimage. 2020. PMID: 32145437 Free PMC article.
-
Cerebrovascular Reactivity Mapping Using Resting-State Functional MRI in Patients With Gliomas.J Magn Reson Imaging. 2022 Dec;56(6):1863-1871. doi: 10.1002/jmri.28194. Epub 2022 Apr 9. J Magn Reson Imaging. 2022. PMID: 35396789 Free PMC article.
References
-
- Asghar MS, Hansen AE, Pedersen S, Larsson HB, Ashina M. Pharmacological modulation of the BOLD response: a study of acetazolamide and glyceryl trinitrate in humans. J Magn Reson Imaging. 2011;34:921–927. - PubMed
-
- Bandettini PA, Wong EC. A hypercapnia-based normalization method for improved spatial localization of human brain activation with fMRI. NMR Biomed. 1997;10:197–203. - PubMed
-
- Birn RM, Diamond JB, Smith MA, Bandettini PA. Separating respiratory-variation-related fluctuations from neuronal-activity-related fluctuations in fMRI. NeuroImage. 2006;31:1536–1548. - PubMed
Publication types
MeSH terms
Substances
Grants and funding
LinkOut - more resources
Full Text Sources
Other Literature Sources
Medical
