. 2016 Jul;107(7):981-90.
doi: 10.1111/cas.12968. Epub 2016 Jun 24.

Regulation of CD44 expression and focal adhesion by Golgi phosphatidylinositol 4-phosphate in breast cancer

Affiliations

Regulation of CD44 expression and focal adhesion by Golgi phosphatidylinositol 4-phosphate in breast cancer

Takeshi Ijuin et al. Cancer Sci. 2016 Jul.

Abstract

CD44, a transmembrane receptor, is expressed in the standard or variant form and plays a critical role in tumor progression and metastasis. This protein regulates cell adhesion and migration in breast cancer cells. We previously reported that phosphatidylinositol-4-phosphate (PI(4)P) at the Golgi regulates cell migration and invasion in breast cancer cell lines. In this study, we showed that an increase in PI(4)P levels at the Golgi by knockdown of PI(4)P phosphatase SAC1 increased the expression of standard CD44, variant CD44, and ezrin/radixin phosphorylation and enhanced the formation of focal adhesions mediated by CD44 and ezrin/radixin in MCF7 and SK-BR-3 cells. In contrast, knockdown of PI 4-kinase IIIβ in highly invasive MDA-MB-231 cells decreased these factors. These results suggest that SAC1 expression and PI(4)P at the Golgi are important in tumor progression and metastasis and are potential prognostic markers of breast cancers.

Keywords: Breast cancer; CD44; SAC1; focal adhesion; phosphatidylinositol-4-monophosphate.


Figures

Figure 1
Figure 1
Knockdown of SAC1 increased CD44 expression in luminal breast cancer cell lines. (a) Analysis of SAC1 expression in CD44+ and CD44 fractions of MCF7 cells. Western blot analysis of the lysates obtained from the CD44+ and CD44 fractions of MCF7 cells. The relative amounts of SAC1 expression in each fraction compared to unfractionated MCF7 cells are shown in the graph. The levels were quantified by densitometry, which were further normalized to β‐tubulin levels. The results are presented as the mean ± SEM of three independent experiments. **P < 0.01. (b) Semiquantitative RTPCR analysis of CD44s,CD44v, and Gapdh in MCF7 cells transfected with control or SAC1‐targeted siRNAs. The relative amounts of these mRNAs were quantified by densitometry, which were further normalized to the amount of Gapdh mRNA. The results are presented as the mean ± SEM of four independent experiments. *P < 0.05; **P < 0.01; ***P < 0.001. (c) Semiquantitative RTPCR analysis of CD44s,CD44v, and β‐actin in SKBR‐3 cells transfected with control or SAC1‐targeted siRNAs. The relative amounts of these mRNAs were quantified by densitometry, which were further normalized to the amount of Gapdh mRNA. The results are presented as the mean ± SEM of four independent experiments. *P < 0.05; ***P < 0.001. (d) Changes in the expression of CD44 and CD44 variant 6 (CD44v6) proteins, induced by knockdown of SAC1 in MCF7 cells. MCF7 cells were transfected with control or SAC1‐targeted siRNAs for 72 h before lysate collection. The relative amounts of SAC1, standard CD44 (CD44s), and CD44v6 expression were quantified by densitometry, which were further normalized to the amount of GAPDH. The results are presented as the mean ± SEM of four independent experiments. *P < 0.05; **P < 0.01. (e) Changes in expression of CD44 and CD44v6 proteins, induced by knockdown of SAC1 in SKBR‐3 cells. The relative amount of SAC1 expression was quantified by densitometry, which was further normalized to the amount of GAPDH. The results are presented as the mean ± SEM of three independent experiments. *P < 0.05.
Figure 2
Figure 2
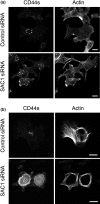
Immunofluorescence analysis of CD44 in normal or SAC1‐silenced MCF7 and SKBR‐3 cells. (a) Immunofluorescence analysis of endogenous CD44 in MCF7 cells transfected with control or SAC1‐targeted siRNA. F‐actin was visualized using Alexa Fluor 647–phalloidin. Scale bar = 20 μm. (b) Immunofluorescence analysis of endogenous CD44 in SKBR‐3 cells transfected with control or SAC1‐targeted siRNA. F‐actin was visualized using Alexa Fluor 647–phalloidin. Scale bar = 20 μm.
Figure 3
Figure 3
Knockdown of phosphoinositide 4‐kinase IIIβ (PI4KIIIβ) attenuated the expression of CD44 variants (CD44v) in MDAMB‐231 cells. (a) Semiquantitative RTPCR analysis of CD44s,CD44v, and Gapdh in MDAMB‐231 cells transfected with control or PI4KIIIβ‐targeted siRNAs. The relative amounts of these mRNAs were quantified by densitometry, which were further normalized to the amount of Gapdh mRNA. The results are presented as the mean ± SEM of four independent experiments. *P < 0.05; **P < 0.01. (b) Semiquantitative RTPCR analysis of CD44s,CD44v, and β‐actin in HS578t cells transfected with control or PI4KIIIβ‐targeted siRNAs. The relative amounts of these mRNAs were quantified by densitometry, which were further normalized to the amount of β‐actin mRNA. The results are presented as the mean ± SEM of three independent experiments. *P < 0.05; **P < 0.01. (c) Changes in the expression of CD44 and CD44v6 proteins induced by the knockdown of PI4KIIIβ in MDAMB‐231 cells. MDAMB‐231 cells were transfected with control or PI4KIIIβ siRNAs for 72 h before lysate collection. The relative amounts of PI4KIIIβ, CD44, and CD44v6 expression were quantified by densitometry. The results are presented as the mean ± SEM of four independent experiments. *P < 0.05. (d) Changes in the expression of CD44 and CD44v6 proteins induced by the knockdown of PI4KIIIβ in Hs578t cells. MDAMB‐231 cells were transfected with control or PI4KIIIβ siRNAs for 72 h before lysate collection. The results are presented as the mean ± SEM of four independent experiments. *P < 0.05.
Figure 4
Figure 4
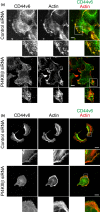
Immunofluorescence analysis of CD44 variant (CD44v) in phosphoinositide 4‐kinase IIIβ (PI4KIIIβ)‐silenced MDAMB‐231 and Hs578t breast cancer cells. (a) Immunofluorescence analysis of endogenous CD44v6 in MDAMB‐231 cells transfected with control or PI4KIIIβ siRNA. F‐actin was visualized using Alexa Fluor 647–phalloidin. Enlarged images of boxed areas are shown in the lower panels. Yellow indicates the region of localization at the plasma membrane. Scale bar = 20 μm. (b) Immunofluorescence analysis of endogenous CD44v6 in Hs578t cells transfected with control or PI4KIIIβ siRNA. F‐actin was visualized using Alexa Fluor 647–phalloidin. Enlarged images of boxed areas are shown in the lower panels. Yellow indicates the region of localization at the plasma membrane. Scale bar = 20 μm.
Figure 5
Figure 5
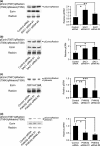
Ezrin/radixin phosphorylation was under the control of Golgi phosphatidylinositol‐4‐phosphate (PI(4)P). (a,b) Effect of SAC1 knockdown on the phosphorylation of ezrin–radixin–moesin (ERM) protein in MCF7 (A) and SKBR‐3 (b) breast cancer cells. Values were normalized to total ezrin protein content. (c,d) Effect of phosphoinositide 4‐kinase IIIβ (PI4KIIIβ) silencing on the phosphorylation of ERM in MDAMB‐231 (c) and Hs578t (d) cells. Values were normalized to total ezrin protein content. All results are presented as the mean ± SEM of four independent experiments. *P < 0.05; **P < 0.01; ***P < 0.001. p, phosphorylated.
Figure 6
Figure 6
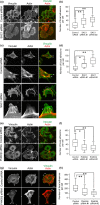
Role of phosphatidylinositol‐4‐phosphate (PI(4)P) in the formation of focal adhesions in breast cancer cells. (a) Immunofluorescence analysis of vinculin in MCF7 cells transfected with control or SAC1‐targeted siRNA. F‐actin was visualized using Alexa Fluor 647–phalloidin. Scale bar = 20 μm. (b) Vinculin‐positive focal adhesion in MCF7 cells transfected with control or SAC1‐targeted siRNA. The number of adhesions was determined using the images captured in 40 cells by confocal microscopy. (c) Immunofluorescence analysis of vinculin in SKBR‐3 cells transfected with control or SAC1‐targeted siRNA. F‐actin was visualized using Alexa Fluor 647–phalloidin. Enlarged images of boxed areas are shown in the lower panels. Arrowheads indicate focal adhesions. Scale bar = 20 μm. (d) Vinculin‐positive focal adhesion in SKBR‐3 cells transfected with control or SAC1‐targeted siRNA. The number of adhesions was determined using the images captured in 40 cells by confocal microscopy. (e) Immunofluorescence analysis of endogenous vinculin in MDAMB‐231 cells transfected with control or phosphoinositide 4‐kinase IIIβ (PI4KIIIβ)‐targeted siRNA. F‐actin was visualized using Alexa Fluor 647–phalloidin. Scale bar = 20 μm. (f) Vinculin‐positive focal adhesion in control‐ or PI4KIIIβ‐depleted MDAMB‐231 cells. Focal adhesions were analyzed in more than 40 cells. (g) Immunofluorescence analysis of endogenous vinculin in Hs578t cells transfected with control or PI4KIIIβ‐targeted siRNA. F‐actin was visualized using Alexa Fluor 647–phalloidin. Arrowheads indicate focal adhesions. Scale bar = 20 μm. (h) Vinculin‐positive focal adhesion in control‐ or PI4KIIIβ‐depleted Hs578t cells. Focal adhesions were analyzed in 40 cells. All data are presented as box and whisker plots with boxes representing 25th–75th percentile range and whiskers representing 10th–90th percentile range. *P < 0.05; **P < 0.01.
Figure 7
Figure 7
Schematic illustration of regulatory cross‐talk occurring between Golgi phosphatidylinositol‐4‐phosphate (PI(4)P), CD44 expression, and cell adhesion in breast cancer cell invasion and motility. PI(4)P at the Golgi plays a critical role in cancer progression. Changes in the Golgi PI(4)P levels altered the expression and localization of CD44, focal adhesion formation, cell–cell adhesion formation, cell migration/invasion, and metastasis in breast cancer cell lines. Regulation of the localization of the PI(4)P effector Golgi phosphoprotein 3 (GOLPH3) at the Golgi was predicted to cause these phenotypes. The involvement of PI(4)P levels in molecular subclassification of breast cancer cells is shown.

Similar articles

Cited by

References

    1. Screaton GR, Bell MV, Jackson DG, Cornelis FB, Gerth U, Bell JI. Genomic structure of DNA encoding the lymphocyte homing receptor CD44 reveals at least 12 alternatively spliced exons. Proc Natl Acad Sci USA 1992; 89: 12160–4. - PMC - PubMed
    1. Fox SB, Fawcett J, Jackson DG et al Normal human tissues, in addition to some tumors, express multiple different CD44 isoforms. Cancer Res 1994; 54: 4539–46. - PubMed
    1. Kaufmann M, Heider KH, Sinn HP, von Minckwitz G, Ponta H, Herrlich P. CD44 variant exon epitopes in primary breast cancer and length of survival. Lancet 1995; 345: 615–19. - PubMed
    1. Barshishat M, Ariel A, Cahalon L, Chowers Y, Lider O, Schwartz B. TNFalpha and IL‐8 regulate the expression and function of CD44 variant proteins in human colon carcinoma cells. Clin Exp Metastasis 2002; 19: 327–37. - PubMed
    1. Hwang‐Verslues WW, Kuo WH, Chang PH et al Multiple lineages of human breast cancer stem/progenitor cells identified by profiling with stem cell markers. PLoS ONE 2009; 4: e8377. - PMC - PubMed

MeSH terms