. 2016 May 14;11(1):62.
doi: 10.1186/s13023-016-0439-6.

Complex translocation disrupting TCF4 and altering TCF4 isoform expression segregates as mild autosomal dominant intellectual disability

Affiliations

Complex translocation disrupting TCF4 and altering TCF4 isoform expression segregates as mild autosomal dominant intellectual disability

Valerie Maduro et al. Orphanet J Rare Dis. .

Abstract

Background: Mutations of TCF4, which encodes a basic helix-loop-helix transcription factor, cause Pitt-Hopkins syndrome (PTHS) via multiple genetic mechanisms. TCF4 is a complex locus expressing multiple transcripts by alternative splicing and use of multiple promoters. To address the relationship between mutation of these transcripts and phenotype, we report a three-generation family segregating mild intellectual disability with a chromosomal translocation disrupting TCF4.

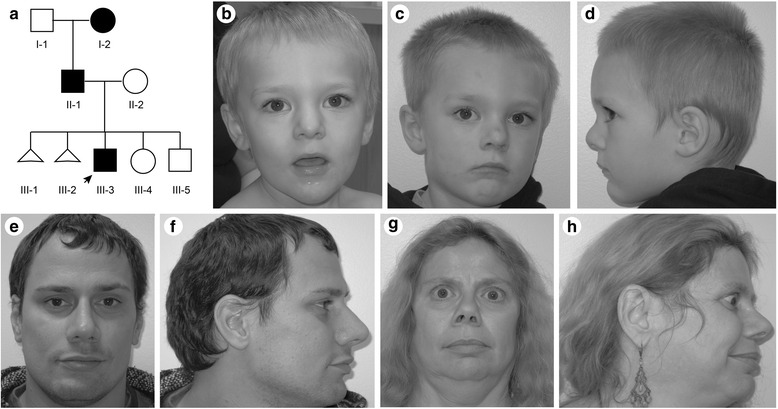
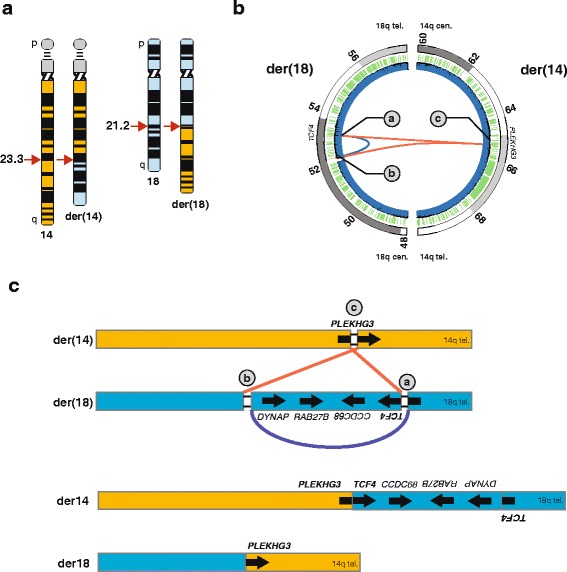
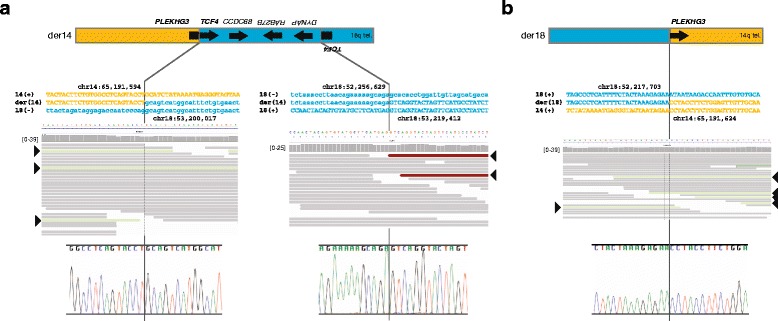
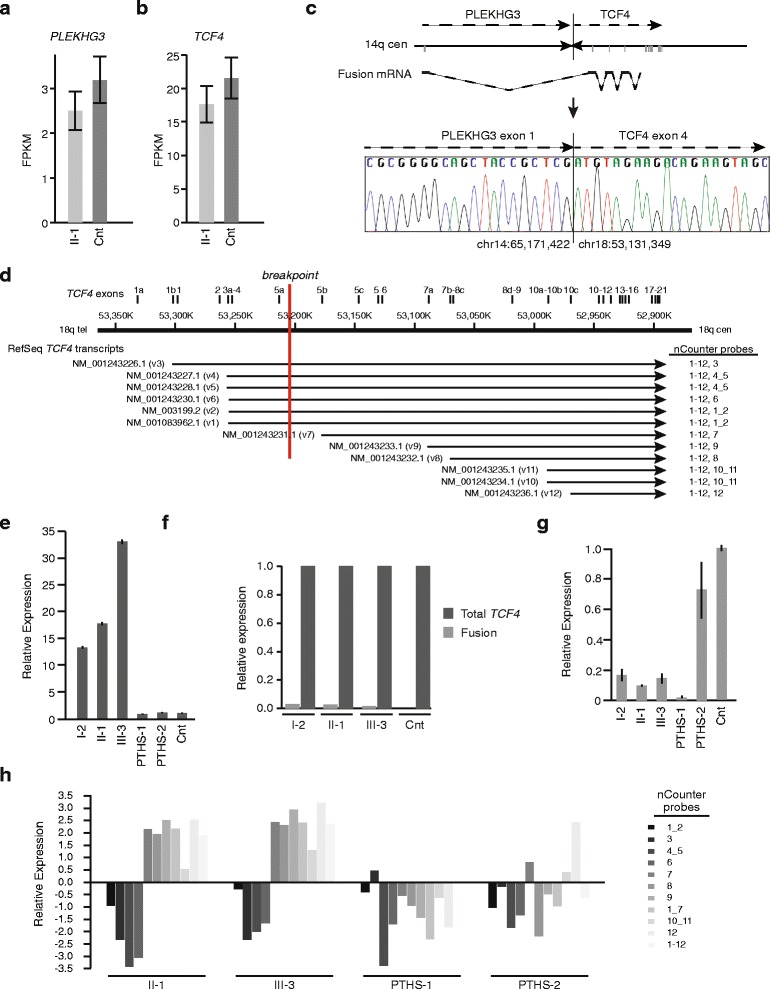
Results: Using whole genome sequencing, we detected a complex unbalanced karyotype disrupting TCF4 (46,XY,del(14)(q23.3q23.3)del(18)(q21.2q21.2)del(18)(q21.2q21.2)inv(18)(q21.2q21.2)t(14;18)(q23.3;q21.2)(14pter®14q23.3::18q21.2®18q21.2::18q21.1®18qter;18pter®18q21.2::14q23.3®14qter). Subsequent transcriptome sequencing, qRT-PCR and nCounter analyses revealed that cultured skin fibroblasts and peripheral blood had normal expression of genes along chromosomes 14 or 18 and no marked changes in expression of genes other than TCF4. Affected individuals had 12-33 fold higher mRNA levels of TCF4 than did unaffected controls or individuals with PTHS. Although the derivative chromosome generated a PLEKHG3-TCF4 fusion transcript, the increased levels of TCF4 mRNA arose from transcript variants originating distal to the translocation breakpoint, not from the fusion transcript.

Conclusions: Although validation in additional patients is required, our findings suggest that the dysmorphic features and severe intellectual disability characteristic of PTHS are partially rescued by overexpression of those short TCF4 transcripts encoding a nuclear localization signal, a transcription activation domain, and the basic helix-loop-helix domain.

Keywords: Gene expression; Intellectual disability; Pitt-Hopkins syndrome; Promoter utilization; RNAseq; TCF4; Transcriptome; Translocation.


Figures

Fig. 1
Fig. 1
Clinical photographs of the proband (arrow, III-3), his affected father (II-1) and affected paternal grandmother (I-2). (a) Family pedigree. Affected individuals are shown by black symbols. (b, c) Frontal and profile head photographs of the proband at age 2.4 years. (d) Profile head photograph of the proband at age 3.4 years. (e, f) Frontal and profile head photographs of the proband’s father at age 30 years. (g, h) Frontal and profile head photographs of the proband’s paternal grandmother at age 53 years
Fig. 2
Fig. 2
Delineation of a balanced translocation (t(14;18)) disrupting transcription factor 4 (TCF4) using whole genome sequencing of patient DNA. (a) Ideogram depicting the patient’s apparently balanced translocation t(14,18)(q23.2;q21.2) and normal karyotype (46, XY). The ideogram of chromosome 18 is shaded in light blue color. (b) Inter-chromosome (red; chr18-chr14) and intra-chromosome (blue; chr18-chr18) connections identified by whole-genome sequence analysis. Intra-chromosomal inversion (943,387 bases) on chr18 encompasses RAB27B, and CCDC68 and interrupted DYNAP and TCF4. The inversion junctions are flanked by heterozygous deletions within TCF4 (19,394 bases (a)) and include the promoter and first exon of DYNAP transcript NM_173629 (38,926 bases (b)). Inter-chromosome connection on chr14 disrupts PLEKHG3 resulting in a 29 bp heterozygous deletion (c). Blue and orange arrows indicate genes on the positive and negative strand respectively. Dark blue and green wiggles indicate read depth via whole-genome sequencing, and segmental duplications (hg19 UCSC Human genome browser) respectively. (c) Schematic representation mechanism of the three ds-DNA breaks and genomic reorganization steps that led to the translocation event between chromosome 14 and 18. The three main steps were: (1) a 0.94 Mb inversion (blue arch, breakpoints a and b) on chromosome 18, followed by (2) ligation of the centromeric portion of chromosome 14 (red line, breakpoints c and a) with the telomeric q arm of chromosome 18 to yield der (14), and (3) ligation of the centromeric portion of chromosome 18 (red line, breakpoints c and b) ligation with the telomeric q arm of chromosome 14 to yield der (18). The schematic representation of chromosomes is not to scale. The der (14) chromosome harbors a gene fusion of PLEKHG3 (5’ untranslated region) and TCF4 (coding exons) as well as interrupted TCF4 transcript variants. The der (18) chromosome harbors a disrupted copy of PLEKHG3; the coding potential of the gene remains intact although the promoter and first non-coding exon are removed by the translocation
Fig. 3
Fig. 3
Characterization of the breakpoints giving rise to the derivative chromosomes 14 and 18 using massively parallel whole-genome sequencing and Sanger sequencing. (a) Characterization of derivative chromosome 14 and its breakpoints. The top panel shows a graphic of the derivative chromosome. The middle panel shows the sequence of chromosome 14 (orange type), chromosome 18 (blue type), the derivative chromosome, and the pileup of whole-genome sequencing reads at each junction. Forward sequence is shown as uppercase letters and reverse sequence as lowercase letters. The mate pairs spanning the translocation junction are shown in light green (arrowheads), and those spanning the inversion junction are shown in red (arrowheads). The lower panel shows the chromatogram for Sanger sequencing across the junction. (b) Characterization of derivative chromosome 18 and its breakpoints. The top panel shows a graphic of the derivative chromosome. The middle panel shows the sequence of chromosome 14 (orange font), chromosome 18 (blue font), the derivative chromosome, and the pileup of whole-genome sequencing reads at each junction. Forward sequence is shown as uppercase letters and reverse sequence as lowercase letters. The mate pairs spanning the translocation junction are shown in light green (arrowheads). The lower panel shows the chromatogram for Sanger sequencing across the junction
Fig. 4
Fig. 4
Analysis of expression of genes at the breakpoints, i.e., PLEKHG3 and TCF4. (a) Graph comparing PLEKHG3 expression between cultured skin fibroblasts of individual II-1 and cultured skin fibroblasts of an unaffected control. Analysis was done by quantitation of transcriptome sequence reads and is shown as fragments per kilobase of exon per million fragments mapped (FPKM). (b) Graph comparing combined levels of all TCF4 transcript variants between cultured skin fibroblasts of individual II-1 and cultured skin fibroblasts of an unaffected control. Analysis was done by quantitation of transcriptome sequence reads. (c) Figure showing the PLEKHG3 : TCF4 fusion transcript generated by the derivative chromosome 14. The first non-coding exon of PLEKHG3 (3’ end chr14:65,171,422) is spliced to a coding exon of TCF4 (5’ end chr18:53,131,349). This coding exon is incorporated into TCF4 transcripts NM_001243227.1, NM_001243226.2, NM_001243228.1, NM_001083962.1, NM_001243230.1, and NM_003199.2. Transcriptome sequencing detected the fusion transcript in cultured skin fibroblasts (data not shown) and RT-PCR and Sanger sequencing detected it in peripheral blood. (d) Diagram showing the 12 TCF4 RefSeq transcripts aligned to chromosome 18 as annotated in GRCh37/hg19. Physical positions and TCF4 exons along chromosome 18 are shown at the top; the exons are labeled as per Sepp et al. [15]. The breakpoint within TCF4 is shown in red. The transcript variant number is shown in parentheses following each RefSeq accession number. nCounter probes detecting each transcript are shown in the right-hand column. (e) Graph showing the composite mRNA level of all 12 TCF4 transcripts in the peripheral blood among individuals II-1, I-2, III-3, two individuals with Pitt-Hopkins Syndrome (PTHS) and pooled unaffected controls. Measurement was done by qRT-PCR. (f) Graph comparing the level of PLEKHG3 : TCF4 fusion mRNA to the composite mRNA level of all 12 TCF4 transcripts in the peripheral blood of individuals II-1, I-2, III-3, and pooled unaffected controls. Measurement was done by qRT-PCR. (g) Graph comparing the mRNA level in peripheral blood for transcripts interrupted by the translocation (NM_001243226.1, NM_001243227.1, NM_001243228.1, NM_001243230.1, NM_003199.2, NM_001083962.1) inclusive of the PLEKHG3-TCF4 fusion transcript. The mRNA levels were measured among individuals II-1, I-2, III-3, two individuals with Pitt-Hopkins Syndrome (PTHS) and pooled unaffected controls by qRT-PCR. (h) Graph comparing mRNA levels in peripheral blood for various TCF4 transcripts as assessed by nCounter Analysis. The mRNA levels were measured for individuals II-1 and III-3, two individuals with Pitt-Hopkins Syndrome (PTHS) and pooled unaffected controls. The transcripts detected by each nCounter probe are defined in panel d

Similar articles

Cited by

References

    1. Luckasson R, et al. Mental Retardation: Definition, Classification, and Systems of Supports 10. Washington, DC: The American Association on Intellecutal and Developmental Disabilitites; 2002.
    1. Aicardi J. The etiology of developmental delay. Semin Pediatr Neurol. 1998;5(1):15–20. doi: 10.1016/S1071-9091(98)80013-2. - DOI - PubMed
    1. Larson SA, et al. Prevalence of mental retardation and developmental disabilities: estimates from the 1994/1995 national health interview survey disability supplements. Am J Ment Retard. 2001;106(3):231–252. doi: 10.1352/0895-8017(2001)106<0231:POMRAD>2.0.CO;2. - DOI - PubMed
    1. Roeleveld N, Zielhuis GA, Gabreels F. The prevalence of mental retardation: a critical review of recent literature. Dev Med Child Neurol. 1997;39(2):125–132. doi: 10.1111/j.1469-8749.1997.tb07395.x. - DOI - PubMed
    1. Ropers HH, Hamel BC. X-linked mental retardation. Nat Rev Genet. 2005;6(1):46–57. doi: 10.1038/nrg1501. - DOI - PubMed

MeSH terms

Substances

Supplementary concepts