

High resolution study of the spatial distributions of abyssal fishes by autonomous underwater vehicle
- PMID: 27180728
- PMCID: PMC4867640
- DOI: 10.1038/srep26095
High resolution study of the spatial distributions of abyssal fishes by autonomous underwater vehicle
Abstract
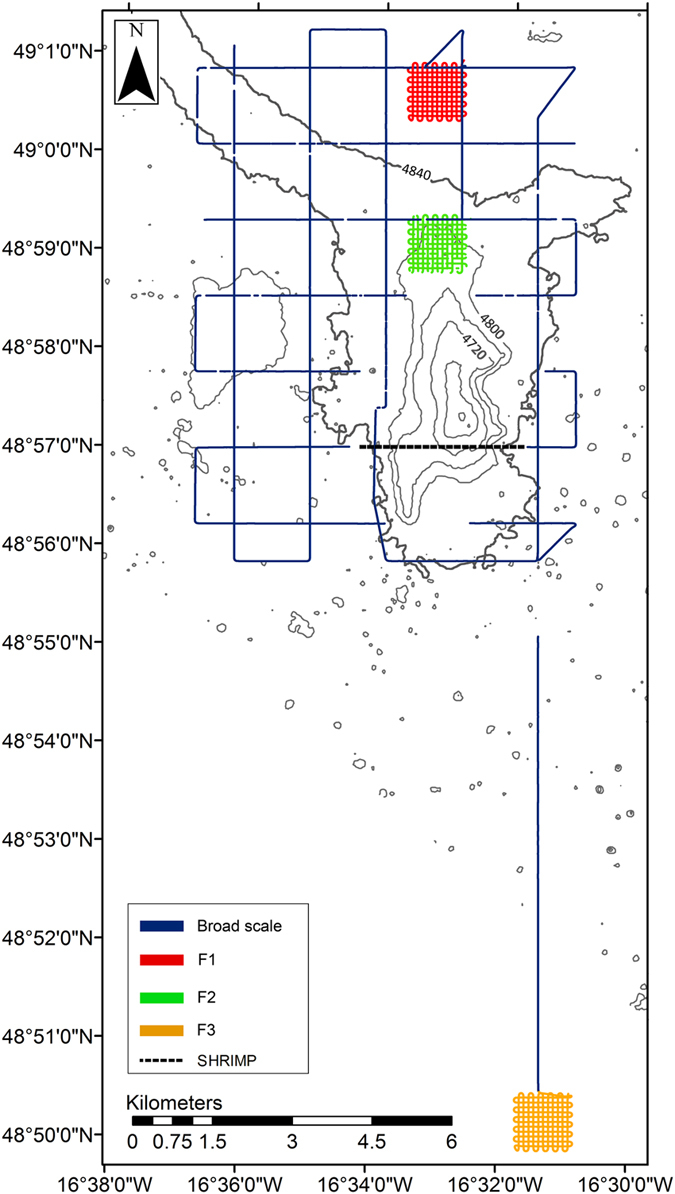
On abyssal plains, demersal fish are believed to play an important role in transferring energy across the seafloor and between the pelagic and benthic realms. However, little is known about their spatial distributions, making it difficult to quantify their ecological significance. To address this, we employed an autonomous underwater vehicle to conduct an exceptionally large photographic survey of fish distributions on the Porcupine Abyssal Plain (NE Atlantic, 4850 m water depth) encompassing two spatial scales (1-10 km(2)) on and adjacent to a small abyssal hill (240 m elevation). The spatial distributions of the total fish fauna and that of the two dominant morphotypes (Coryphaenoides sp. 1 and C. profundicolus) appeared to be random, a result contrary to common expectation but consistent with previous predictions for these fishes. We estimated total fish density on the abyssal plain to be 723 individuals km(-2) (95% CI: 601-844). This estimate is higher, and likely more precise, than prior estimates from trawl catch and baited camera techniques (152 and 188 individuals km(-2) respectively). We detected no significant difference in fish density between abyssal hill and plain, nor did we detect any evidence for the existence of fish aggregations at any spatial scale assessed.
Figures


References
-
- Diggle P. J. Statistical Analysis of Spatial Point Patterns. 2nd edn, (Arnold, 2003).
-
- Moore C. H., Harvey E. S. & Van Niel K. P. Spatial Prediction of Demersal Fish Distributions: Enhancing Our Understanding of Species-Environment Relationships. ICES. J. Mar. Sci 66, 2068–2075, doi: 10.1093/icesjms/fsp205 (2009). - DOI
-
- Law R. et al. Ecological Information from Spatial Patterns of Plants: Insights from Point Process Theory. J. Ecol. 97, 616–628, doi: 10.1111/j.1365-2745.2009.01510.x (2009). - DOI
-
- Taylor L. R., Woiwod I. P. & Perry J. N. Density-Dependence of Spatial Behavior and Rarity of Randomness. J. Anim. Ecol. 47, 383–406, doi: 10.2307/3790 (1978). - DOI
-
- Hui C., Veldtman R. & McGeoch M. A. Measures, Perceptions and Scaling Patterns of Aggregated Species Distributions. Ecography 33, 95–102, doi: 10.1111/j.1600-0587.2009.05997.x (2010). - DOI
Publication types
MeSH terms
LinkOut - more resources
Full Text Sources
Other Literature Sources
