. 2016 Jun 2;165(6):1401-1415.
doi: 10.1016/j.cell.2016.04.033. Epub 2016 May 12.

SIRT6 Suppresses Pancreatic Cancer through Control of Lin28b

Affiliations

SIRT6 Suppresses Pancreatic Cancer through Control of Lin28b

Sita Kugel et al. Cell. .

Abstract

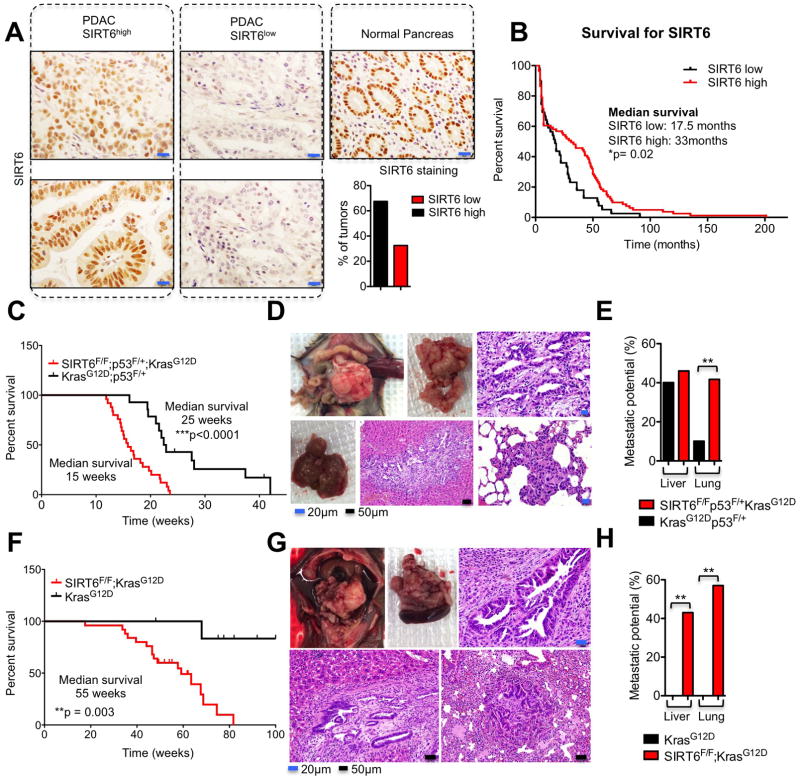
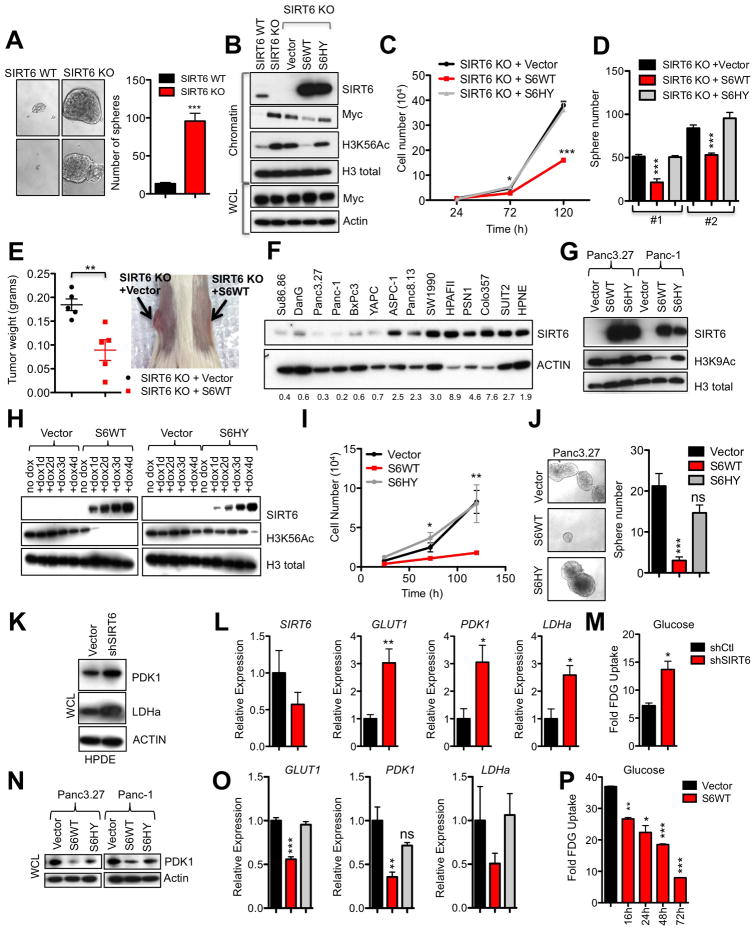
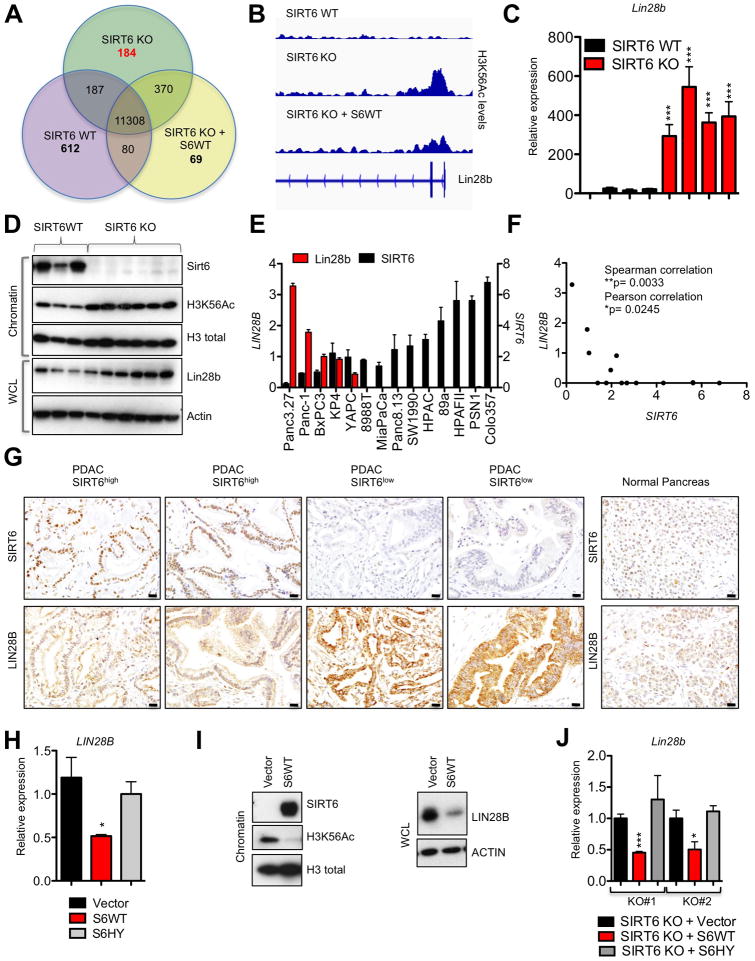
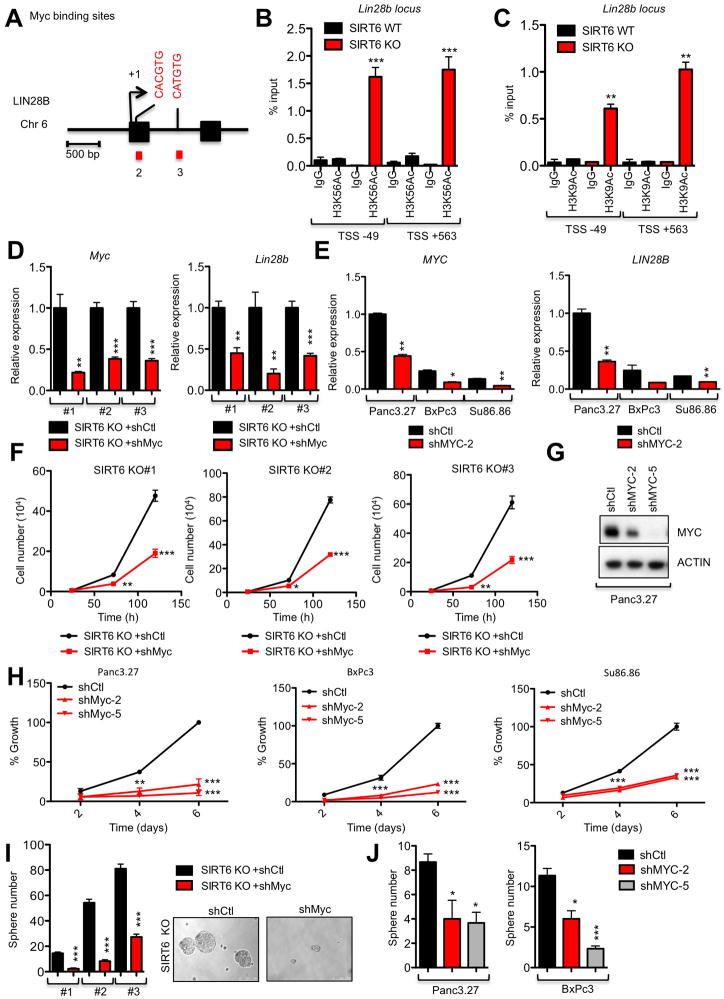
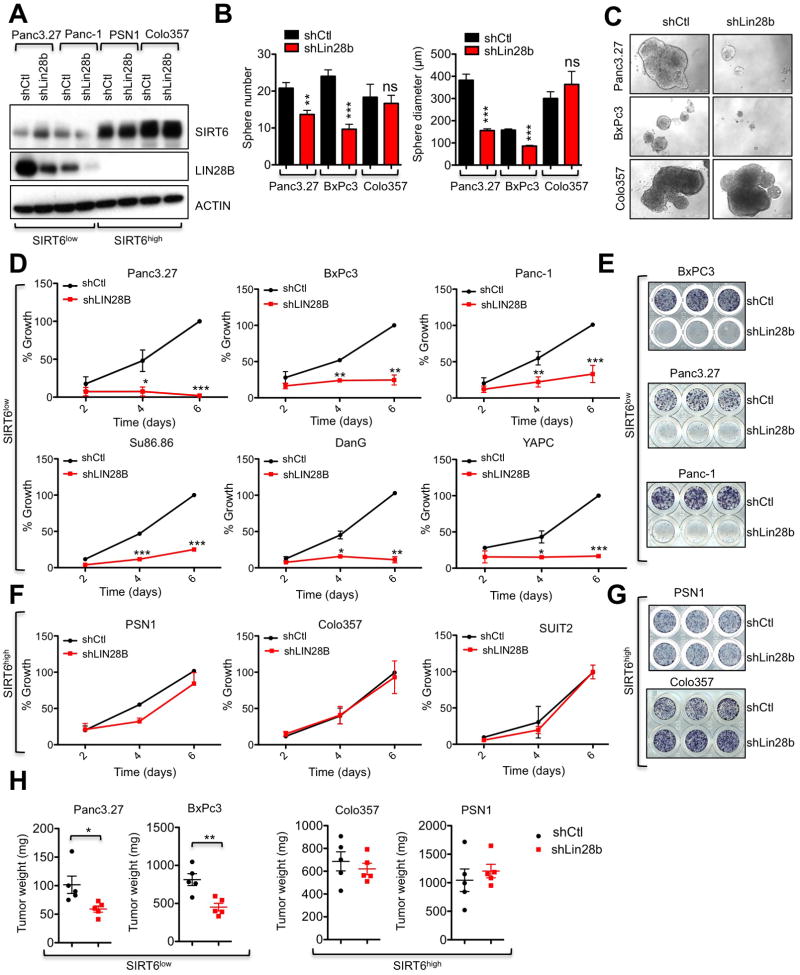
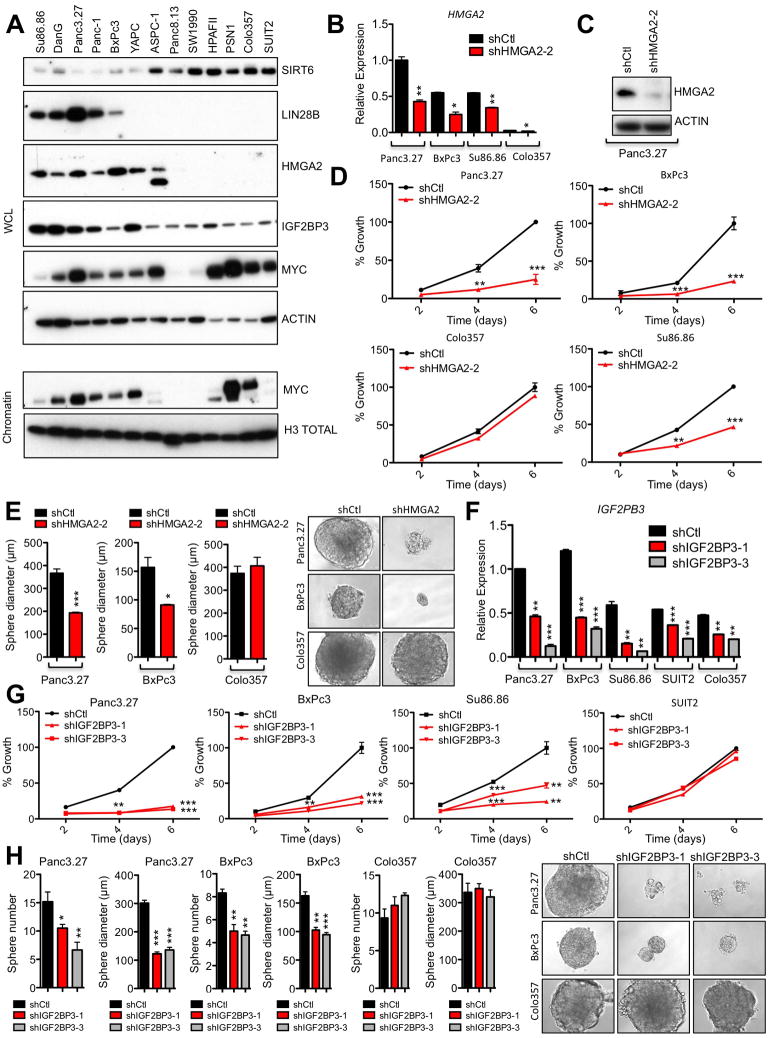
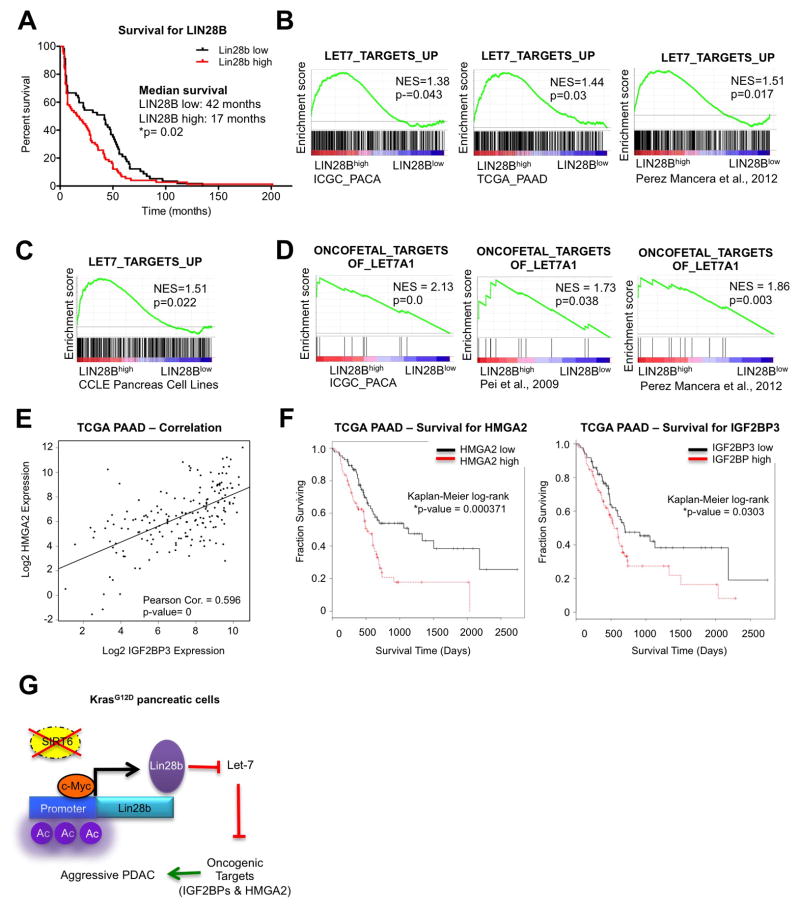
Chromatin remodeling proteins are frequently dysregulated in human cancer, yet little is known about how they control tumorigenesis. Here, we uncover an epigenetic program mediated by the NAD(+)-dependent histone deacetylase Sirtuin 6 (SIRT6) that is critical for suppression of pancreatic ductal adenocarcinoma (PDAC), one of the most lethal malignancies. SIRT6 inactivation accelerates PDAC progression and metastasis via upregulation of Lin28b, a negative regulator of the let-7 microRNA. SIRT6 loss results in histone hyperacetylation at the Lin28b promoter, Myc recruitment, and pronounced induction of Lin28b and downstream let-7 target genes, HMGA2, IGF2BP1, and IGF2BP3. This epigenetic program defines a distinct subset with a poor prognosis, representing 30%-40% of human PDAC, characterized by reduced SIRT6 expression and an exquisite dependence on Lin28b for tumor growth. Thus, we identify SIRT6 as an important PDAC tumor suppressor and uncover the Lin28b pathway as a potential therapeutic target in a molecularly defined PDAC subset. PAPERCLIP.


Figures

Figure 1
Figure 1. Loss of SIRT6 Cooperates with Oncogenic Kras to Accelerate PDAC
A, Immunohistochemistry of SIRT6 in human PDAC samples (left & center) compared to normal pancreas (right) and quantification of IHC scoring (bottom right). B, Kaplan–Meier analysis of the indicated PDAC patient samples based on SIRT6 IHC score (n=120). C, Kaplan–Meier analysis of the indicated genetically engineered mouse models (GEMMs) showing time until signs of illness necessitated euthanasia. All animals euthanized had pancreatic tumors. D, Necropsy of Sirt6f/f;KrasG12D;p53f/+;p48-Cre (SIRT6 KO) GEMM euthanized at 13 weeks. Top left, Image of abdominal contents showing pancreatic mass and splenomegaly. Top middle, extracted SIRT6 KO tumor. Upper right, haematoxylin and eosin (H&E) staining showing PDAC histology. Bottom left, Gross image of liver with metastases. Bottom middle, H&E stain of liver metastasis. Bottom right, H&E stain of lung metastasis. E, Quantification of the metastatic potential of SIRT6 KO and Sirt6+/+;KrasG12D;p53f/+;p48-Cre (SIRT6 WT) GEMMs from the Kaplan-Meier analysis in Fig. 1C to the livers or the lungs. F, Kaplan–Meier analysis of the indicated genetically engineered mouse models (GEMMs) showing time until signs of illness necessitated euthanasia. All animals euthanized had pancreatic tumors. G, Necropsy of Sirt6f/f;KrasG12D;p53+/+;p48-Cre GEMM euthanized at 55 weeks. Top left, Image of abdominal contents showing pancreatic mass and splenomegaly. Top middle, extracted Sirt6f/f;KrasG12D;p53+/+;p48-Cre pancreatic tumor with spleen attached. Upper right, haematoxylin and eosin (H&E) staining showing PDAC histology. Bottom left, H&E of liver metastasis. Bottom right, H&E stain of lung metastasis. H, Quantification of the metastatic potential of Sirt6f/f;KrasG12D;p53+/+;p48-Cre and Sirt6+/+;KrasG12D;p53+/+;p48-Cre GEMMs from the Kaplan-Meier analysis in Fig. 1F to the livers or the lungs. Scale bars, black 50 μm, blue 20 μm. * p ≤ 0.05; ** p ≤ 0.01; *** p ≤ 0.001. See also Fig S1.
Figure 2
Figure 2. SIRT6 Suppresses Proliferation of Established PDAC Though Histone Deacetylation
A, Murine PDAC cells were grown under restrictive, nonadherent conditions to induce tumor sphere formation, photomicrographs (left) and quantified (right). Two independent cell lines are represented. B–E, Murine PDAC cells were engineered to express empty vector (vector), SIRT6 WT (S6 WT) or the SIRT6 HY (S6HY) catalytically inactive mutant. B, Immunoblot (IB) of chromatin extract and whole cell lysate (WCL). C, Growth curve of a representative SIRT6 KO PDAC line. D, Quantification of tumor spheres formed by two independent SIRT6 KO PDAC lines and grown as in A. E, Tumor weights (left) and gross image of SIRT6 KO PDAC cell line grown for 3 weeks as a subcutaneous xenograft. F, IB of WCL in human PDAC cell lines with quantification of SIRT6/actin ratios below. G–J, Panc3.27 and Panc-1 cells were engineered to express Vector, S6WT or S6HY under a doxycycline (Dox)-inducible system. G, IB of chromatin extract. H, IB of chromatin extract from Panc3.27 cells treated with Dox for the indicated times. The partial effect of S6HY on H3K56Ac levels after 4 days of overexpression likely relates to its partial catalytic activity. I, Proliferation was quantified by trypan blue exclusion assay. J. Photomicrographs (left) and quantification of Panc3.27 tumor spheres. K–M, HPDE cells were engineered to express empty vector (shCtl) and shSIRT6 under a Dox-inducible system. K, IB of WCL, please see Figure S1A for SIRT6 levels. L, Quantitative polymerase chain reaction with reverse transcription (qRTPCR) analysis of SIRT6 and glycolytic genes. M, FDG-Glucose uptake in HPDE cells. N–P, Panc3.27 and Panc-1 cells were engineered to express empty Vector, S6WT or S6HY under a Dox-inducible promoter. N, IB of WCL. O, qRTPCR analysis of glycolytic genes in Panc3.27 cells. P, FDG-Glucose uptake in Panc3.27 cells after treatment with dox for the indicated times. * p ≤ 0.05; ** p ≤ 0.01; *** p ≤ 0.001. See also Fig S1 and S2.
Figure 3
Figure 3. SIRT6 Suppresses Expression of the Oncofetal Protein Lin28b in Human and Murine PDAC
A, Venn diagram of gene promoters decorated by H3K56Ac in SIRT6 WT, SIRT6 KO and SIRT6 KO PDAC cells engineered to express SIRT6 WT as determined by Chromatin immunoprecipitation (ChIP) sequencing (Seq). B, Integrative genomics viewer track of H3K56Ac levels along the Lin28b promoter of the indicated murine PDAC cell lines. C, Expression of Lin28b in four independent SIRT6 WT and SIRT6 KO murine PDAC cell lines as measured by qRTPCR; data are presented as mean ± s.e.m. between three independent experiments. D, IB of chromatin and WCL from individual SIRT6 WT and SIRT6 KO PDAC cell lines. E,F qRTPCR analysis for expression of LIN28B and SIRT6 in human PDAC cell lines displayed as a bar graph (E) and scatter plot (F) demonstrating an inverse correlation; data represent mean ± s.e.m. between three independent experiments. G, Immunohistochemistry of LIN28B and SIRT6 in human PDAC samples (left) compared to normal pancreas (right). H, I, LIN28B levels in Panc3.27 expressing empty vector, S6WT or the S6HY catalytically inactive mutant as measured by qRTPCR (H) and IB (I). J, Lin28b levels in two independent SIRT6 KO murine PDAC cells lines expressing empty vector, S6WT or S6HY. Scale bars, black 50 μm. * p ≤ 0.05; ** p ≤ 0.01; *** p ≤ 0.001. See also Fig S3.
Figure 4
Figure 4. SIRT6 Co-represses Myc-driven Transcription of Lin28b Through Histone Deacetylation
A, Schematic representation of the human genomic region near the transcription start site of LIN2B. Putative Myc binding sites are indicated (CACGTG or CATGTG); both sites are conserved between human and mouse. B,C, ChIP of H3K56Ac (B) and H3K9Ac (C) marks followed by amplification of the regions surrounding the Myc binding sites in the LIN28B promoter. D,F&I Analysis of three independent SIRT6 KO murine PDAC cell lines expressing the either shMyc or control hairpins for expression of Myc (left) and Lin28b (right) by qRT-PCR (D), cell proliferation (F) and tumor sphere forming ability (I). E,G,H&J Analysis of three independent SIRT6low PDAC cell lines expressing the either shMyc or control hairpins for expression of MYC (left) and LIN28B (right) by qRT-PCR (E), IB of MYC knockdown (G), cell proliferation (H) and tumor sphere forming ability (J). For E, H&J, data are representated as mean ±std between triplicates. * p ≤ 0.05; ** p ≤ 0.01; *** p ≤ 0.001. See also Fig S3.
Figure 5
Figure 5. SIRT6low Human PDAC cells are Addicted to Lin28b
A–H, Human PDAC cell lines with either high or low levels of SIRT6 expression were treated with shLIN28B versus a control hairpin. A, IB of WCL for SIRT6 and LIN28B. B, Number (left) and size (right) of tumor spheres. C, Photo-micrographs of tumor spheres. D,F, Growth curve of SIRT6low (D) and SIRT6high (F) human PDAC cells, quantified by MTT assay. E&G, show visualization of day 6 results in SIRT6low (E) and SIRT6high (G) human PDAC cells. H, Tumor weights of SIRT6low and SIRT6high PDAC lines grown as subcutaneous xenografts (n=5). * p ≤ 0.05; ** p ≤ 0.01; *** p ≤ 0.001. See also Fig S4 and S5.
Figure 6
Figure 6. Lin28b Decreases let-7 Levels and Increases Igf2bp1/3 and Hmga2 Levels in PDAC
A, IB of WCL and chromatin of human PDAC cell lines. SIRT6 and ACTIN have been reproduced from Figure 2F for comparison as these are from the same blot. B–E, SIRT6low and SIRT6high human PDAC cells treated with either shHMGA2 or control hairpin. Confirmation of HMGA2 knockdown by qRTPCR (B) and IB (C). D, Growth curves of SIRT6low (Panc3.27, BxPc3 and Su86.86) and SIRT6high (COLO357) human PDAC cell lines. E, Quantification of sphere diameter of SIRT6low (Panc3.27 and BxPc3) and SIRT6high (COLO357) human PDAC cell lines (left) and representative photo pictomicrographs (right). F–H, SIRT6low and SIRT6high human PDAC cells treated with either shIGF2BP3 or control hairpins. F, Confirmation of IGF2BP3 knockdown by qRTPCR. G, Growth curves of SIRT6low (Panc3.27, BxPc3 and Su86.86) and SIRT6high (SUIT2) human PDAC cell lines. H, Quantification of sphere diameter and number of SIRT6low (Panc3.27 and BxPc3) and SIRT6high (COLO357) human PDAC cell lines (left) and representative photo pictomicrographs (right). For B & D–H, data are representated as mean ±std between triplicates. * p ≤ 0.05; ** p ≤ 0.01; *** p ≤ 0.001. See also Fig S6.
Figure 7
Figure 7. Increased expression of LIN28B and let-7 target genes correlates with poor survival in PDAC
A, Kaplan–Meier analysis of the indicated PDAC patient samples based on LIN28B IHC score (n=120). B–C, Gene Set Enrichment Analysis (GSEA) plots showing that human PDAC tumors (B) and PDAC cell lines from the Cancer Cell line Encyclopedia (CCLE) (C) with high levels of LIN28B (LIN28Bhigh) overexpress many of the genes that are regulated by let-7. D, GSEA plots showing that human LIN28Bhigh PDAC tumors overexpress targets of let-7 which are oncofetal genes. E, Correlation of HMGA2 and IGF2BP3 RNA expression in human PDAC samples from the TCGA pancreatic cancer dataset. F, Kaplan-Meier survival curves based on expression of HMGA2 (left) and IGF2BP3 (right) in human pancreatic cancer datasets from the TCGA. G, Model for SIRT6 loss in PDAC pathogenesis. * p ≤ 0.05; ** p ≤ 0.01; *** p ≤ 0.001. See also Fig S7.

References

    1. Badea L, Herlea V, Dima SO, Dumitrascu T, Popescu I. Combined gene expression analysis of whole-tissue and microdissected pancreatic ductal adenocarcinoma identifies genes specifically overexpressed in tumor epithelia. Hepato-gastroenterology. 2008;55:2016–2027. - PubMed
    1. Barretina J, Caponigro G, Stransky N, Venkatesan K, Margolin AA, Kim S, Wilson CJ, Lehar J, Kryukov GV, Sonkin D, et al. The Cancer Cell Line Encyclopedia enables predictive modelling of anticancer drug sensitivity. Nature. 2012;483:603–607. - PMC - PubMed
    1. Bell JL, Wachter K, Muhleck B, Pazaitis N, Kohn M, Lederer M, Huttelmaier S. Insulin-like growth factor 2 mRNA-binding proteins (IGF2BPs): post-transcriptional drivers of cancer progression? Cellular and molecular life sciences : CMLS. 2013;70:2657–2675. - PMC - PubMed
    1. Biankin AV, Waddell N, Kassahn KS, Gingras MC, Muthuswamy LB, Johns AL, Miller DK, Wilson PJ, Patch AM, Wu J, et al. Pancreatic cancer genomes reveal aberrations in axon guidance pathway genes. Nature. 2012;491:399–405. - PMC - PubMed
    1. Boyerinas B, Park SM, Shomron N, Hedegaard MM, Vinther J, Andersen JS, Feig C, Xu J, Burge CB, Peter ME. Identification of let-7-regulated oncofetal genes. Cancer research. 2008;68:2587–2591. - PubMed

Publication types