. 2016 Jun 2;165(6):1507-1518.
doi: 10.1016/j.cell.2016.04.045. Epub 2016 May 12.

A Mechanogenetic Toolkit for Interrogating Cell Signaling in Space and Time

Affiliations

A Mechanogenetic Toolkit for Interrogating Cell Signaling in Space and Time

Daeha Seo et al. Cell. .

Erratum in

Abstract

Tools capable of imaging and perturbing mechanical signaling pathways with fine spatiotemporal resolution have been elusive, despite their importance in diverse cellular processes. The challenge in developing a mechanogenetic toolkit (i.e., selective and quantitative activation of genetically encoded mechanoreceptors) stems from the fact that many mechanically activated processes are localized in space and time yet additionally require mechanical loading to become activated. To address this challenge, we synthesized magnetoplasmonic nanoparticles that can image, localize, and mechanically load targeted proteins with high spatiotemporal resolution. We demonstrate their utility by investigating the cell-surface activation of two mechanoreceptors: Notch and E-cadherin. By measuring cellular responses to a spectrum of spatial, chemical, temporal, and mechanical inputs at the single-molecule and single-cell levels, we reveal how spatial segregation and mechanical force cooperate to direct receptor activation dynamics. This generalizable technique can be used to control and understand diverse mechanosensitive processes in cell signaling. VIDEO ABSTRACT.


Figures

Figure 1
Figure 1. A Magnetoplasmonic Nanoprobe System for Spatial, Chemical, and Mechanical Control of Cell Signaling
When targeted to mechanosensitive proteins expressed at the cell surface, the magnetoplasmonic nanoparticle (MPN) probes can deliver various modes of controlled perturbation: Chemical control is derived via ligand-receptor or protein-tag interactions facilitated by modular nanoparticle functionalization. Spatial control is achieved through application of a focused magnetic field gradient to defined sub cellular location and subsequent nanoparticle relocalization. Additionally, by increasing the magnetic field gradient through approaching the tweezer towards the cell surface, nanoprobes can mechanically load targeted proteins, inducing conformational changes (Mechanical control). Each independent MPN-driven cue can be applied at any given time (Temporal control) with any desired dose (Quantity control).
Figure 2
Figure 2. Imaging, Targeting, and Force-Generating Capabilities of the MPNs
(A) Characterization of MPNs. Transmission electron microscope (TEM) images and elemental mapping revealed uniform size dispersity (50 ± 4 nm) and composition. Scale bar, 200 nm. (B) Modular functionalization of MPNs. (CE) Spatial control of SNAP-tag protein diffusion across a supported lipid bilayer (SLB) by MPNs. (C) Experimental scheme. We directed a micromagnetic tweezer vertically toward the lipid bilayer while changing the tip-to-membrane distance (d) between the tweezer and the SLB. (D) Representative images of concentrated nanoparticle assemblies. Scale bar, 10 μm. (E) The lateral resolution and effective length of concentration as a function of d. (FG) In vitro characterization of force delivery by MPNs. (F) Experimental scheme and dark field images of MPN-induced single-molecule rupture of a double stranded DNA. Scale bar, 2 μm. (G) The most probable rupture distances of DNAs with various immobilization geometries.
Figure 3
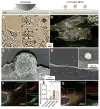
Figure 3. Effect of MPNs and Microbeads on Cell Architecture and Signaling after Probe Labeling
(A–F) Optical imaging of (A) microbead- or (B) MPN-labeled U2OS cells expressing SNAP-hN1-mCherry receptors. MPN probes show dense labeling. Scanning electron microscopy images of (C) microbead- or (D) MPN-labeled cells expressing Notch. Inset image show a 10x magnification on a single MPN. The cell edge is outlined in white. (E) Diffusion of Notch receptors labeled with magnetic microbeads and MPN probes. (F) Confocal microscopy of U2OS cells expressing E-cadherin, after labeling with (F) a microbead or (G) MPNs in the absence of any magnetic perturbation.
Figure 4
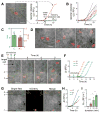
Figure 4. Responses of Notch Receptors to Spatial, Mechanical, and Chemical Perturbation with MPNs
(AC) Spatial control of MPN-labeled Notch receptors expressed in U2OS cells. Representative images of spatially segregated (A) MPNs and (B) Notch in a cell. (C) Other representative overlay images. Scale bars, 10 μm. (DF) Force response of Notch receptors at the cell surface. (D) Dark-field images of MPN-labeled Notch after weak (1 pN at d = 2.0 μm) or strong (9 pN at d = 0.7 μm) force application. No particle detachment was seen under the weak force, while immediate detachment of the particle was observed with strong force. Scale bar: 2 μm (E) Time-traces of mCherry fluorescence signal of pre-concentrated Notch after weak- or strong-force application. (F) Statistical analysis of mCherry fluorescence signal after force application with or without inhibition. (GH) Effects of receptor segregation, mechanical force, and ligand-receptor interaction on Notch signal activation. (G) Optical imaging of UAS-Gal4 cells after varing stimulation with respect to targeting chemistry (BG/SNAP vs. Dll1-Notch), particle valency (monovalency vs. crosslinkable multivalency), and force magnitude (strong vs. weak). Scale bar, 10 μm. (H) Statistical analysis of Notch activity with multiple replicates. **P < 0.01; ****P < 0.0001.
Figure 5
Figure 5. Response of E-cadherin to Spatial and Mechanical Perturbation with MPNs
(A) Subcellular localization of E-cadherin receptors (green) in U2OS cells by MPNs induces F-actin (red) recruitment. Scale bars, 5 μm and 2 μm (inset). (B–H) Force response of E-cadherin junction formation at the cell membrane. (B) Time-series of F-actin fluorescence images before and after force application by MPNs: (top) weak force (1 pN at d = 2.0 μm) or (bottom) strong (9 pN at d = 0.7 μm) force. Scale bar, 2 μm. (C) Outline of thresholding and segmentation algorithm used for analysis of actin recruitment and residual area. (D) Representative intensity trajectories of F-actin fluorescence within a 2 μm circle of tweezing area after removal of the weak- or strong-force mode tweezer. (E) Statistical residual intensity analysis of multiple replicates. (F) Representative time trajectories of F-actin area after either weak- or strong-force mode tweezer removal. (G) Statistical residual area analysis of multiple replicates. (H) Immunofluorescence staining for vinculin recruitment after weak or strong force application. Scale bar, 2 μm. **P < 0.01; ****P < 0.0001.
Figure 6
Figure 6. Spatial, Temporal, and Quantitative Control of Gene Transcription after Cell Stimulation with MPNs
(AC) Single cell kinetics of H2B-mCherry production in UAS-Gal4 reporter cells after MPN-induced Notch activation. (A) A representative fluorescence image and time trace. (B) Aggregates of multiple cell traces. (C) Statistical analysis of the mCherry production onset (ton) and rate (RmC). (D) Spatially-programmed Notch activation. (EF) Temporal control of Notch signaling. (E) Time series images and (F) mCherry fluorescence intensity trajectories of three randomly chosen cells (a, b, c) in a population after sequential stimulation with time intervals of 2 h. (GI) Quantitative control of cell signaling. (G) Representative images, (H) time traces of the cells, and (I) statistical analysis of the production rate with multiple replicates of three randomly chosen cells in a population after stimulation with tweezer application durations of 5 min (cell d), 10 min (cell e), and 20 min (cell f), respectively. Scale bars, 30 μm. RFU: relative fluorescence unit. *P < 0.05; ***P < 0.001.

Comment in

References

    1. Banghart M, Borges K, Isacoff E, Trauner D, Kramer RH. Light-activated ion channels for remote control of neuronal firing. Nat Neurosci. 2004;7:1381–1386. - PMC - PubMed
    1. Bharde AA, Palankar R, Fritsch C, Klaver A, Kanger JS, Jovin TM, Arndt-Jovin DJ. Magnetic nanoparticles as mediators of ligand-free activation of EGFR signaling. PLoS ONE. 2013;8:e68879. - PMC - PubMed
    1. Biswas KH, Hartman KL, Yu CH, Harrison OJ, Song H, Smith AW, Huang WYC, Lin WC, Guo Z, Padmanabhan A, et al. E-cadherin junction formation involves an active kinetic nucleation process. Proc Natl Acad Sci USA. 2015;112:10932–10937. - PMC - PubMed
    1. Buckley CD, Tan J, Anderson KL, Hanein D, Volkmann N, Weis WI, Nelson WJ, Dunn AR. The minimal cadherin-catenin complex binds to actin filaments under force. Science. 2014;346:1254211–1254211. - PMC - PubMed
    1. Cho MH, Lee EJ, Son M, Lee JH, Yoo D, Kim JW, Park SW, Shin JS, Cheon J. A magnetic switch for the control of cell death signalling in in vitro and in vivo systems. Nat Mater. 2012;11:1038–1043. - PubMed

Publication types