. 2016 Jun 16;165(7):1803-1817.
doi: 10.1016/j.cell.2016.04.044. Epub 2016 May 12.

High-Throughput, High-Resolution Mapping of Protein Localization in Mammalian Brain by In Vivo Genome Editing

Affiliations

High-Throughput, High-Resolution Mapping of Protein Localization in Mammalian Brain by In Vivo Genome Editing

Takayasu Mikuni et al. Cell. .

Abstract

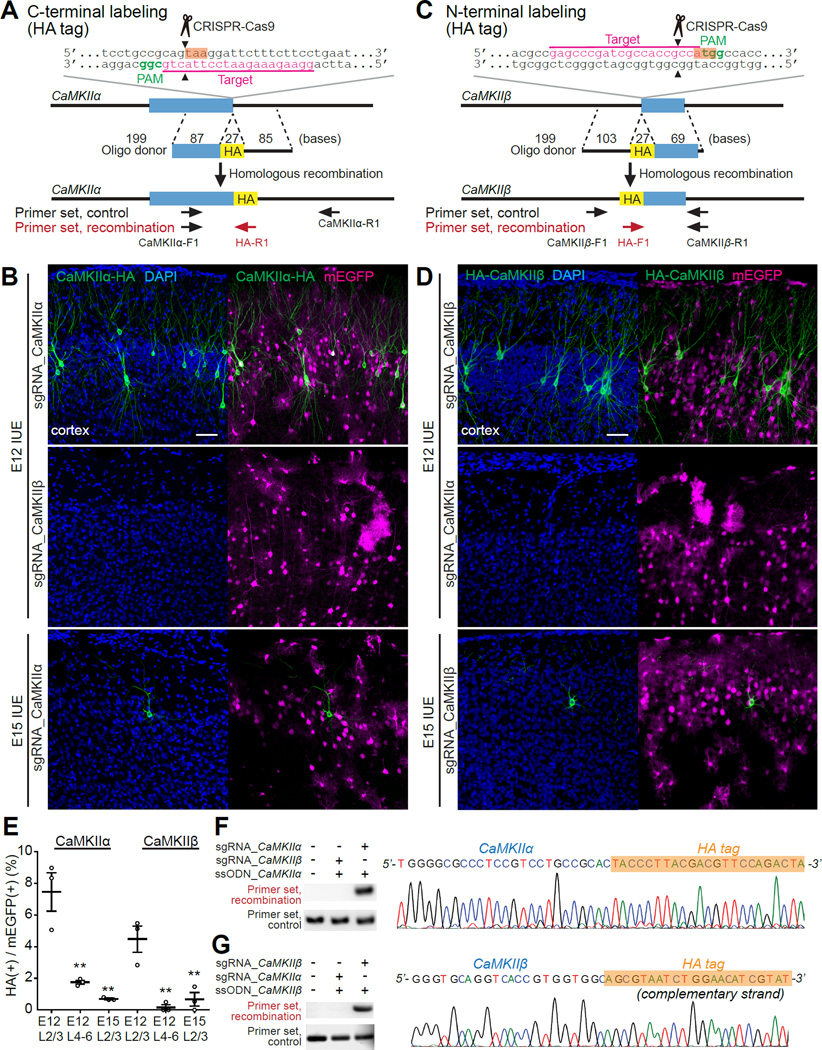
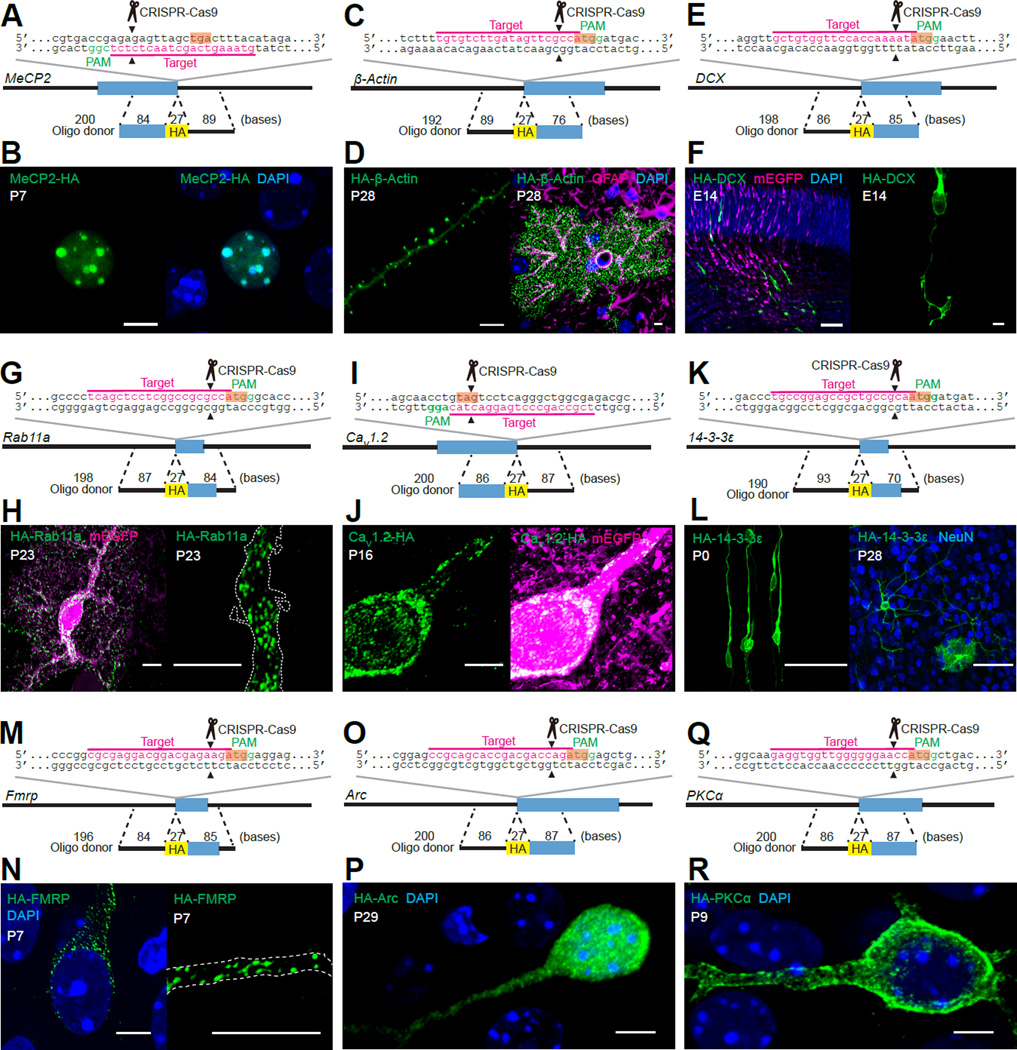
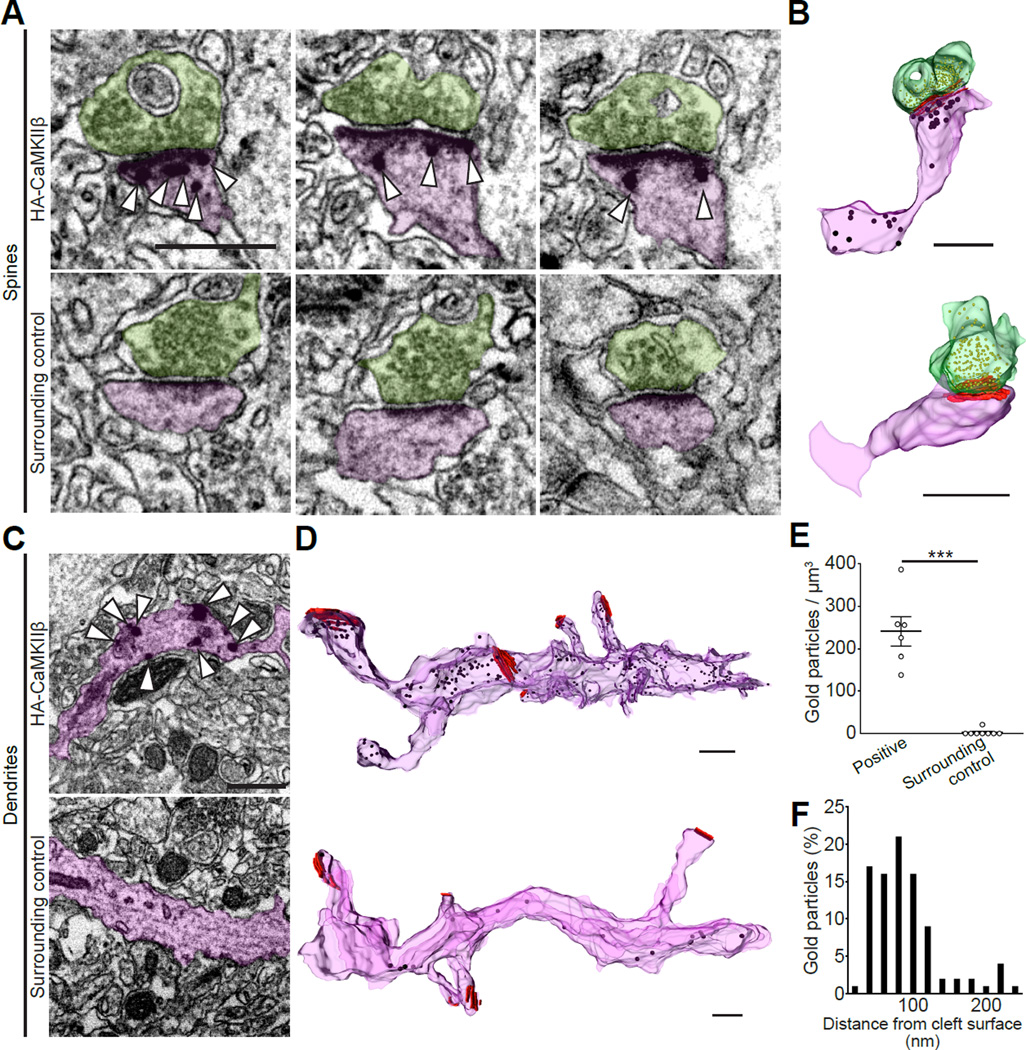
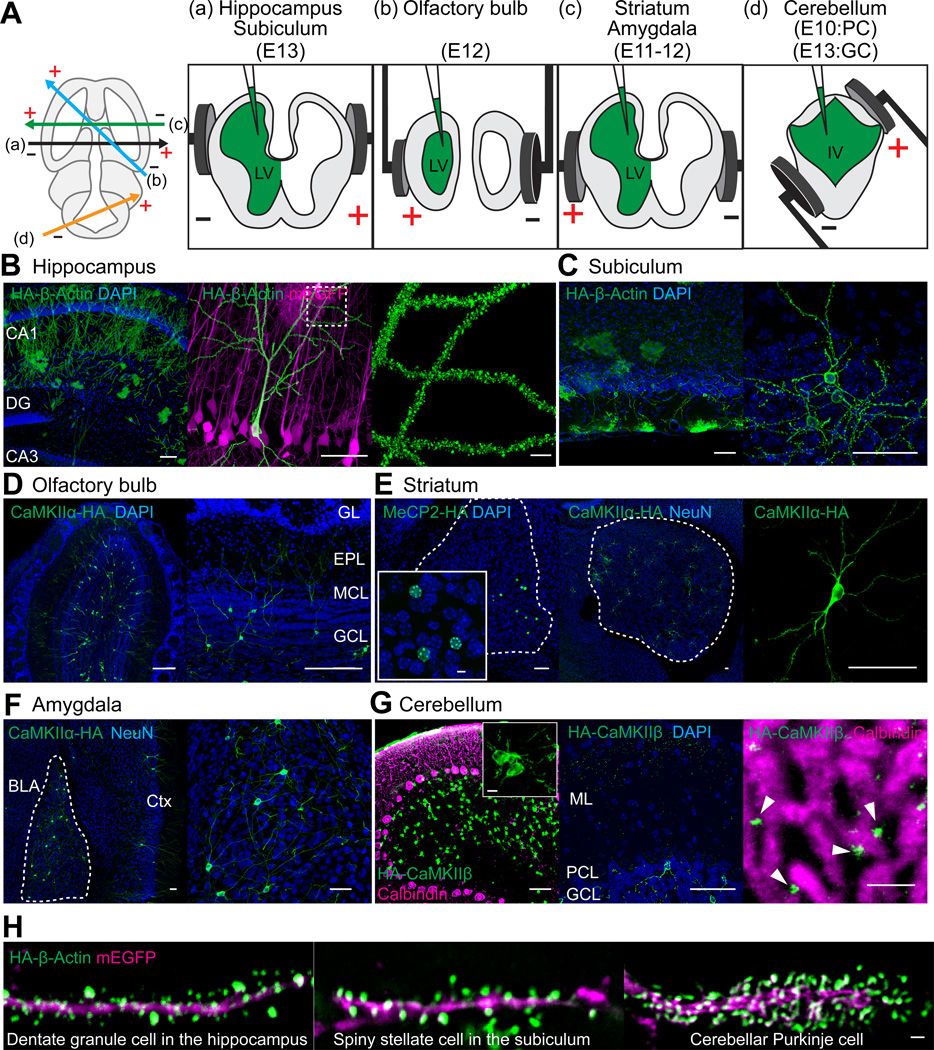
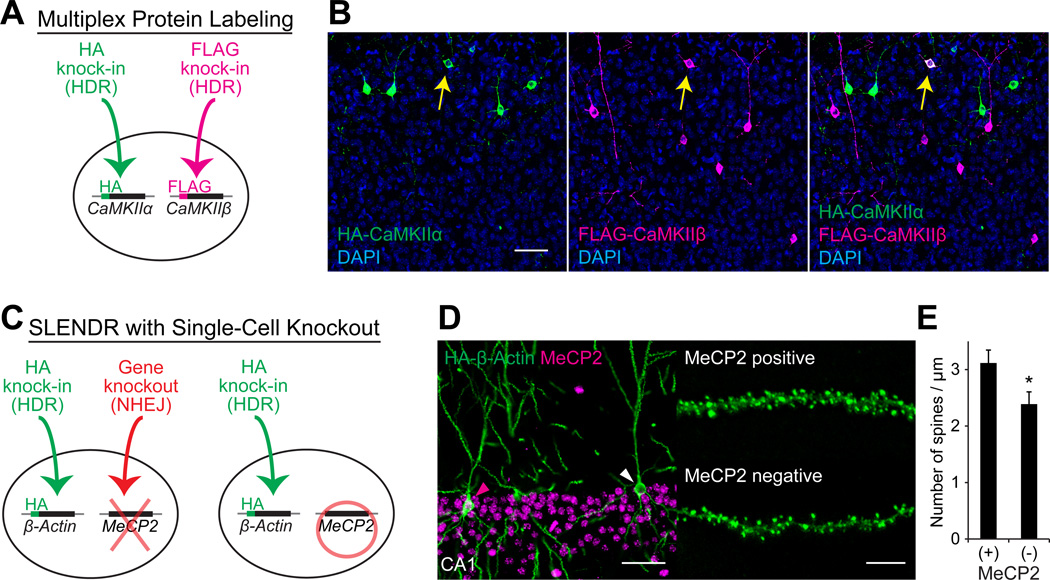
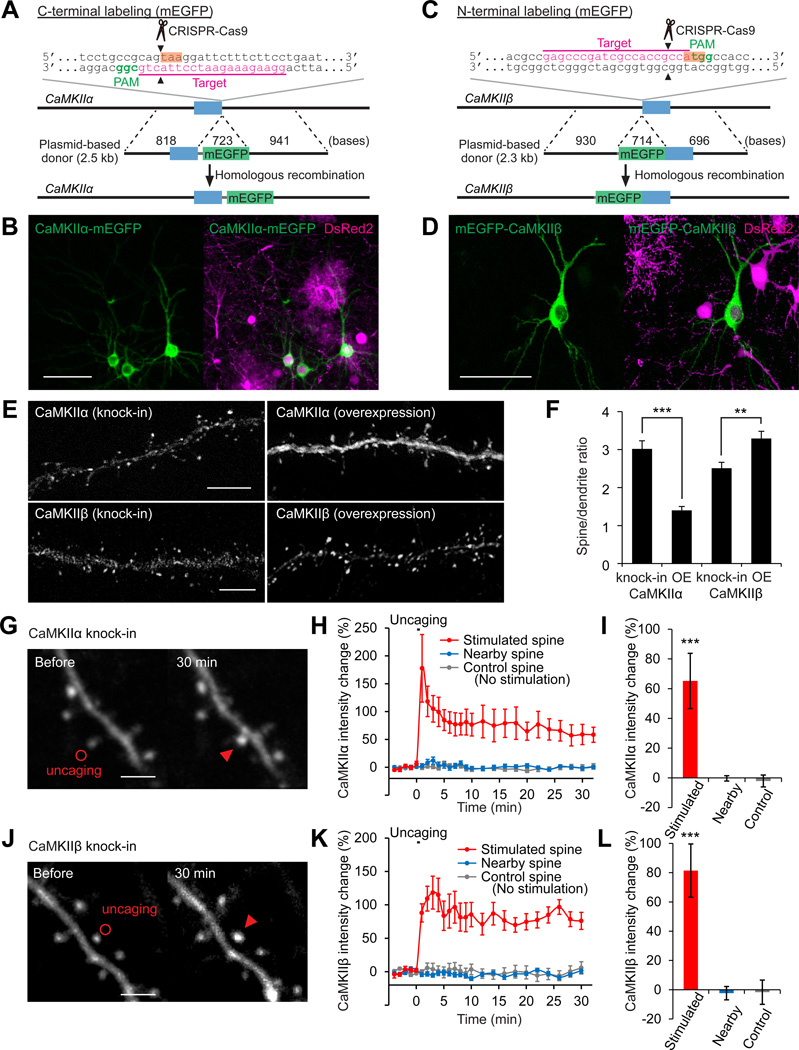
A scalable and high-throughput method to identify precise subcellular localization of endogenous proteins is essential for integrative understanding of a cell at the molecular level. Here, we developed a simple and generalizable technique to image endogenous proteins with high specificity, resolution, and contrast in single cells in mammalian brain tissue. The technique, single-cell labeling of endogenous proteins by clustered regularly interspaced short palindromic repeats (CRISPR)-Cas9-mediated homology-directed repair (SLENDR), uses in vivo genome editing to insert a sequence encoding an epitope tag or a fluorescent protein to a gene of interest by CRISPR-Cas9-mediated homology-directed repair (HDR). Single-cell, HDR-mediated genome editing was achieved by delivering the editing machinery to dividing neuronal progenitors through in utero electroporation. We demonstrate that SLENDR allows rapid determination of the localization and dynamics of many endogenous proteins in various cell types, regions, and ages in the brain. Thus, SLENDR provides a high-throughput platform to map the subcellular localization of endogenous proteins with the resolution of micro- to nanometers in the brain.


Figures

Figure 1
Figure 1. In Vivo Single-Cell Labeling of Endogenous Proteins by SLENDR
(A and C) Graphical representation of the mouse genomic loci of CaMKIIα (A) and CaMKIIβ (C) showing the target sites for Cas9, sgRNA and ssODNs. The sgRNA targeting sequences are underlined and labeled in magenta. The protospacer-adjacent motif (PAM) sequences are labeled in green. The stop and start codons of CaMKIIα (A) and CaMKIIβ (C), respectively, are marked in orange. The Cas9 cleavage sites are indicated by the black arrowheads. PCR primer sets (control and recombination) for PCR genotyping (E and F) are indicated by the arrows. (B and D) Confocal microscopic images of the cerebral cortex electroporated at E12 (top and middle) and E15 (bottom) showing the DAPI signal (blue) and immunoreactivities for mEGFP (magenta) and the HA tag (green) fused to the C-terminus of endogenous CaMKIIα (B) and N-terminus of endogenous CaMKIIβ (D). Middle panels show negative control experiments in which the sgRNA for CaMKIIα was paired with the ssODNs for CaMKIIβ (B) and vice versa (D). (E) The efficiency of SLENDR for CaMKIIα and CaMKIIβ (the ratio of the number of HA/mEGFP double-positive neurons to that of mEGFP positive neurons). CaMKIIα, E12 layer (L) 2/3, n = 545 neurons/3 mice; E12 L4–6, n = 275/3; E15 L2/3, n = 713/3. CaMKIIβ, E12 L2/3, n = 716/3; E12 L4-6, n = 379/3; E15 L2/3, n = 367/3. **p < 0.01, Dunnett test, in comparison with E12 L2/3. (F and G) (left) PCR genotyping using genomic DNA extracted from the electroporated brain. Recombination primer sets (top; F, CaMKIIα-F1 and HA-R1; G, HA-F1 and CaMKIIβ-R1) and control primer sets (bottom; F, CaMKIIα-F1 and CaMKIIα-R1; G, CaMKIIβ-F1 and CaMKIIβ-R1) were used for PCR. (right) DNA sequencing analysis of the PCR products for CaMKIIα-HA (F) and HA-CaMKIIβ (G). The HA tag sequence is marked in orange. Data are represented as mean ± SEM. Scale bars, 50 µm. See also Figure S1 and Tables S1–S3.
Figure 2
Figure 2. SLENDR is Scalable to Various Endogenous Proteins
(A, C, E, G, I, K, M, O and Q) Graphical representation of the mouse genomic loci of MeCP2 (A), β-Actin (C), DCX (E), Rab11a (G), CaV1.2 (I), 14-3-3ε (K), Fmrp (M), Arc (O) and PKCα (Q) showing the target sites for Cas9, sgRNA and ssODNs. The sgRNA targeting sequences are underlined and labeled in magenta. The PAM sequences are labeled in green. The stop (A and I) and start (C, E, G, K, M, O and Q) codons are marked in orange. The Cas9 cleavage sites are indicated by the black arrowheads. (B, F, H, J, N, P and R) Confocal microscopic images of the cerebral cortex showing the DAPI signal (blue) and immunoreactivities for mEGFP (magenta) and the HA tag (green) fused to the C-terminus of MeCP2 (B) and CaV1.2 (J) and the N-terminus of DCX (F), Rab11a (H), FMRP (N), Arc (P) and PKCα (R). The dashed line represents the shape of the dendrite (H and N). (D) Images of the cerebral cortex showing the DAPI signal (blue) and immunoreactivities for GFAP (magenta, an astrocyte marker) and the HA tag (green) fused to the N-terminus of β-Actin. (L) Images of the cerebral cortex at P0 and P28 showing immunoreactivities for NeuN (blue, a neuron marker) and the HA tag (green) fused to the N-terminus of 14-3-3 ε. Scale bars, 5 µm (B, D, F, right, H, J, N, P and R); 50 µm (F, left; L). See also Figures S2–S5 and Tables S1 and S3.
Figure 3
Figure 3. Nanometer-Scale Analysis of Endogenous Proteins by SLENDR
(A–D) Electron microscopic images of dendritic spines (A) and shafts (C) in the cerebral cortex showing immunogold labeling for the HA tag (arrowheads) fused to the N-terminus of CaMKIIβ in HA positive (top) and surrounding control (bottom) cells. Three-dimensional reconstructions of corresponding spines (B) and dendrites (D). Analyzed spines and dendrites are marked in purple and presynaptic terminals are marked in green. Presynaptic vesicles and postsynaptic densities are marked in yellow and red, respectively (B and D). (E) Density of immunogold particles in HA-positive spines (n = 6) and surrounding control spines (n = 8). ***p < 0.001, Student’s t test. (F) The frequency distribution of distances between individual gold particles and cleft surfaces (n = 92 particles/ 6 spines). Data are represented as mean ± SEM. Scale bars, 500 nm. See also Table S3.
Figure 4
Figure 4. SLENDR is Scalable to Various Cell Types in Various Brain Regions
(A) Schematic illustration of IUE for targeting distinct brain regions. The relative position of the electrodes (+, positive pole; −, negative pole) are shown in the transverse section of the brain to target different brain areas (left). The position of electrode paddles and the injected DNA (green) are shown in the coronal section of the brain to target hippocampus and subiculum (a), olfactory bulb (b), striatum and amygdala (c) and cerebellum (d). LV, lateral ventricle; IV, fourth ventricle; PC, Purkinje cell; GC, granule cell. (B) Confocal microscopic images of the hippocampus showing the DAPI signal (blue) and immunoreactivities for mEGFP (magenta) and the HA tag (green) fused to β-Actin. DG, dentate gyrus. (C–F) Images of the subiculum (C), olfactory bulb (D), striatum (E) and amygdala (F) showing the DAPI signal (C–E, blue) and immunoreactivities for NeuN (E, F, blue) and the HA tag (green) fused to β-Actin (C), CaMKIIα (D to F) and MeCP2 (E). GL, glomerular layer; EPL, external plexiform layer; MCL, mitral cell layer; GCL, granule cell layer; BLA, basolateral amygdala; Ctx, cerebral cortex. (G) Images of the cerebellum showing the DAPI signal (blue) and immunoreactivities for calbindin D-28k (magenta, a Purkinje cell marker) and the HA tag (green) fused to CaMKIIβ. ML, molecular layer; PCL, Purkinje cell layer; GCL, granule cell layer. (H) Images of the dendrites of a dentate granule cell in the hippocampus, a spiny stellate cell in the subiculum and a Purkinje cell in the cerebellum showing immunoreactivities for mEGFP (magenta) and the HA tag (green) fused to β-Actin. Scale bars, 50 µm (B–G); 5 µm (B, right; E, inset; G, inset and right); 1 µm (H). See also Tables S2 and S3.
Figure 5
Figure 5. Application of SLENDR by Multiplex Genome Editing
(A) Schematics of multiplex labeling of different endogenous proteins with different tags. The HA and FLAG sequences are inserted to CaMKIIα and CaMKIIβ, respectively, in the same cell through HDR-mediated genome editing. (B) Multiplex labeling of endogenous CaMKIIα and CaMKIIβ. Confocal microscopic images of the cerebral cortex at P14 showing the DAPI signal (blue) and immunoreactivities for the HA tag (green) and the FLAG tag (magenta) fused to the N-terminus of endogenous CaMKIIα and CaMKIIβ, respectively. The yellow arrows indicate HA and FLAG double-positive layer 2/3 neurons. (C) Schematics of combining SLENDR with NHEJ-mediated gene knockout. The HA sequence is inserted to β-Actin through HDR-mediated genome editing and a frame-shift mutation is induced in MeCP2 through NHEJ-mediated genome editing in the same cell (left). In our strategy, some cells in the same tissue undergo only HDR-mediated genome editing (right), allowing comparison of the expression and localization of endogenous proteins within the same brain slice. (D) Immunofluorescence images of MeCP2 (magenta) and HA-β-Actin (green) in the hippocampus CA1 region. Magenta arrowhead, MeCP2-positive; white arrowhead, MeCP2-negative. Representative images of secondary dendrites of MeCP2-positive and negative neurons (right). (E) The averaged density of spines on secondary or tertiary apical dendrites in MeCP2-positive (n = 527 spines/ 6 neurons) and negative (n = 437/5) neurons. *p < 0.05, Student’s t test. Data are represented as mean ± SEM. Scale bars, 50 µm (B and D, left); 5 µm (D, right). See also Table S3.
Figure 6
Figure 6. Localization and Dynamics of Endogenous Proteins Labeled with mEGFP by SLENDR
(A and C) Graphical representation of the mouse genomic loci of CaMKIIα (A) and CaMKIIβ (C) showing the targeting sites for Cas9, sgRNA and HDR donor plasmid. The sgRNA targeting sequences are underlined and labeled in magenta. The PAM sequences are labeled in green. The stop and start codons of CaMKIIα (A) and CaMKIIβ (C) are marked in orange. (B and D) Confocal microscopic images of the somatosensory cortex showing the fluorescence of DsRed2 (magenta) and mEGFP (green) fused to CaMKIIα/β. (E) Images of apical secondary dendrites in layer 2/3 fixed at P14 showing mEGFP-tagged endogenous (knock-in) or overexpressed (OE) CaMKIIα/β. (F) The spine/dendrite ratio of the peak intensities of mEGFP-tagged CaMKIIα/β. CaMKIIα, knock-in, n = 51/6 (spines/neurons); OE, n = 40/5. CaMKIIβ, knock-in, n = 58/4; OE, n = 83/5. (G-L) Two-photon microscopic images before and 30 min after glutamate uncaging showing mEGFP-tagged endogenous CaMKIIα/β in layer 2/3 neurons (G and J). Red circles, uncaging spots; red arrowheads, stimulated spines. Averaged time courses (H and K) and sustained values (I and L; averaged over 20–30 min) of CaMKIIα/β intensity change in the stimulated (red; H and I, n = 11/8; K and L, n =9/7), nearby (2–5 µm from the stimulated spines; blue; H and I, n = 31/8; K and L, n =31/7) and control spines with no stimulation (grey; H and I, n = 23/5; K and L, n =13/2). ***p < 0.001, Student’s t test (F) and Dunnett test (I and L). Data are represented as mean ± SEM. Scale bars, 50 µm (B and D); 5 µm (E); 2 µm (G and J). See also Figure S6 and Table S3.

Similar articles

Cited by

References

    1. Borrell V, Yoshimura Y, Callaway EM. Targeted gene delivery to telencephalic inhibitory neurons by directional in utero electroporation. J Neurosci Methods. 2005;143:151–158. - PubMed
    1. Bosch M, Castro J, Saneyoshi T, Matsuno H, Sur M, Hayashi Y. Structural and molecular remodeling of dendritic spine substructures during long-term potentiation. Neuron. 2014;82:444–459. - PMC - PubMed
    1. Chen F, LoTurco J. A method for stable transgenesis of radial glia lineage in rat neocortex by piggyBac mediated transposition. J Neurosci Methods. 2012;207:172–180. - PMC - PubMed
    1. Chen RZ, Akbarian S, Tudor M, Jaenisch R. Deficiency of methyl-CpG binding protein-2 in CNS neurons results in a Rett-like phenotype in mice. Nat Genet. 2001;27:327–331. - PubMed
    1. Chu VT, Weber T, Wefers B, Wurst W, Sander S, Rajewsky K, Kuhn R. Increasing the efficiency of homology-directed repair for CRISPR-Cas9-induced precise gene editing in mammalian cells. Nat Biotechnol. 2015;33:543–548. - PubMed

Publication types

Substances