. 2016 May 16:7:11556.
doi: 10.1038/ncomms11556.

Iso-acoustic focusing of cells for size-insensitive acousto-mechanical phenotyping

Affiliations

Iso-acoustic focusing of cells for size-insensitive acousto-mechanical phenotyping

Per Augustsson et al. Nat Commun. .

Abstract

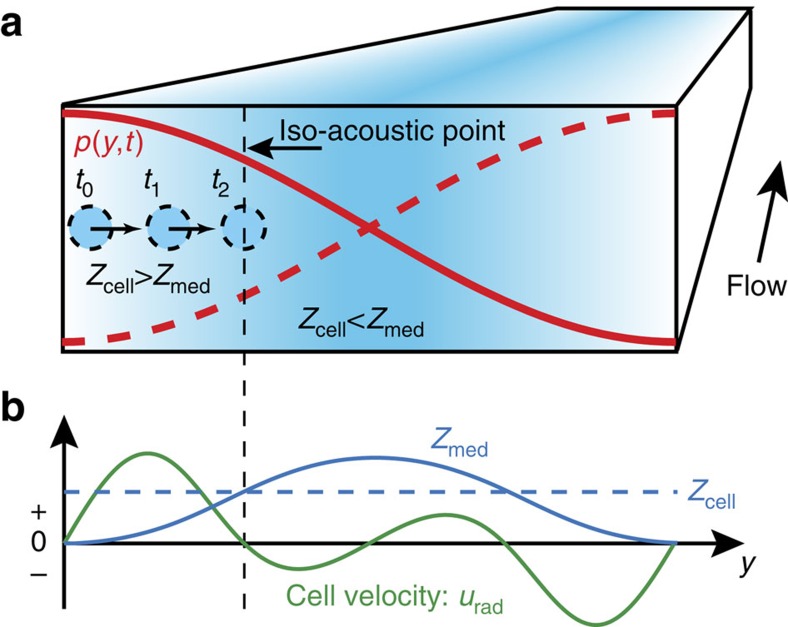
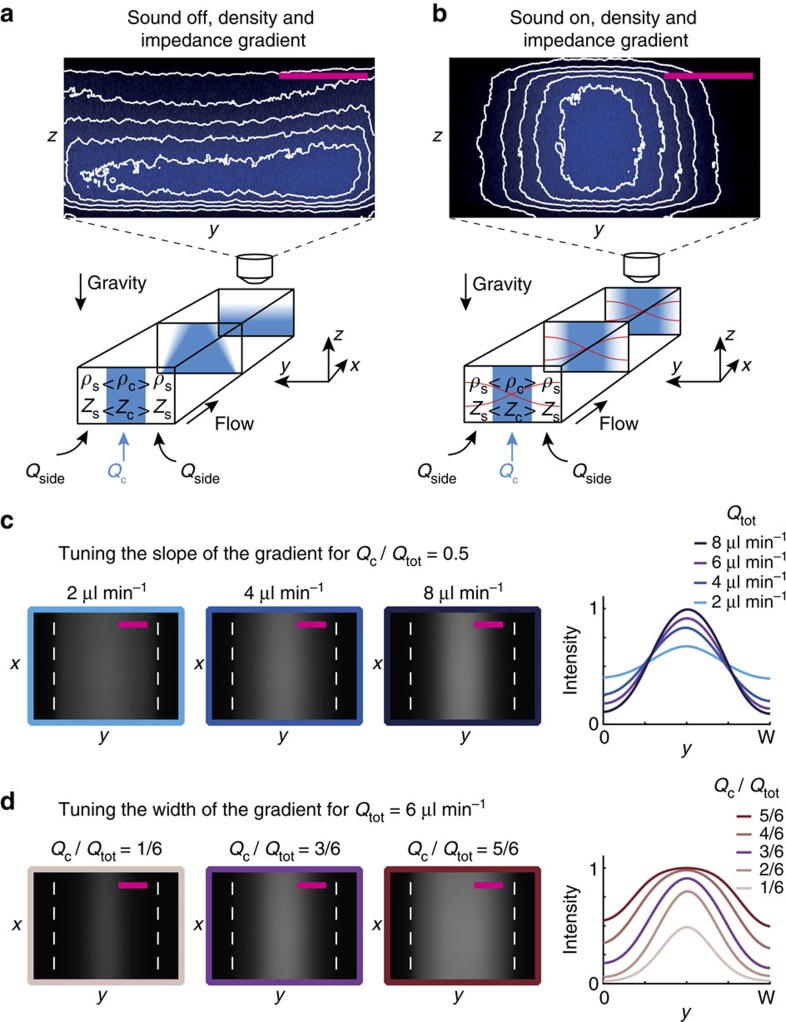
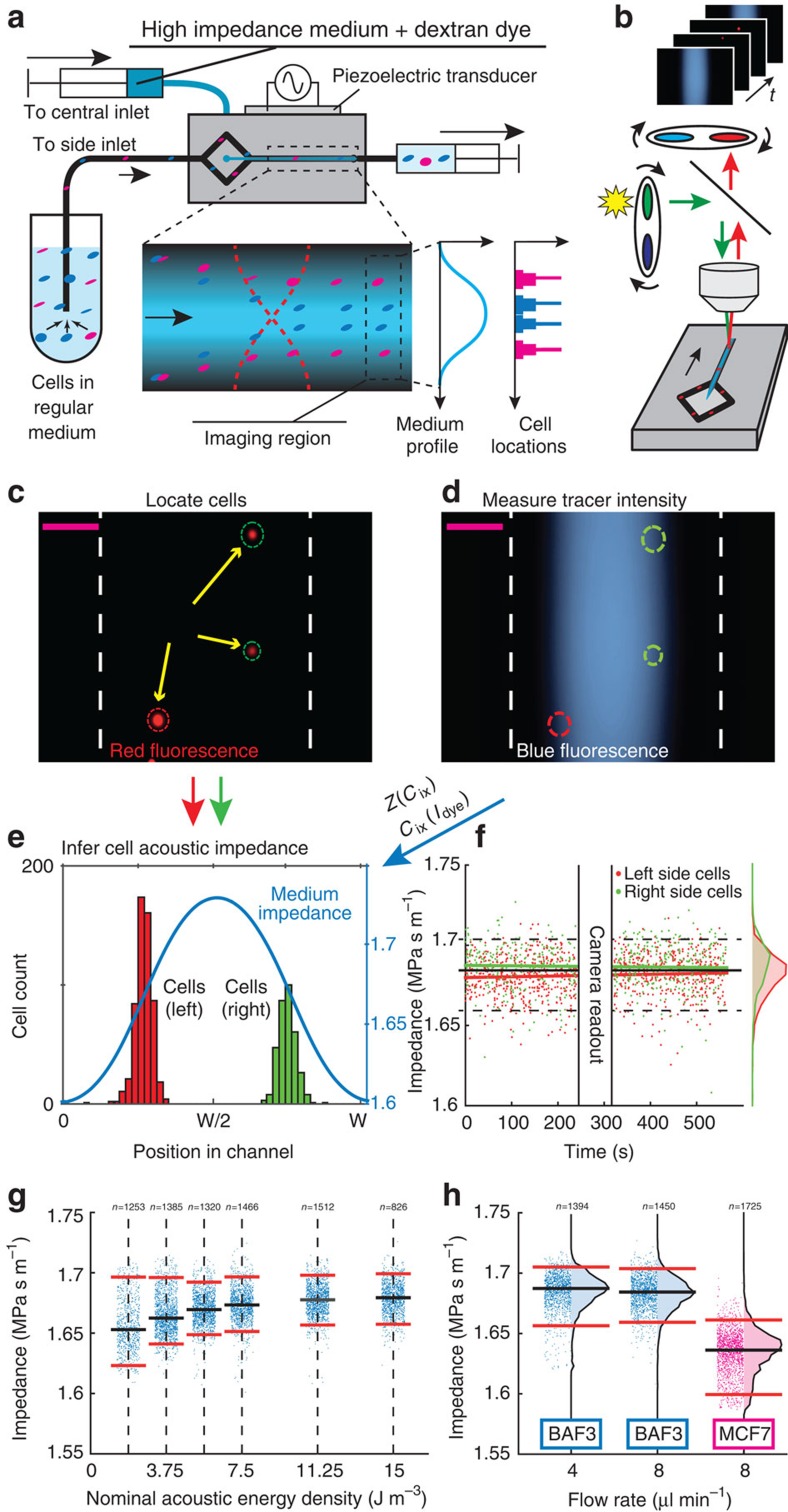
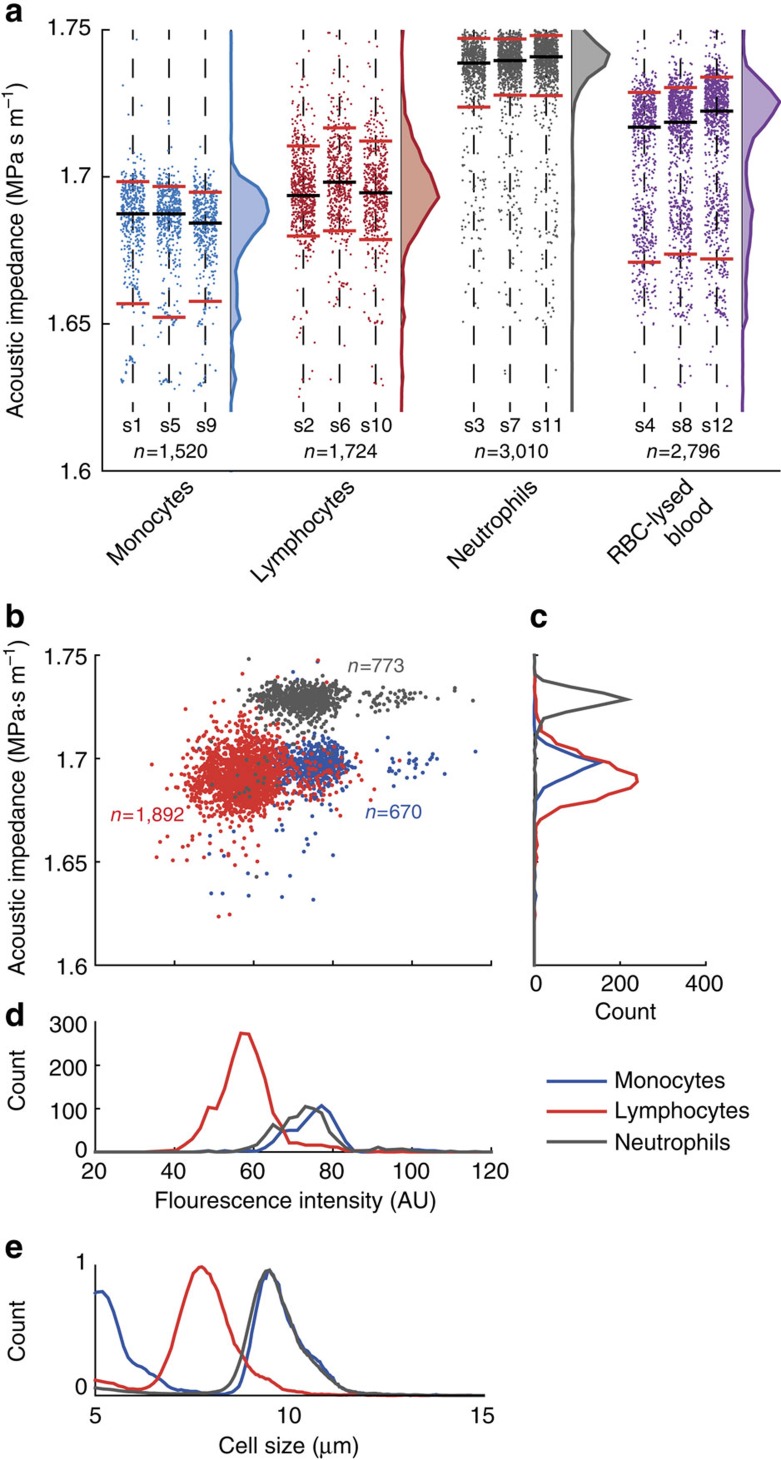
Mechanical phenotyping of single cells is an emerging tool for cell classification, enabling assessment of effective parameters relating to cells' interior molecular content and structure. Here, we present iso-acoustic focusing, an equilibrium method to analyze the effective acoustic impedance of single cells in continuous flow. While flowing through a microchannel, cells migrate sideways, influenced by an acoustic field, into streams of increasing acoustic impedance, until reaching their cell-type specific point of zero acoustic contrast. We establish an experimental procedure and provide theoretical justifications and models for iso-acoustic focusing. We describe a method for providing a suitable acoustic contrast gradient in a cell-friendly medium, and use acoustic forces to maintain that gradient in the presence of destabilizing forces. Applying this method we demonstrate iso-acoustic focusing of cell lines and leukocytes, showing that acoustic properties provide phenotypic information independent of size.


Conflict of interest statement

Although not closely related to the herein presented results P.A. declares part-time activity as a consultant in acoustofluidic research and development.

Figures

Figure 1
Figure 1. The IAF principle.
(a) Cells (circles) flowing in a microchannel are deflected sideways towards the node of an acoustic resonant pressure field p (red curves) in a medium of position-dependent acoustic impedance Zmed (color plot from low (white) to high (blue)). (b) Conceptual plot showing that when the acoustic impedance Zcell (dashed blue line) of a given cell matches Zmed (full blue line) at the IAP, its transverse velocity urad (green line) becomes zero so that its position along y reflects its individual effective acoustic impedance.
Figure 2
Figure 2. Controlling the acoustic contrast of BA-F3 cells by altering the acoustic properties of the suspending medium.
Fraction of cells exhibiting Positive, Negative or Zero contrast based on multi frame trajectory analysis. Unknown refers to cell trajectories that did not match any of the other categories. n refers to number of cell tracks, with a minimum five onsets of sound.
Figure 3
Figure 3. Tailoring smooth acoustic impedance gradients.
(a and b) Confocal cross sectional y-z scans recorded 20 mm downstream from the inlet, of the fluorescent dextran tracer gradient (blue color plot) in the case of (a) an iodixanol gradient and no sound, and (b) an iodixanol gradient and sound (red lines), along with schematic interpretations of the data. (c) Top views of the fluorescent dextran tracer gradient imaged with epifluorescence microscopy at different volume flow rates Qtot. The graph shows the corresponding normalized fluorescence intensity profiles versus y averaged along the flow direction x. (d) Top view epifluorescence images when varying the relative flow rate in the central Qc and side inlets while maintaining a constant overall flow rate Qtot and the corresponding normalized fluorescence intensity profiles. Scale bars (magenta) are 100 μm.
Figure 4
Figure 4. IAF cell measurements.
(a) Schematic of the system. (b-e) The acoustic impedance gradient is inferred via (b) sequential imaging at the end of the channel of (c) cells and (d) the fluorescent dextran tracer gradient. Scale bars (magenta) are 100 μm. (e) Standard solutions of iodixanol and dextran dye were analyzed to convert from fluorescence intensity to acoustic impedance. (f) Scatter plot during 500 s of the inferred acoustic impedance Zcell of BA-F3 cells (n=1,450) passing the imaging region in both sides of the device. The red and green lines show the linear least square fits. The solid black horizontal line shows the median of all cells and the dashed lines show the 5th and 95th percentiles. (g) Scatter plots of Zcell for BA-F3 (n=7,762) for six values of the acoustic energy density. (h) Scatter plots of Zcell for BA-F3 cells at flow rates 4 μl min−1 (n=1,394) and 8 μl min−1 (n=1,450) and for MCF7 cells at 8 μl min−1 (n=1,725). Black horizontal lines show median and red lines show the 5th and 95th percentiles.
Figure 5
Figure 5. The effective acoustic impedance of white blood cells as measured by their IAP in an iodixanol gradient.
(a) Scatter plots containing 9050 data points of subsequent measurements of pre-enriched monocytes (blue), lymphocytes (red) and neutrophils (gray) isolated by negative depletion, and of white blood cells isolated by RBC-lysis of whole blood from a single donor. Labels s1 to s12 indicate the order of the sample analysis. Distributions show the sum of all measured cells for the three repeats. Black horizontal lines show the median and red lines show the 5th and 95th percentiles. (b) Scatter plots of the measured effective acoustic impedance vs fluorescence intensity of pre-enriched monocytes, lymphocytes and neutrophils from a second donor, and the distributions of (c) the effective acoustic impedance and (d) fluorescence intensity. (e) Size distributions of monocytes, lymphocytes and neutrophils as measured independently based on electrical resistance sizing (Coulter-counter).

References

    1. Otto O. et al.. Real-time deformability cytometry: on-the-fly cell mechanical phenotyping. Nat. Methods 12, 199–202 (2015). - PubMed
    1. Ozkumur E. et al.. Inertial focusing for tumor antigen-dependent and -independent sorting of rare circulating tumor cells. Sci. Transl. Med. 5, 179ra147 (2013). - PMC - PubMed
    1. Darling E. M. & Di Carlo D. High-throughput assessment of cellular mechanical properties. Annu. Rev. Biomed. Eng. 17, 35–62 (2015). - PMC - PubMed
    1. Davis J. A. et al.. Deterministic hydrodynamics: taking blood apart. Proc. Natl Acad. Sci. USA 103, 14779–14784 (2006). - PMC - PubMed
    1. Grover W. H. et al.. Measuring single-cell density. Proc. Natl Acad. Sci. USA 108, 10992–10996 (2011). - PMC - PubMed

Publication types