. 2016 Jun 1;90(5):969-83.
doi: 10.1016/j.neuron.2016.04.015. Epub 2016 May 12.

Circuit-wide Transcriptional Profiling Reveals Brain Region-Specific Gene Networks Regulating Depression Susceptibility

Affiliations

Circuit-wide Transcriptional Profiling Reveals Brain Region-Specific Gene Networks Regulating Depression Susceptibility

Rosemary C Bagot et al. Neuron. .

Abstract

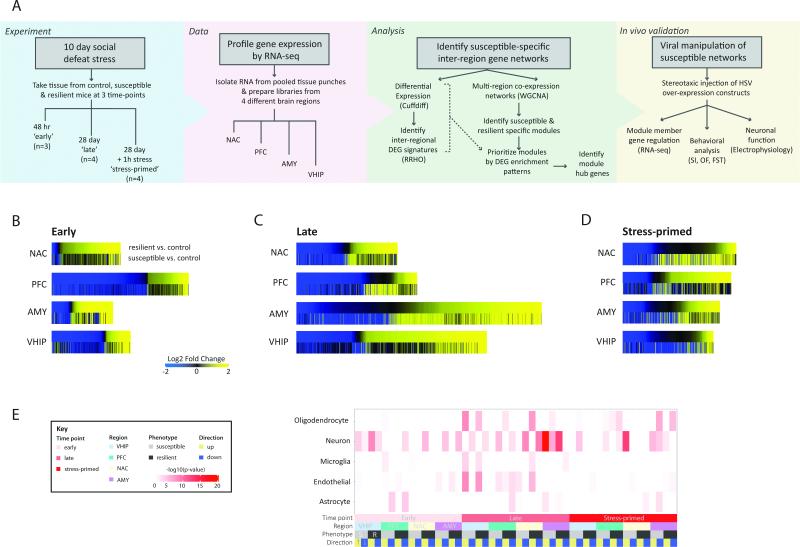
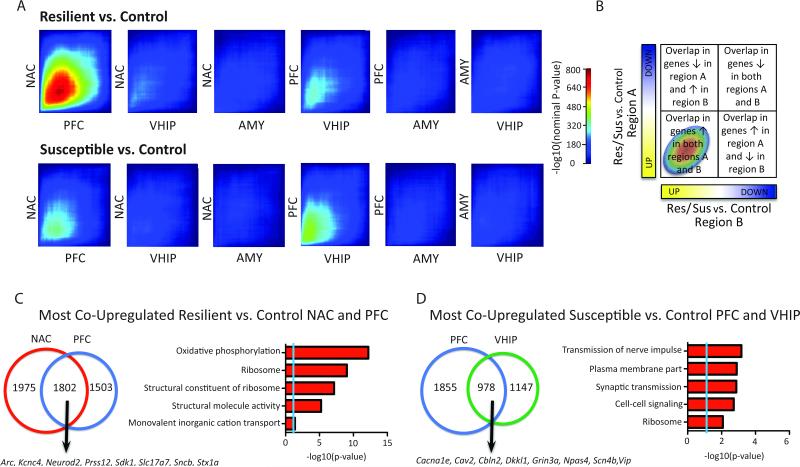
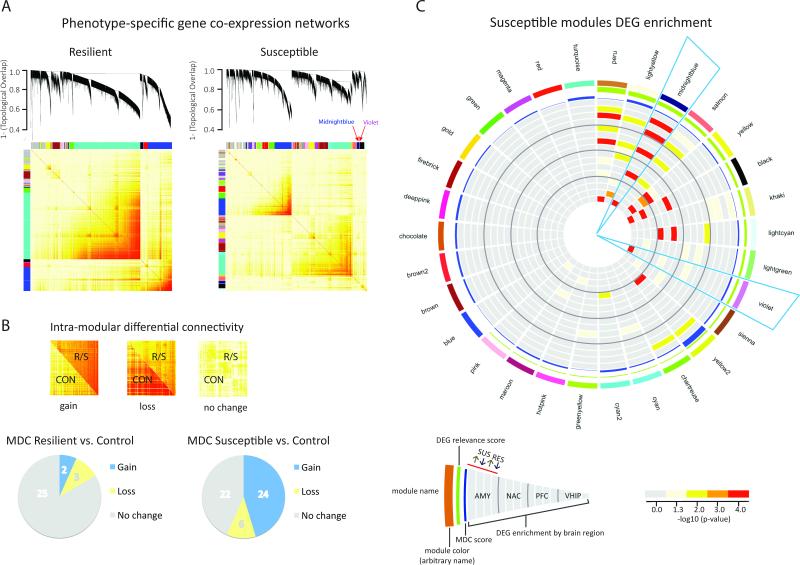
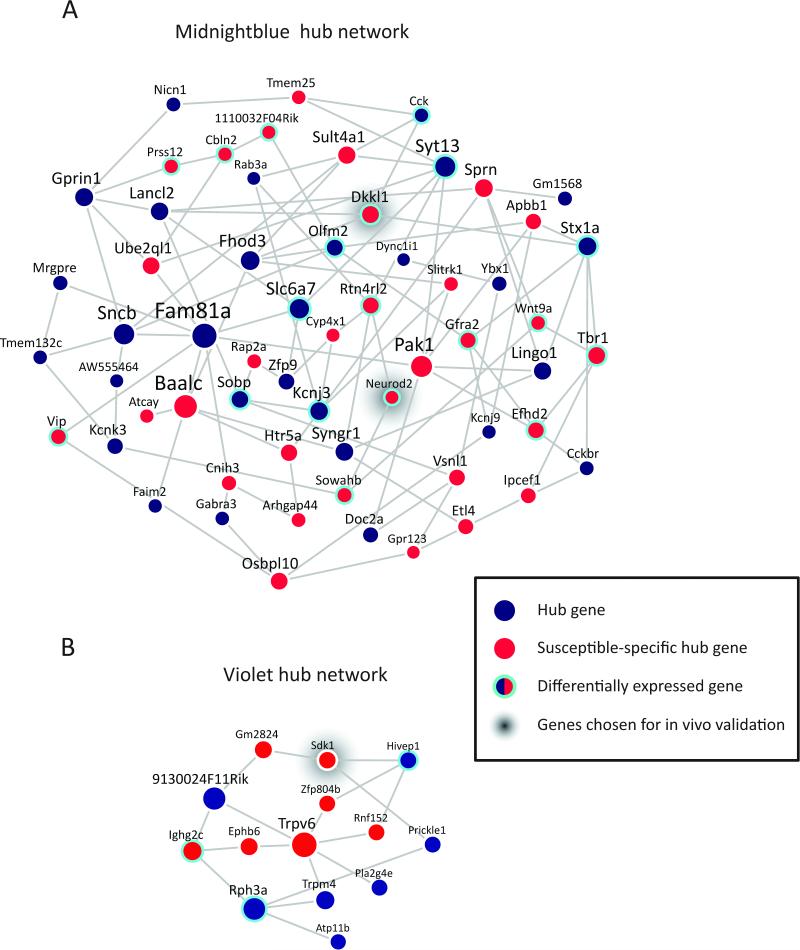
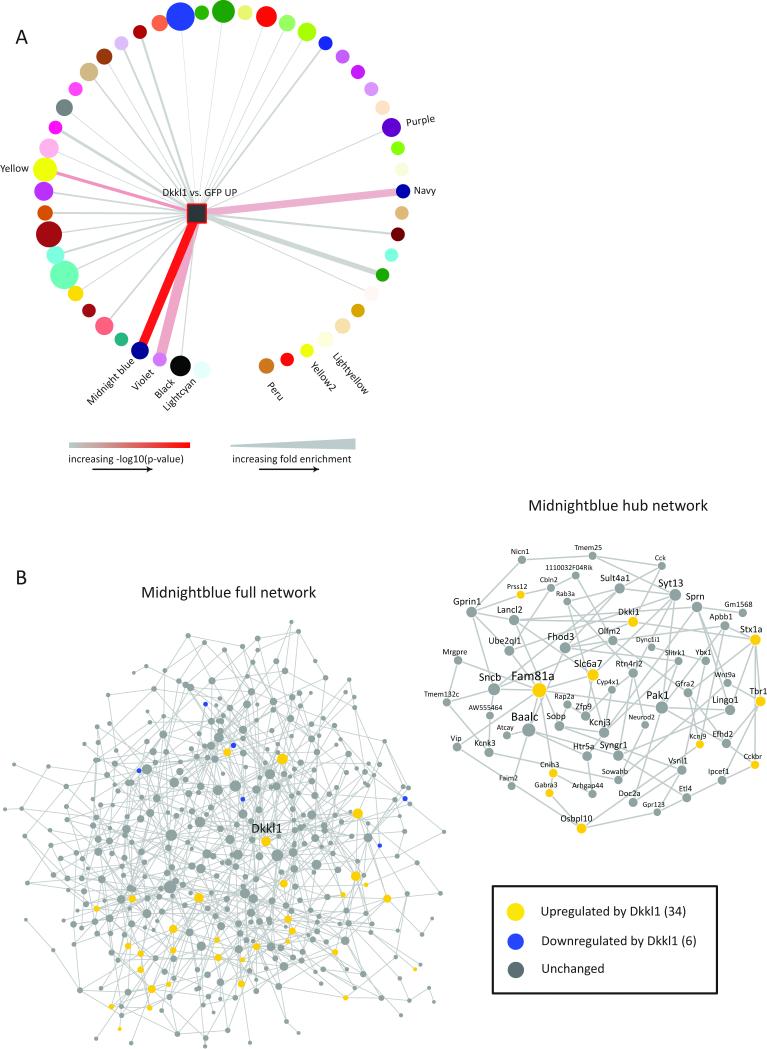
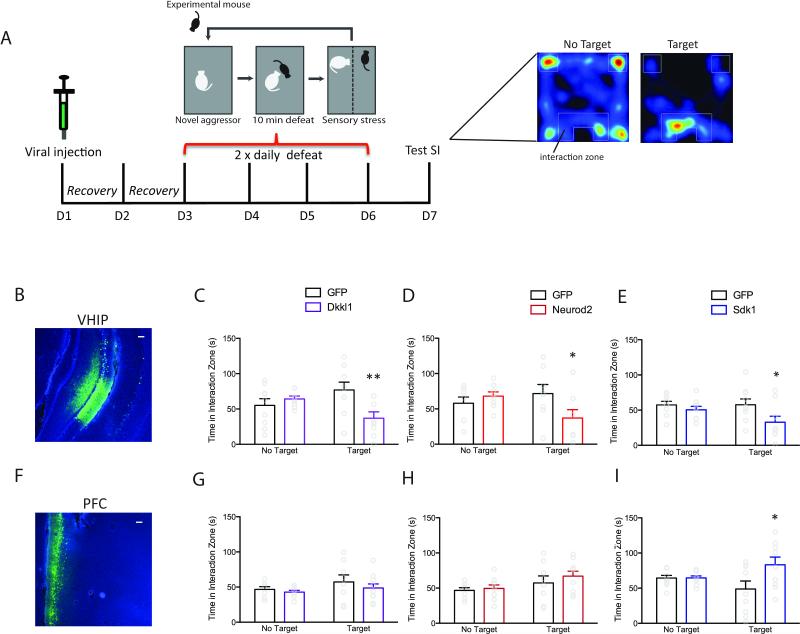
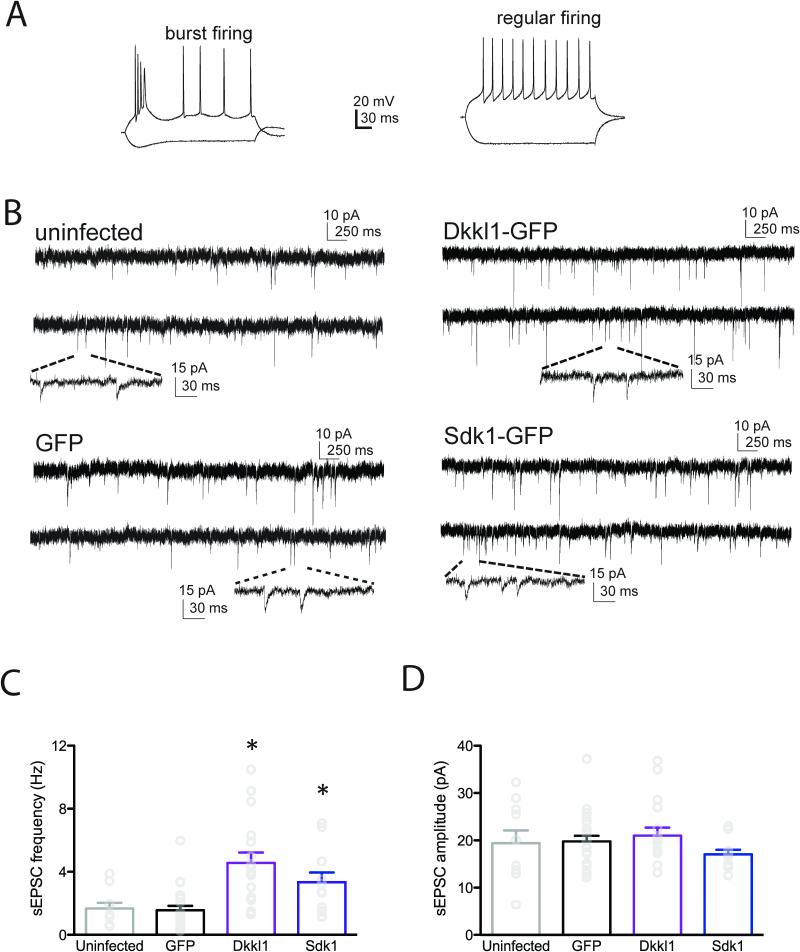
Depression is a complex, heterogeneous disorder and a leading contributor to the global burden of disease. Most previous research has focused on individual brain regions and genes contributing to depression. However, emerging evidence in humans and animal models suggests that dysregulated circuit function and gene expression across multiple brain regions drive depressive phenotypes. Here, we performed RNA sequencing on four brain regions from control animals and those susceptible or resilient to chronic social defeat stress at multiple time points. We employed an integrative network biology approach to identify transcriptional networks and key driver genes that regulate susceptibility to depressive-like symptoms. Further, we validated in vivo several key drivers and their associated transcriptional networks that regulate depression susceptibility and confirmed their functional significance at the levels of gene transcription, synaptic regulation, and behavior. Our study reveals novel transcriptional networks that control stress susceptibility and offers fundamentally new leads for antidepressant drug discovery.


Figures

Figure 1
Figure 1. Overview of Experimental Design and Differential Gene Expression in Susceptible and Resilient Mice after CSDS
(A) After CSDS 4 brain regions were collected at 3 post-defeat time-points (‘early’: 48h; ‘late’: 28d; ‘stress-primed’: 28d + 1 h post stress) for transcriptional profiling to identify expression networks underlying susceptible and resilient phenotypic adaptations to stress. Schematic diagram of experimental approach. (B-D) Union heatmaps show FC of all genes significantly differentially expressed (FC>1.3, p<0.05) in either comparison for resilient vs. control (R vs. C; top panel) or susceptible vs. control (S vs. C; lower panel) rank ordered by fold change in the R vs. C comparison in NAC, PFC, AMY and VHIP early (B), late, and stress-primed (D) scaled by number of DEGs. (E) Matrix summarizes enrichment of oligodendrocyte, neuron, microglia, endothelial or astrocyte genes (Zhang et al., 2014) in DEGs upregulated (yellow) and downregulated (blue) in R vs. C (dark grey) and S vs. C (light grey) conditions, early (light pink), late (dark pink) and stress-primed (red) in AMY (purple), NAC (cream), PFC (green), and VHIP (lightblue). Darker color indicates increasing –log10(p-value). See also Figure S1 and Table S1.
Figure 2
Figure 2. Inter-Regional Differential Expression Patterns Reveal Resilient- and Susceptible-Specific Co-Upregulation Signatures
(A) RRHO maps compare threshold-free differential expression between pairs of brain regions in the resilient (R vs. C; upper panel) or susceptible (S vs. C; lower panel) transcriptome 48h post-CSDS. Each pixel represents the overlap between the resilient/ susceptible transcriptome of 2 brain regions (NAC, PFC, AMY, VHIP) with the significance of overlap (−log10(p-value) of a hypergeometric test; step size 200) color coded. The extent of overlap of upregulated genes is displayed in the bottom left corner, and in the top right the overlap of downregulated genes, illustrated in (B). Venn diagrams display the extent of overlap between genes upregulated in (C) NAC and PFC in resilient mice and (D) PFC and VHIP in susceptible mice, enriched gene ontology terms and examples of co-upregulated genes. See also Figure S2.
Figure 3
Figure 3. Identification of Resilient- and Susceptible-Specific Coexpression Networks and Key Modules
(A) Multi-region coexpression network analysis identified coexpressed modules in resilient (left panel) and susceptible (right panel) mice across brain regions (NAC, PFC, AMY, VHIP) and time (early, late, stress-primed). Each module is arbitrarily assigned a unique color identifier, in bars on the left and top of each topological overlap matrix (TOM; lower panel). Increasing color intensity from white to dark red in TOM corresponds to increasing coexpression-based topological overlap. Dendograms (upper panel) show average linkage hierarchical clustering of genes. (B) Intra-modular connectivity of resilient and susceptible network modules was compared to that of corresponding genes in control mice to identify gain, loss or no change (upper panel). Pie charts (lower panel) summarize module differential connectivity (MDC) analysis. Proportionally, very few resilient modules (left panel) had significant MDC compared to more than half of all susceptible modules, which predominantly showed gain of connectivity. See also Figure S3. (C) Circos plot shows module name (ring 1), color (ring 2), differential expression relevance score (ring 3), and MDC score; increasing bar height shows increasing score (ring 4). Bar color indicates significance of enrichment for genes significantly up- or downregulated 48h post-defeat in R vs. C (RES) and S vs. C (SUS) with increasingly warm colors indicating increasing –log10(p-value). MB and V modules show gain of connectivity relative to controls and are enriched for genes that show opposing patterns of differential expression in PFC and NAC vs. VHIP. AMY SUS up (ring 5), AMY SUS down (ring 6), AMY RES up (ring 7), AMY RES down (ring 8), NAC SUS up (ring 9), NAC SUS down (ring 10), NAC RES up (ring 11), NAC RES down (ring 12), PFC SUS up (ring 13), PFC SUS down (ring 14), PFC RES up (ring 15), PFC RES down (ring 16), VHIP SUS up (ring 17), VHIP SUS down (ring 18), VHIP RES up (ring 19), VHIP RES down (ring 20). See also Figure S3 and Table S3.
Figure 4
Figure 4. Hub Gene Coexpression Networks of MB and V Modules in Susceptible Mice
(A) Network plot of hub genes within MB module. (B) Network plot of hub genes identified within V module. Node size is proportional to node's network centrality. Blue nodes indicate hub genes, red nodes indicate susceptible-specific hub genes and cyan halos indicate differential expression of a gene early post-defeat in at least 1 brain region. Edges reflect significant interactions between genes based on mutual information. Early post-defeat, Dkkl1 was differentially expressed in PFC (increased in R vs. C) and AMY (decreased in both S vs. C and R vs. C), and Neurod2 was differentially expressed in NAC (increased in R vs. C) early post-defeat, whereas Sdk1 was not differentially expressed in any region. See also Figure S4 and Table S5.
Figure 5
Figure 5. In Vivo Over-Expression of Susceptible-Specific Hub Gene, Dkkl1, Upregulates MB Module Members
Differential expression analysis identified 108 genes upregulated and 1075 genes downregulated in VHIP in HSV-Dkkl1-GFP vs. HSV-GFP at p<0.05, FC>1.3. (A) DEGs upregulated by Dkkl1 over-expression (yellow square) were significantly enriched in MB. Upregulated DEGs also enriched in V, Yellow and Navy. Increasing edge width indicates increasing fold enrichment (min=0, max=10). Increasing color gradient (grey to red) indicates increasing –log10(p-value) (min=0, max=21). Circle/square size indicates \ module size. (B) DEGs upregulated by Dkkl1 over-expression enriched in the MB network; left panel full MB network, right panel MB hub genes (see also Figure 5A). Yellow circles: genes upregulated by Dkkl1 (34).Blue circles: genes downregulated by Dkkl1; not significantly enriched (6). Grey circles: genes not regulated by Dkkl1. See also Figure S5.
Figure 6
Figure 6. In Vivo Over-Expression of Susceptible-Specific Hub Genes Induces a Susceptible Behavioral Profile
(A) Schematic of in vivo behavioral validation of susceptible-specific hub genes. Representative images of HSV-GFP infection in VHIP (B) and PFC (F). Scale bar=100μm. Mice injected with (C) HSV-Dkkl1-GFP, (D) HSV-Neurod2-GFP or (E) HSV-Sdk1-GFP in VHIP spent significantly less time in proximity to the wire mesh enclosure (Interaction Zone) compared to mice injected with HSV-GFP indicating increased susceptibility. Mice injected with the same viral constructs in PFC spent more time in the interaction zone (I; HSV-Sdk1-GFP) or an equivalent amount of time (G; HSV-Dkkl1-GFP, H; HSV-Neurod2-GFP) compared to HSV-GFP injected mice indicating increased resilience or lack of susceptibility. * p<0.05, **p<0.01. Bar graphs show mean ±SEM. See also Figure S6.
Figure 7
Figure 7. In Vivo Over-Expression of Susceptible-Specific Hub Genes in VHIP Increases sEPSC Frequency
Overexpression of Dkkl1 or Sdk1 increased the frequency of spontaneous EPSCs in VHIP neurons 24h after viral infection. (A) Among all 73 VHIP neurons recorded, 17 were burst firing (left) and 43 were regular firing (right). Subsequent synaptic analysis focused on regular firing neurons. (B) Representative sEPSCs from uninfected VHIP neurons (top left), neurons expressing GFP alone (bottom left), Dkkl1-GFP (top right) or Sdk1-GFP (bottom right). (C) sEPSC frequency was increased by either Dkkl1 or Sdk1 over-expression relative to uninfected or GFP infected neurons (the latter two did not differ). (D) sEPSC amplitude was not changed by either Dkkl1-GFP or Sdk1-GFP overexpression. * p<0.05, **p<0.01. Bar graphs show mean ±SEM.

References

    1. Network & Pathway Analysis Subgroup of the Psychiatric Genomics Consortium Psychiatric genome-wide association study analyses implicate neuronal, immune and histone pathways. Nature neuroscience. 2015;18:199–209. - PMC - PubMed
    1. Admon R, Holsen LM, Aizley H, Remington A, Whitfield-Gabrieli S, Goldstein JM, Pizzagalli DA. Striatal Hypersensitivity During Stress in Remitted Individuals with Recurrent Depression. Biological psychiatry. 2015;78:67–76. - PMC - PubMed
    1. Arloth J, Bogdan R, Weber P, Frishman G, Menke A, Wagner KV, Balsevich G, Schmidt MV, Karbalai N, Czamara D, et al. Genetic Differences in the Immediate Transcriptome Response to Stress Predict Risk-Related Brain Function and Psychiatric Disorders. Neuron. 2015;86:1189–1202. - PMC - PubMed
    1. Bagot RC, Parise EM, Pena CJ, Zhang HX, Maze I, Chaudhury D, Persaud B, Cachope R, Bolanos-Guzman CA, Cheer J, et al. Ventral hippocampal afferents to the nucleus accumbens regulate susceptibility to depression. Nature communications. 2015;6:7062. - PMC - PubMed
    1. Berton O, McClung CA, Dileone RJ, Krishnan V, Renthal W, Russo SJ, Graham D, Tsankova NM, Bolanos CA, Rios M, et al. Essential role of BDNF in the mesolimbic dopamine pathway in social defeat stress. Science. 2006;311:864–868. - PubMed

Publication types