. 2016 Dec 8;35(49):6319-6329.
doi: 10.1038/onc.2016.163. Epub 2016 May 16.

RAC1 GTPase promotes the survival of breast cancer cells in response to hyper-fractionated radiation treatment

Affiliations

RAC1 GTPase promotes the survival of breast cancer cells in response to hyper-fractionated radiation treatment

A L Hein et al. Oncogene. .

Abstract

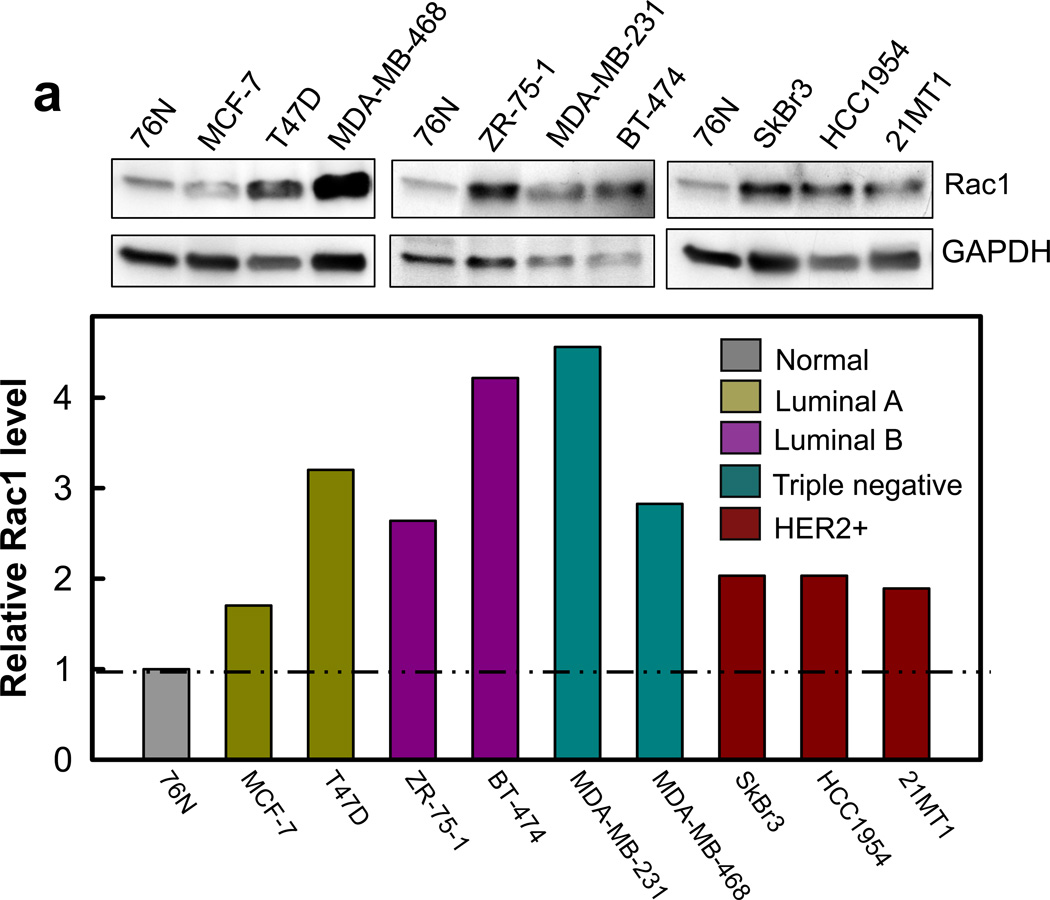
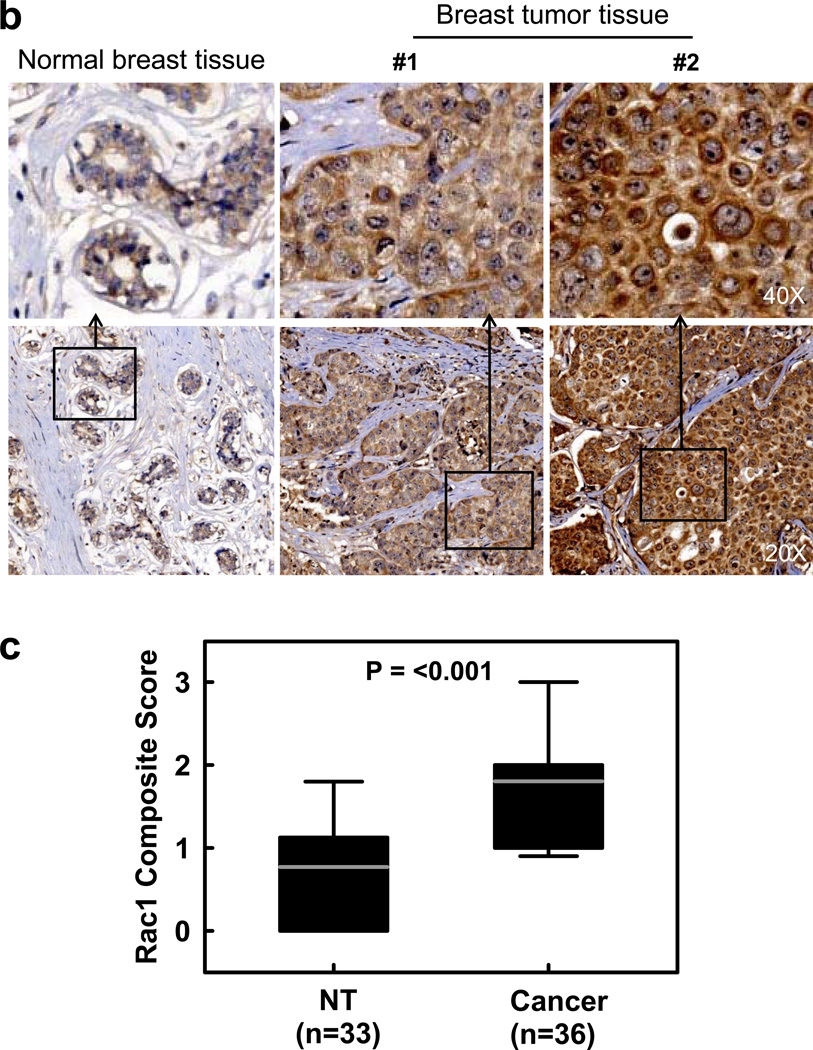
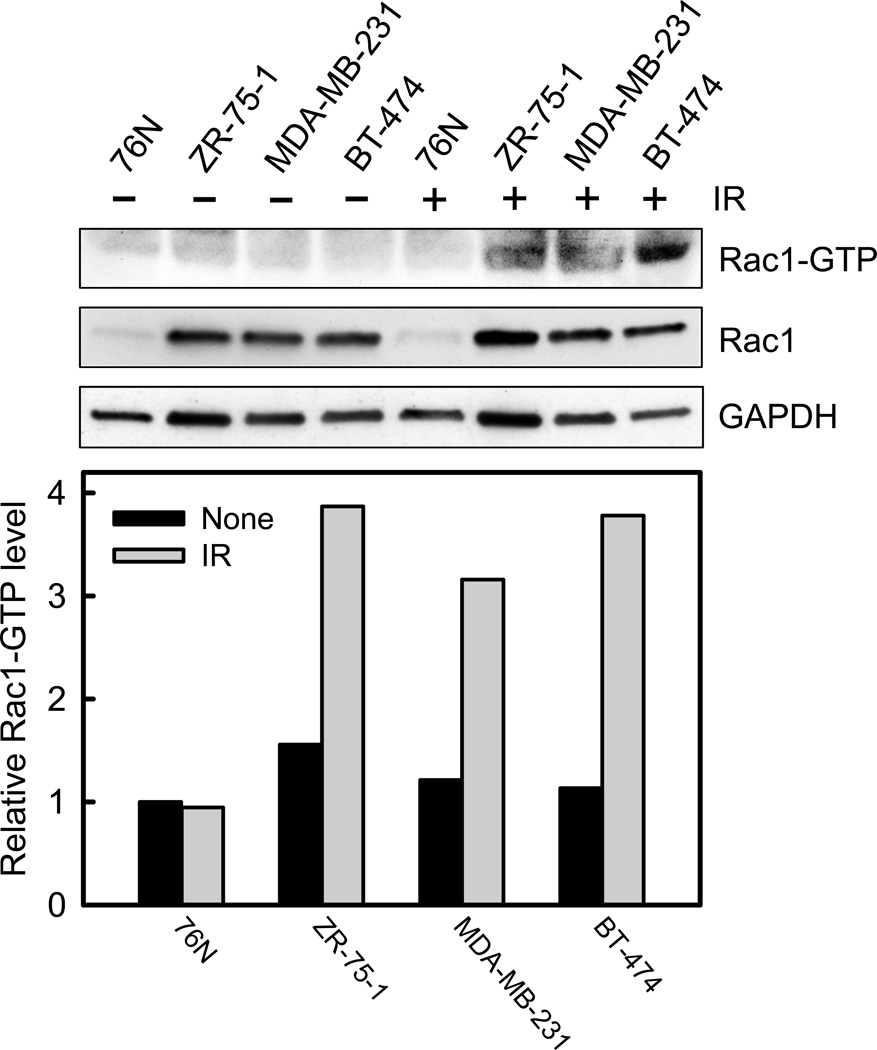
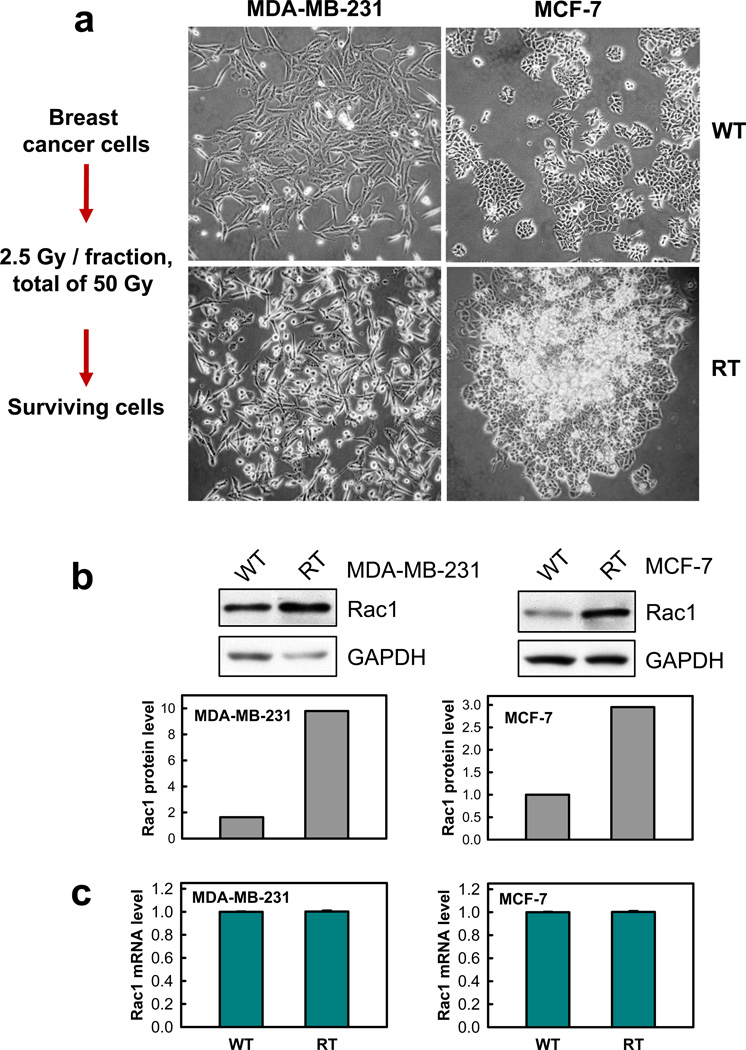
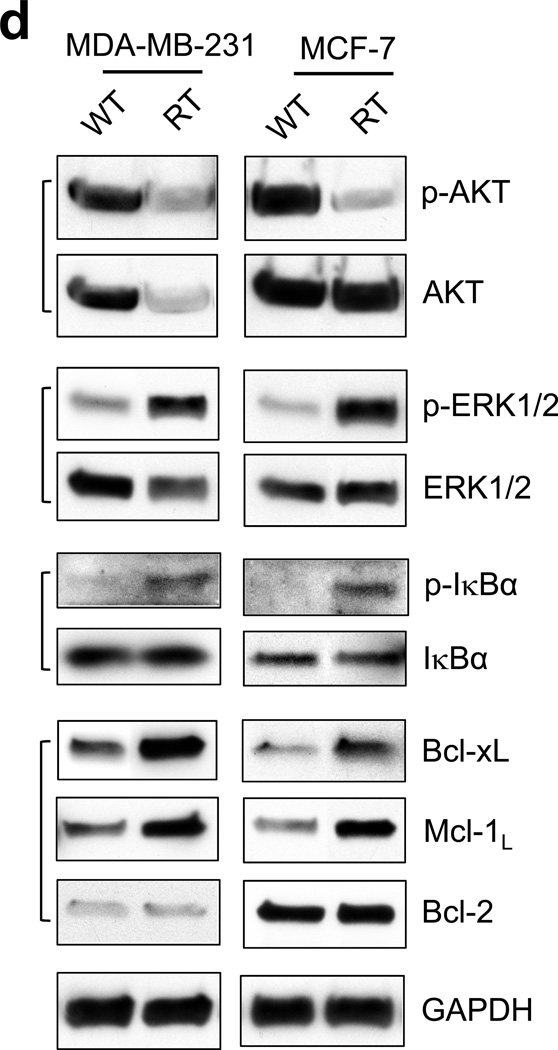
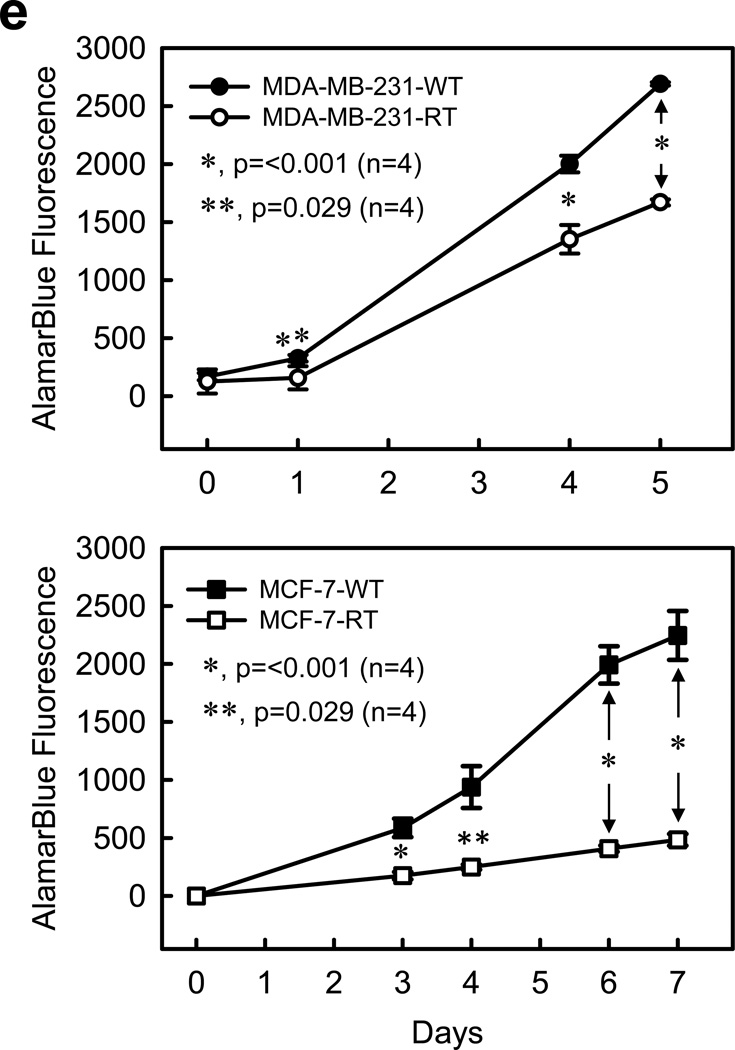
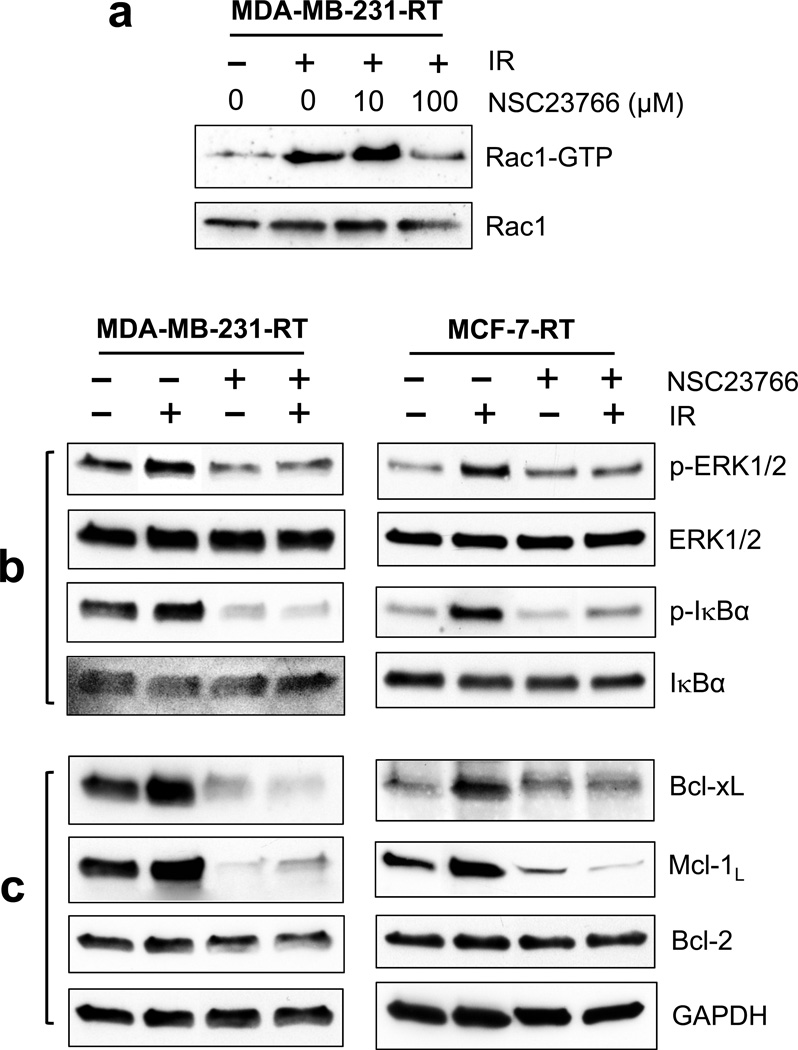
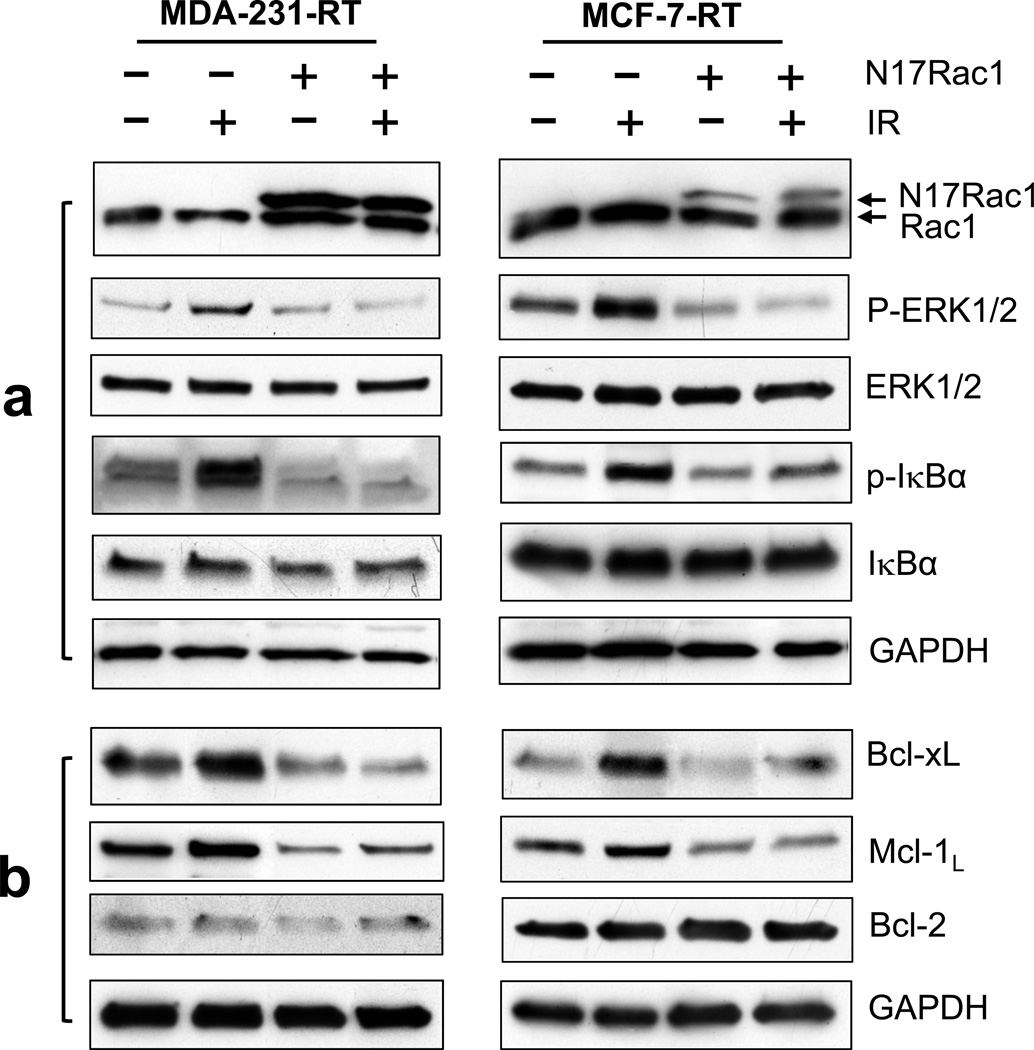
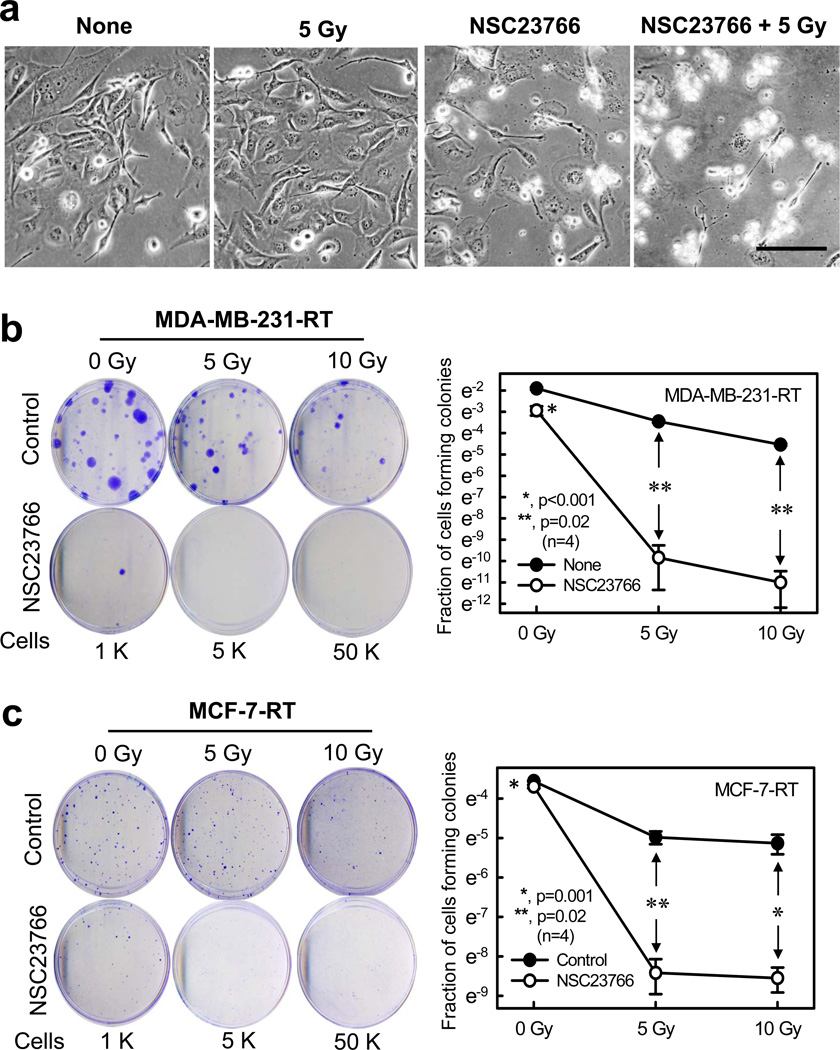
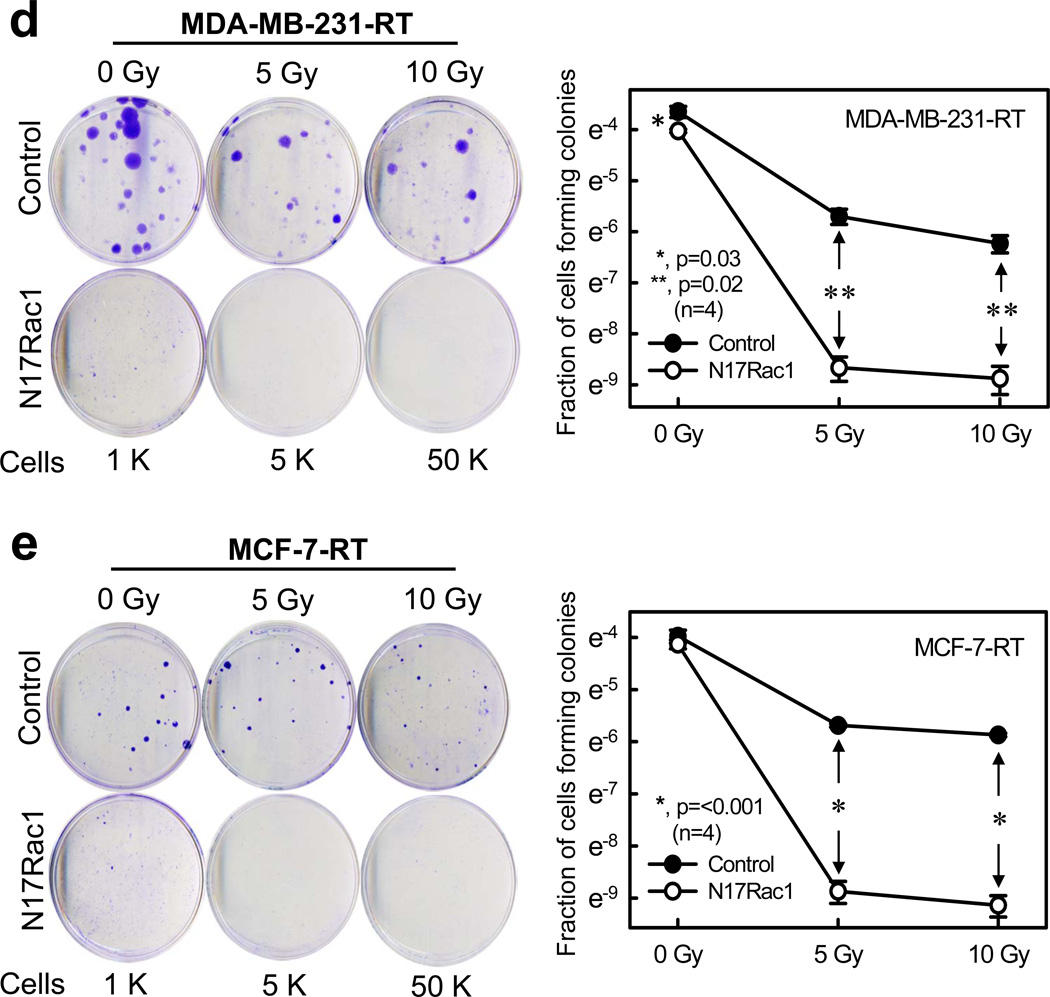
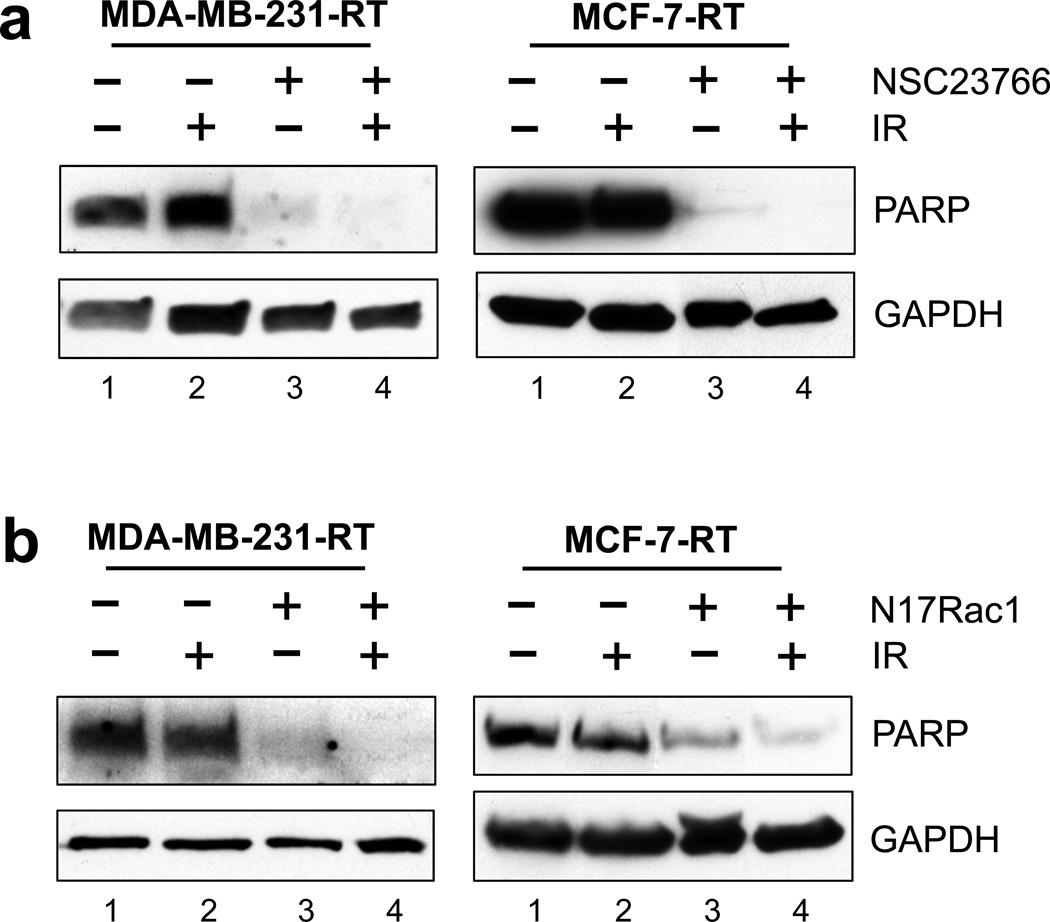
Radiation therapy is a staple approach for cancer treatment, whereas radioresistance of cancer cells remains a substantial clinical problem. In response to ionizing radiation (IR) induced DNA damage, cancer cells can sustain/activate pro-survival signaling pathways, leading to apoptotic resistance and induction of cell cycle checkpoint/DNA repair. Previous studies show that Rac1 GTPase is overexpressed/hyperactivated in breast cancer cells and is associated with poor prognosis. Studies from our laboratory reveal that Rac1 activity is necessary for G2/M checkpoint activation and cell survival in response to IR exposure of breast and pancreatic cancer cells. In this study, we investigated the effect of Rac1 on the survival of breast cancer cells treated with hyper-fractionated radiation (HFR), which is used clinically for cancer treatment. Results in this report indicate that Rac1 protein expression is increased in the breast cancer cells that survived HFR compared with parental cells. Furthermore, this increase of Rac1 is associated with enhanced activities of extracellular signal-regulated kinases 1 and 2 (ERK1/2) and nuclear factor-κB (NF-κB) signaling pathways and increased levels of anti-apoptotic protein Bcl-xL and Mcl-1, which are downstream targets of ERK1/2 and NF-κB signaling pathways. Using Rac1-specific inhibitor and dominant-negative mutant N17Rac1, here we demonstrate that Rac1 inhibition decreases the phosphorylation of ERK1/2 and inhibitory κBα (IκBα), as well as the levels of Bcl-xL and Mcl-1 protein in the HFR-selected breast cancer cells. Moreover, inhibition of Rac1 using either small molecule inhibitor or dominant-negative N17Rac1 abrogates clonogenic survival of HFR-selected breast cancer cells and decreases the level of intact poly(ADP-ribose) polymerase, which is indicative of apoptosis induction. Collectively, results in this report suggest that Rac1 signaling is essential for the survival of breast cancer cells subjected to HFR and implicate Rac1 in radioresistance of breast cancer cells. These studies also provide the basis to explore Rac1 as a therapeutic target for radioresistant breast cancer cells.


Conflict of interest statement

CONFLICT OF INTERST The authors declare no conflict of interest.

Figures

Figure 1
Figure 1
Rac1 is overexpressed in breast cancer cells. (a) Upper panel: normal mammary epithelial cells (76N) and breast cancer cells of subtype luminal A (MCF-7 and T47D), and luminal B (BT-474 and ZR-75-1), triple-negative (MDA-MB-231 and MDA-MB-468) and HER2 positive (SkBr3, HCC1954, 21MT-1) were analyzed for Rac1 protein expression by Western blot analysis. As a protein loading control, the level of GAPDH in cell lysates was assessed. Lower panel: immunoblot densities of Rac1 and GAPDH were quantified using ImageJ analytical program (NIH) and relative Rac1 expression versus GAPDH determined. (b) Representative IHC analysis shows a distinct increase in immunostaining of Rac1 in malignant breast tumor tissues compared to normal breast tissues. (c) Box plot shows composite score of Rac1 expression in normal breast/benign tumor tissues (NT) and cancerous breast tissue (Cancer), analyzed by IHC.
Figure 1
Figure 1
Rac1 is overexpressed in breast cancer cells. (a) Upper panel: normal mammary epithelial cells (76N) and breast cancer cells of subtype luminal A (MCF-7 and T47D), and luminal B (BT-474 and ZR-75-1), triple-negative (MDA-MB-231 and MDA-MB-468) and HER2 positive (SkBr3, HCC1954, 21MT-1) were analyzed for Rac1 protein expression by Western blot analysis. As a protein loading control, the level of GAPDH in cell lysates was assessed. Lower panel: immunoblot densities of Rac1 and GAPDH were quantified using ImageJ analytical program (NIH) and relative Rac1 expression versus GAPDH determined. (b) Representative IHC analysis shows a distinct increase in immunostaining of Rac1 in malignant breast tumor tissues compared to normal breast tissues. (c) Box plot shows composite score of Rac1 expression in normal breast/benign tumor tissues (NT) and cancerous breast tissue (Cancer), analyzed by IHC.
Figure 2
Figure 2
Rac1 activity is increased following irradiation in breast cancer cells compared to normal breast cells. Upper panel: indicated cells were harvested before and 15 min after IR (10-Gy) and analyzed for Rac1 activity (Rac1-GTP), as described in Materials and Methods. As controls, protein levels of Rac1 and GAPDH in cell lysates were assessed. Lower panel: immunoblot densities of Rac1-GTP and Rac1 total protein were quantified using ImageJ software and relative Rac1-GTP level versus Rac1 total protein level determined.
Figure 3
Figure 3
Breast cancer cells that survived a clinical dose of HFR exhibit different cell morphology and increased Rac1 protein expression compared to parental cells. (a) Left panel: procedure for selecting the breast cancer cells that survived clinical dose of HFR. Right panel: representative images of MCF-7 and MDA-MB-231 cells were obtained before (WT) and after (RT) HFR treatment. (b) Upper panel: indicated breast cancer cells were analyzed for protein levels of Rac1 and GAPDH by immunoblotting. Bottom panel: immunoblot densities of Rac1 and GAPDH proteins were quantified using ImageJ software and relative Rac1 expression versus GAPDH determined. (c) mRNA levels of Rac1 and GAPDH in the indicated cells were analyzed by RT-PCR and relative Rac1 mRNA level versus GAPDH mRNA determined. The results are shown as mean±s.d. of RT-PCR analyses in tetraplicate samples (n=4). (d) Log-phase growing MCF-7 and MDA-MB-231 cells treated without (WT) or with (RT) HFR were analyzed for phosphorylation and/or level of AKT, ERK1/2, IκBα, Bcl-xL, Mcl-1L and Bcl-2 by immunoblotting. GAPDH was assessed as a protein loading control. (e) The indicated cells were analyzed for growth kinetics using AlamarBlue assay, as described previously. At indicated time points, 10% of AlamarBlue reagent was added to the cells, incubated for 130 min and measured for fluorescence intensity using a SpectraMax M5 plate reader (Molecular Devices, Inc.) at ex/em 544/590 nm.
Figure 3
Figure 3
Breast cancer cells that survived a clinical dose of HFR exhibit different cell morphology and increased Rac1 protein expression compared to parental cells. (a) Left panel: procedure for selecting the breast cancer cells that survived clinical dose of HFR. Right panel: representative images of MCF-7 and MDA-MB-231 cells were obtained before (WT) and after (RT) HFR treatment. (b) Upper panel: indicated breast cancer cells were analyzed for protein levels of Rac1 and GAPDH by immunoblotting. Bottom panel: immunoblot densities of Rac1 and GAPDH proteins were quantified using ImageJ software and relative Rac1 expression versus GAPDH determined. (c) mRNA levels of Rac1 and GAPDH in the indicated cells were analyzed by RT-PCR and relative Rac1 mRNA level versus GAPDH mRNA determined. The results are shown as mean±s.d. of RT-PCR analyses in tetraplicate samples (n=4). (d) Log-phase growing MCF-7 and MDA-MB-231 cells treated without (WT) or with (RT) HFR were analyzed for phosphorylation and/or level of AKT, ERK1/2, IκBα, Bcl-xL, Mcl-1L and Bcl-2 by immunoblotting. GAPDH was assessed as a protein loading control. (e) The indicated cells were analyzed for growth kinetics using AlamarBlue assay, as described previously. At indicated time points, 10% of AlamarBlue reagent was added to the cells, incubated for 130 min and measured for fluorescence intensity using a SpectraMax M5 plate reader (Molecular Devices, Inc.) at ex/em 544/590 nm.
Figure 4
Figure 4
Effect of Rac1 inhibition on the key components of pro-survival signaling pathways in HFR-selected breast cancer cells treated with/without radiation. (a) MDA-MB-231-RT cells were incubated with NSC23766 at the indicated doses for 1 h and exposed to IR (10-Gy). The cells were then incubated for 15 min at 37°C and analyzed for Rac1 activity (Rac1-GTP) and protein level (Rac1). (b) and (c) cells were incubated for 1 h in the presence or absence of NSC23766 (100 µM) and treated with/without 10-Gy IR. After 2 h incubation following IR, the cells were analyzed for phosphorylation and level of ERK1/2 and IκBα (b). After 48 h post IR, the cells were analyzed for levels of Bcl-xL, Mcl-1L, Bcl-2 and GAPDH by immunoblotting (c).
Figure 5
Figure 5
Effect of N17Rac1 dominant negative mutant on the key components of pro-survival signaling pathways in HFR-selected breast cancer cells treated with/without radiation. (a) Indicated cells were transduced for 24 h with adenoviral vector expressing N17Rac1 or control adenoviral vector (10 pfu/cell), treated with/without 10-Gy IR, incubated for 2 h and analyzed for phosphorylation and/or level of N17Rac1, ERK1/2 and IκB by immunoblotting. (b) At 48 h post IR, the cells were assessed for levels of Bcl-xL, Mcl-1L, Bcl-2 and GAPDH.
Figure 6
Figure 6
Inhibition of Rac1 abrogates clonogenic survival of the HFR-selected breast cancer cells. (a) MDA-MB-231-RT cells were incubated for 1 h in the presence or absence of NSC23766 (100 µM) and exposed to IR (5-Gy). The cells were incubated for 3 h post IR, washed, incubated for an additional 2 days and photographed using phase-contrast optics. The scale bar represents 100 µm. (b) MDA-MB-231-RT cells were incubated for 1 h with/without NSC23766 and exposed to increasing doses of IR. After 3 h incubation post IR, the cells were washed and incubated in growth medium for 2 weeks. Left panel: representative sample dishes from the clonogenic assay are shown. Right panel: number of colonies in the resulting samples were quantified using the ImageJ analytical program and the results are shown as mean±s.d. of two set of experiments in duplicate samples. (c) MCF-7-RT cells were treated as described above. Left panel: representative sample dishes from the clonogenic assay are shown. Right panel: numbers of colonies in the samples were quantified using the ImageJ analytical program and the results shown as mean±s.d. of two set of experiments in duplicate samples. (d) MDA-MB-231-RT cells were infected with Ad.N17Rac1 or Ad.Control (10 pfu/cell) for 24 h and exposed to IR (5 or 10-Gy) or left non-irradiated. The cells were incubated in growth medium for 14 days and assessed for amount of colonies. Left panel: representative sample dishes from the clonogenic assay. Right panel: number of colonies in the samples were quantified and the results shown as mean±s.d. of two set of experiments in duplicate samples. (e) MCF-7-RT cells were treated as described above. Left panel: representative sample dishes from the clonogenic assay. Right panel: numbers of colonies in the samples was quantified and the results shown as mean±s.d. of two set of experiments in duplicate samples.
Figure 6
Figure 6
Inhibition of Rac1 abrogates clonogenic survival of the HFR-selected breast cancer cells. (a) MDA-MB-231-RT cells were incubated for 1 h in the presence or absence of NSC23766 (100 µM) and exposed to IR (5-Gy). The cells were incubated for 3 h post IR, washed, incubated for an additional 2 days and photographed using phase-contrast optics. The scale bar represents 100 µm. (b) MDA-MB-231-RT cells were incubated for 1 h with/without NSC23766 and exposed to increasing doses of IR. After 3 h incubation post IR, the cells were washed and incubated in growth medium for 2 weeks. Left panel: representative sample dishes from the clonogenic assay are shown. Right panel: number of colonies in the resulting samples were quantified using the ImageJ analytical program and the results are shown as mean±s.d. of two set of experiments in duplicate samples. (c) MCF-7-RT cells were treated as described above. Left panel: representative sample dishes from the clonogenic assay are shown. Right panel: numbers of colonies in the samples were quantified using the ImageJ analytical program and the results shown as mean±s.d. of two set of experiments in duplicate samples. (d) MDA-MB-231-RT cells were infected with Ad.N17Rac1 or Ad.Control (10 pfu/cell) for 24 h and exposed to IR (5 or 10-Gy) or left non-irradiated. The cells were incubated in growth medium for 14 days and assessed for amount of colonies. Left panel: representative sample dishes from the clonogenic assay. Right panel: number of colonies in the samples were quantified and the results shown as mean±s.d. of two set of experiments in duplicate samples. (e) MCF-7-RT cells were treated as described above. Left panel: representative sample dishes from the clonogenic assay. Right panel: numbers of colonies in the samples was quantified and the results shown as mean±s.d. of two set of experiments in duplicate samples.
Figure 7
Figure 7
Inhibition of Rac1 induces apoptosis in the HFR-survived breast cancer cells. (a) Indicated cells were treated with/without IR (10-Gy) in the presence or absence of NSC23766 (100 µM), incubated for 2 days and analyzed for PARP and GAPDH protein expression by immunoblotting. (b) Cells were infected with Ad.Rac1N17 or Ad.Control (10 pfu/cell) for 24 h and exposed to IR (10-Gy) or left untreated. After 48 h incubation, cells were analyzed for PARP and GAPDH protein expression by immunoblotting.

Comment in

Similar articles

Cited by

References

    1. DeSantis C, Siegel R, Jemal A. Cancer treatment and survivorship: facts and figures 2014–2015. American Cancer Society. 2014–2015:3–6.
    1. Skvortsova I, Debbage P, Kumar V, Skvortsov S. Radiation resistance: Cancer stem cells (CSCs) and their enigmatic pro-survival signaling. Semin Cancer Biol. 2015;35:39–44. - PubMed
    1. Valerie K, Yacoub A, Hagan MP, Curiel DT, Fisher PB, Grant S, et al. Radiation-induced cell signaling: inside-out and outside-in. Mol Cancer Ther. 2007;6:789–801. - PubMed
    1. Hein AL, Ouellette MM, Yan Y. Radiation-induced signaling pathways that promote cancer cell survival (review) Int J Oncol. 2014;45:1813–1819. - PMC - PubMed
    1. Sancar A, Lindsey-Boltz LA, Unsal-Kacmaz K, Linn S. Molecular mechanisms of mammalian DNA repair and the DNA damage checkpoints. Annu Rev Biochem. 2004;73:39–85. - PubMed

Publication types

Substances