

Prevalence of type 2 diabetes mellitus among inland residents in China (2000-2014): A meta-analysis
- PMID: 27181391
- PMCID: PMC5089946
- DOI: 10.1111/jdi.12514
Prevalence of type 2 diabetes mellitus among inland residents in China (2000-2014): A meta-analysis
Abstract
Aims/introduction: Besides the aging population in China, the following have become serious public health problems: increasing urban population, lifestyle changes and diabetes. We assessed the epidemiology of type 2 diabetes mellitus in China between 2000 and 2014, and analyzed time trends to better determine the prevalence status of diabetes in China and to provide a basis for prevention and decision-making.
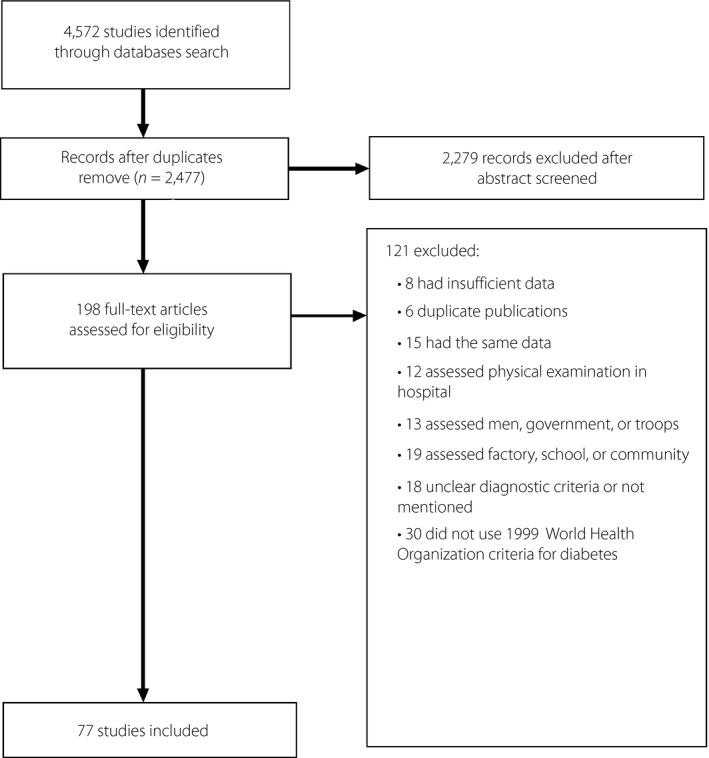
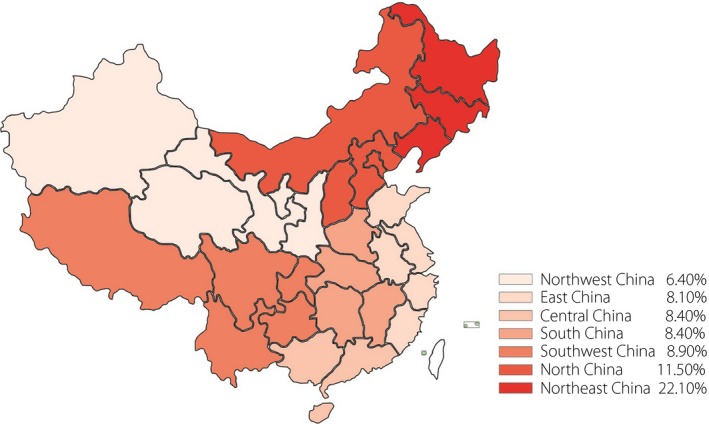
Materials and methods: In our systematic review, we searched China National Knowledge Infrastructure, Chinese VIP Information, Wanfang and PubMed databases for studies on type 2 diabetes mellitus between 2000 and 2014 in China. Two investigators extracted the data and assessed the quality of the included literature independently. We excluded studies that did not use 1999 World Health Organization criteria for diabetes. We also excluded reviews and viewpoints, studies with insufficient data, studies that were not carried out in mainland China and studies on troops, community, schools or physical examination people. We used stata 12.0 to combine the prevalence of all studies, calculated the pooled prevalence and its 95% confidence interval, and analyzed the differences among men/women, urban/rural areas and year of study. We calculated the prevalence of seven geographic areas of China, respectively, and mapped the distribution in the whole country to estimate the pooled prevalence of each area.
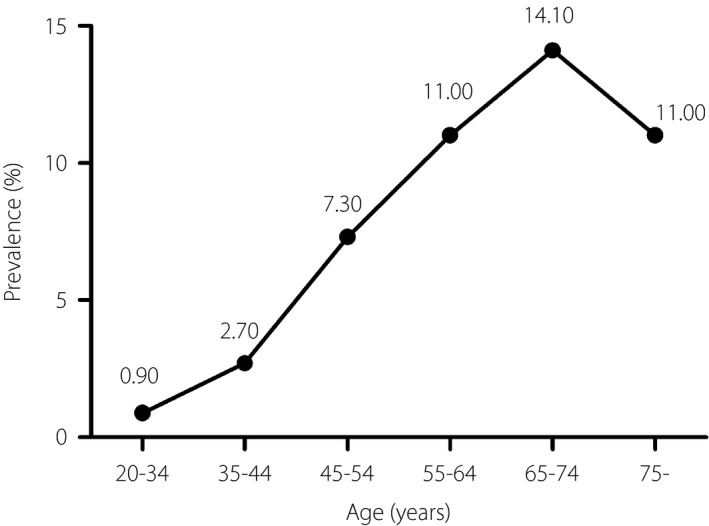
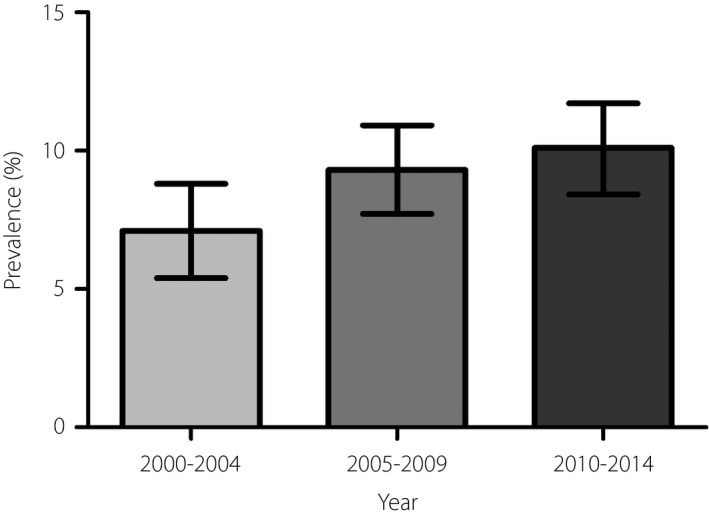
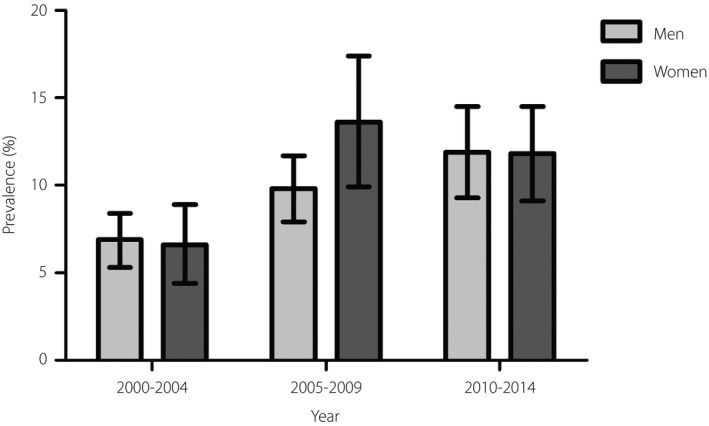
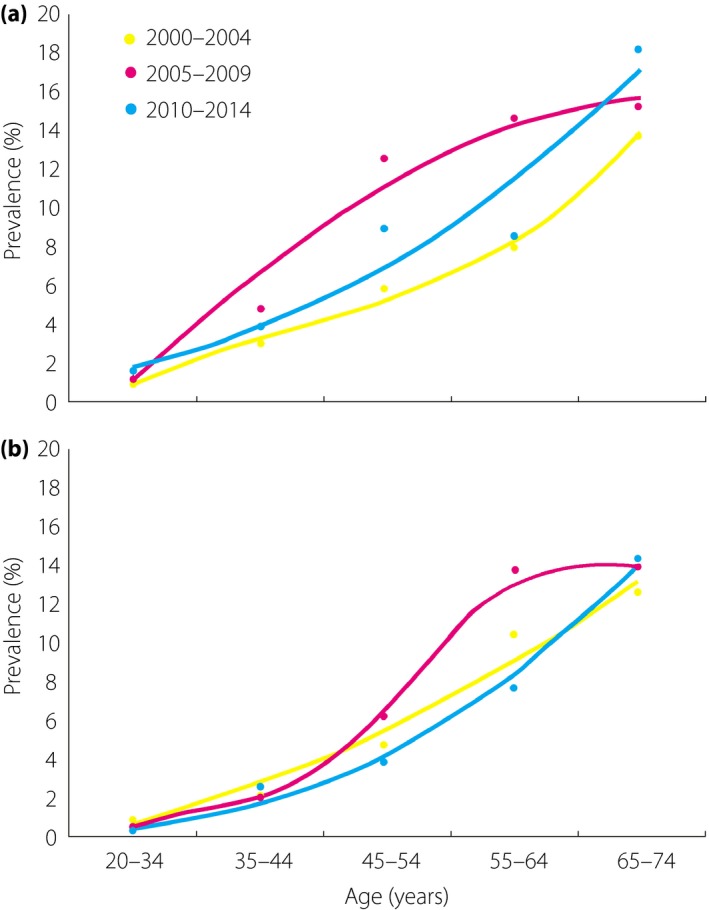
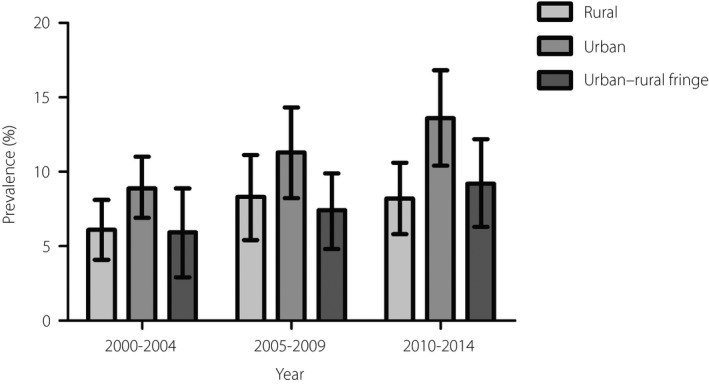
Results: Our search returned 4,572 studies, 77 of which satisfied the inclusion criteria. The included studies had a total of 1,287,251 participants, in which 680,574 cases of type 2 diabetes mellitus were recorded. The overall prevalence (9.1%) has been increasing since the 1970s, and it increased rapidly with age. The prevalence of the 65-74 years group was as high as 14.1%. Meanwhile, the prevalence among men/women and urban/rural areas was significantly different. The prevalence was 9.9% for men and 11.6% for women, which were significantly higher than the average at the end of the last century and the beginning of this century. The prevalence rate in urban areas (11.4%) was significantly higher than that in rural areas and in urban-rural fringe areas, and the prevalence in rural areas (8.2%) was slightly higher than that in urban-rural fringe areas (7.5%). In addition, the prevalence in each geographic area were estimated and mapped, which showed a large imbalance in the map.
Conclusions: Our analysis suggested that type 2 diabetes mellitus is highly prevalent in China. These results underscore the urgent need for the government to vigorously strengthen the management of diabetes prevention and control.
Keywords: China; Prevalence; Type 2 diabetes mellitus.
© 2016 The Authors. Journal of Diabetes Investigation published by Asian Association for the Study of Diabetes (AASD) and John Wiley & Sons Australia, Ltd.
Figures
References
-
- King H, Rewers M. Global estimates for prevalence of diabetes mellitus and impaired glucose tolerance in adults. WHO Ad Hoc Diabetes Reporting Group. Diabetes Care 1993; 16: 157–177. - PubMed
-
- Shaw JE, Sicree RA, Zimmet PZ. Global estimates of the prevalence of diabetes for 2010 and 2030. Diabetes Res Clin Pract 2010; 87: 4–14. - PubMed
-
- International Diabetes Federation . Diabetes Atlas, 3rd edn International Diabetes Federation, Brussels, 2006.
-
- Yang W, Lu J, Weng J, et al Prevalence of diabetes among men and women in China. N Engl J Med 2010; 362: 1090–1101. - PubMed
Publication types
MeSH terms
LinkOut - more resources
Full Text Sources
Other Literature Sources
Medical
