Human iPSC-derived endothelial cell sprouting assay in synthetic hydrogel arrays
- PMID: 27181878
- PMCID: PMC5228278
- DOI: 10.1016/j.actbio.2016.05.020
Human iPSC-derived endothelial cell sprouting assay in synthetic hydrogel arrays
Abstract
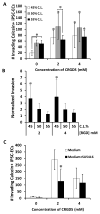
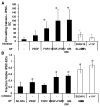
Activation of vascular endothelial cells (ECs) by growth factors initiates a cascade of events during angiogenesis in vivo consisting of EC tip cell selection, sprout formation, EC stalk cell proliferation, and ultimately vascular stabilization by support cells. Although EC functional assays can recapitulate one or more aspects of angiogenesis in vitro, they are often limited by undefined substrates and lack of dependence on key angiogenic signaling axes. Here, we designed and characterized a chemically-defined model of endothelial sprouting behavior in vitro using human induced pluripotent stem cell-derived endothelial cells (iPSC-ECs). We rapidly encapsulated iPSC-ECs at high density in poly(ethylene glycol) (PEG) hydrogel spheres using thiol-ene chemistry and subsequently encapsulated cell-dense hydrogel spheres in a cell-free hydrogel layer. The hydrogel sprouting array supported pro-angiogenic phenotype of iPSC-ECs and supported growth factor-dependent proliferation and sprouting behavior. iPSC-ECs in the sprouting model responded appropriately to several reference pharmacological angiogenesis inhibitors of vascular endothelial growth factor, NF-κB, matrix metalloproteinase-2/9, protein kinase activity, and β-tubulin, which confirms their functional role in endothelial sprouting. A blinded screen of 38 putative vascular disrupting compounds from the US Environmental Protection Agency's ToxCast library identified six compounds that inhibited iPSC-EC sprouting and five compounds that were overtly cytotoxic to iPSC-ECs at a single concentration. The chemically-defined iPSC-EC sprouting model (iSM) is thus amenable to enhanced-throughput screening of small molecular libraries for effects on angiogenic sprouting and iPSC-EC toxicity assessment.
Statement of significance: Angiogenesis assays that are commonly used for drug screening and toxicity assessment applications typically utilize natural substrates like Matrigel(TM) that are difficult to spatially pattern, costly, ill-defined, and may exhibit lot-to-lot variability. Herein, we describe a novel angiogenic sprouting assay using chemically-defined, bioinert poly(ethylene glycol) hydrogels functionalized with biomimetic peptides to promote cell attachment and degradation in a reproducible format that may mitigate the need for natural substrates. The quantitative assay of angiogenic sprouting here enables precise control over the initial conditions and can be formulated into arrays for screening. The sprouting assay here was dependent on key angiogenic signaling axes in a screen of angiogenesis inhibitors and a blinded screen of putative vascular disrupting compounds from the US-EPA.
Keywords: Angiogenic sprouting; Chemically-defined assay; Endothelial cells; Extracellular matrix; Poly(ethylene glycol) hydrogels; Thiol-ene chemistry; ToxCast.
Copyright © 2016 Acta Materialia Inc. Published by Elsevier Ltd. All rights reserved.
Figures


Similar articles
-
Stable engineered vascular networks from human induced pluripotent stem cell-derived endothelial cells cultured in synthetic hydrogels.Acta Biomater. 2016 Apr 15;35:32-41. doi: 10.1016/j.actbio.2016.03.001. Epub 2016 Mar 2. Acta Biomater. 2016. PMID: 26945632 Free PMC article.
-
High-Content Assay Multiplexing for Vascular Toxicity Screening in Induced Pluripotent Stem Cell-Derived Endothelial Cells and Human Umbilical Vein Endothelial Cells.Assay Drug Dev Technol. 2017 Aug/Sep;15(6):267-279. doi: 10.1089/adt.2017.786. Epub 2017 Aug 3. Assay Drug Dev Technol. 2017. PMID: 28771372 Free PMC article.
-
Robust and Scalable Angiogenesis Assay of Perfused 3D Human iPSC-Derived Endothelium for Anti-Angiogenic Drug Screening.Int J Mol Sci. 2020 Jul 7;21(13):4804. doi: 10.3390/ijms21134804. Int J Mol Sci. 2020. PMID: 32645937 Free PMC article.
-
Regulation of endothelial cell differentiation in embryonic vascular development and its therapeutic potential in cardiovascular diseases.Life Sci. 2021 Jul 1;276:119406. doi: 10.1016/j.lfs.2021.119406. Epub 2021 Mar 27. Life Sci. 2021. PMID: 33785330 Review.
-
Endothelial Cell Metabolism.Physiol Rev. 2018 Jan 1;98(1):3-58. doi: 10.1152/physrev.00001.2017. Physiol Rev. 2018. PMID: 29167330 Free PMC article. Review.
Cited by
-
Customizable biomaterials as tools for advanced anti-angiogenic drug discovery.Biomaterials. 2018 Oct;181:53-66. doi: 10.1016/j.biomaterials.2018.07.041. Epub 2018 Jul 26. Biomaterials. 2018. PMID: 30077137 Free PMC article. Review.
-
The endothelial tip-stalk cell selection and shuffling during angiogenesis.J Cell Commun Signal. 2019 Sep;13(3):291-301. doi: 10.1007/s12079-019-00511-z. Epub 2019 Mar 22. J Cell Commun Signal. 2019. PMID: 30903604 Free PMC article. Review.
-
From bedside to the bench: patient-specific hiPSC-EC models uncover endothelial dysfunction in genetic cardiomyopathies.Front Physiol. 2023 Jul 19;14:1237101. doi: 10.3389/fphys.2023.1237101. eCollection 2023. Front Physiol. 2023. PMID: 37538375 Free PMC article. Review.
-
A Genome-wide Analysis of Human Pluripotent Stem Cell-Derived Endothelial Cells in 2D or 3D Culture.Stem Cell Reports. 2017 Apr 11;8(4):907-918. doi: 10.1016/j.stemcr.2017.02.014. Epub 2017 Mar 23. Stem Cell Reports. 2017. PMID: 28343999 Free PMC article.
-
Systems Modeling of Developmental Vascular Toxicity.Curr Opin Toxicol. 2019 Jun 1;15(1):55-63. doi: 10.1016/j.cotox.2019.04.004. Curr Opin Toxicol. 2019. PMID: 32030360 Free PMC article.
References
-
- Carmeliet P. Mechanisms of angiogenesis and arteriogenesis. Nat Med. 2000;6:389–95. - PubMed
-
- Carmeliet P. Angiogenesis in health and disease. Nat Med. 2003;9:653–60. - PubMed
-
- Semenza GL. Angiogenesis in ischemic and neoplastic disorders. Annu Rev Med. 2003;54:17–28. - PubMed
-
- Donovan D, Brown NJ, Bishop ET, Lewis CE. Comparison of three in vitro human “angiogenesis” assays with capillaries formed in vivo. Angiogenesis. 2001;4:113–21. - PubMed
MeSH terms
Substances
Grants and funding
LinkOut - more resources
Full Text Sources
Other Literature Sources
Research Materials

