. 2016;31(2):284-302.
doi: 10.1080/23273798.2015.1101145. Epub 2015 Oct 19.

Can you hear me yet? An intracranial investigation of speech and non-speech audiovisual interactions in human cortex

Can you hear me yet? An intracranial investigation of speech and non-speech audiovisual interactions in human cortex

Ariane E Rhone et al. Lang Cogn Neurosci. 2016.

Abstract

In everyday conversation, viewing a talker's face can provide information about the timing and content of an upcoming speech signal, resulting in improved intelligibility. Using electrocorticography, we tested whether human auditory cortex in Heschl's gyrus (HG) and on superior temporal gyrus (STG) and motor cortex on precentral gyrus (PreC) were responsive to visual/gestural information prior to the onset of sound and whether early stages of auditory processing were sensitive to the visual content (speech syllable versus non-speech motion). Event-related band power (ERBP) in the high gamma band was content-specific prior to acoustic onset on STG and PreC, and ERBP in the beta band differed in all three areas. Following sound onset, we found with no evidence for content-specificity in HG, evidence for visual specificity in PreC, and specificity for both modalities in STG. These results support models of audio-visual processing in which sensory information is integrated in non-primary cortical areas.

Keywords: Cross-modal; Electrocorticography; Multisensory; Speech.


Figures
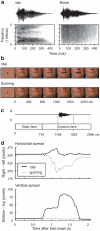
Figure 1
Figure 1
Stimulus detail and trial timing. a: Temporal (top) and spectral (bottom) detail of speech syllable /da/ (left) and non-speech noise (right) auditory stimuli. The amplitude envelope of both stimuli is similar, but spectral richness is absent in the non-speech (noise) stimulus. b: Sample frames from speech (top) and non-speech (bottom) video stimuli. Both stimuli begin with neutral mouth-closed still frames; visual motion begins at the same frame for both conditions. c: Combined audio and video trial detail. Video stimuli contained motion prior to the onset of auditory stimulation corresponding with the natural lag between facial motion and vocal production of /da/. d: quantification of lip aperture/spread differences between /da/ and gurning visual stimuli. /da/ contains more up-down spread, while gurning motion is largely side- to side.
Figure 2
Figure 2
Representative data from one subject (L206). a: Location of implanted electrodes on the lateral surface (left panel) and in the supratemporal plane (right panel). b: ERBP plot for a representative site (location marked by asterisk in panel a) depicting plotting conventions (axes and scales) for panels c-e. Stimulus schematic is shown on top. c-e: Responses from grids on the lateral surface and depth electrode to audio-alone (c), video-alone (d), and audiovisual /da/ (e). HG: Heschl's gyrus.
Figure 3
Figure 3
Sites included in analysis for each area of interest. MedHG: medial Heschl's gyrus; LatHG: lateral Heschl's gyrus; STG: superior temporal gyrus; PreC: precentral gyrus.
Figure 4
Figure 4
Pre-Audio responses. Mean high gamma (top) and beta (bottom) ERBP for each area of interest in the time window preceding auditory onset. Due to the low number of recording sites on Heschl's gyrus, one model was fit for all sites. Error bars indicate standard error of the mean. V0: Audio-alone, VNS: Visual non-speech (gurning), VSp: Visual speech (/da/).
Figure 5
Figure 5
Post-Audio responses. Mean high gamma (top) and beta (bottom) event related band power for each area of interest in the time window following auditory onset. Error bars reflect standard error of the mean. ANS = Audio non-speech (noise), ASp = Audio speech (/da/); see Figures 3 and 4 for additional abbreviations.
Figure 6
Figure 6
Time course comparison across conditions of interest. a: Effect of auditory stimulus. Envelope of high gamma (top) and beta (bottom) for each region (columns), contrasting auditory stimulus types (visual stimulus /da/ for all plots). b: Effect of visual stimulus. Envelope of high gamma (top) and beta (bottom) contrasting visual stimulus types (auditory stimulus /da/ for all plots). Shaded bars indicate windows used in statistical analysis. See Figure 3 – Figure 5 for abbreviations. Waveforms were smoothed for display only.

References

    1. Arnal LH. Predicting “When” using the motor system's beta-band oscillations. Frontiers in Human Neuroscience. 2012;6 doi: 10.3389/fnhum.2012.00225. - PMC - PubMed
    1. Arnal LH, Giraud AL. Cortical oscillations and sensory predictions. Trends in Cognitive Sciences. 2012;16(7):390–398. doi:10.1016/j.tics.2012.05.003. - PubMed
    1. Arnal LH, Morillon B, Kell CA, Giraud AL. Dual neural routing of visual facilitation in speech processing. The Journal of Neuroscience. 2009;29(43):13445–13453. doi: 10.1523/JNEUROSCI.3194-09.2009. - PMC - PubMed
    1. Arnal LH, Wyart V, Giraud AL. Transitions in neural oscillations reflect prediction errors generated in audiovisual speech. Nature Neuroscience. 2011;14(6):797–801. doi:10.1038/nn.2810. - PubMed
    1. Bates D, Maechler M, Bolker B. lme4: Linear mixed-effects models using S4 classes. R Package Version 1.1-7. 2012 Retrieved from http://lme4.r-forge.r-project.org/

LinkOut - more resources