. 2016 May 6;1(6):e85608.
doi: 10.1172/jci.insight.85608.

Alk5 inhibition increases delivery of macromolecular and protein-bound contrast agents to tumors

Affiliations

Alk5 inhibition increases delivery of macromolecular and protein-bound contrast agents to tumors

Heike E Daldrup-Link et al. JCI Insight. .

Abstract

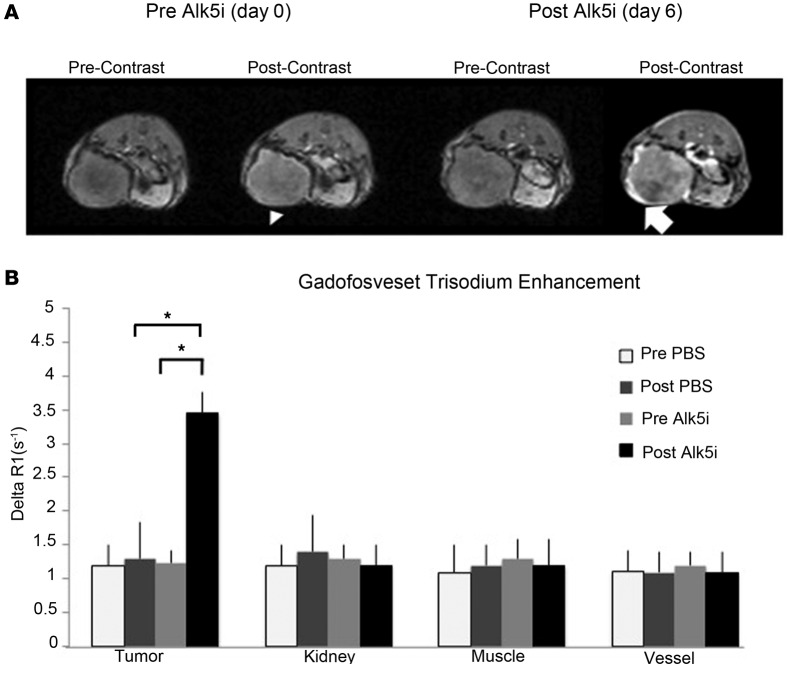
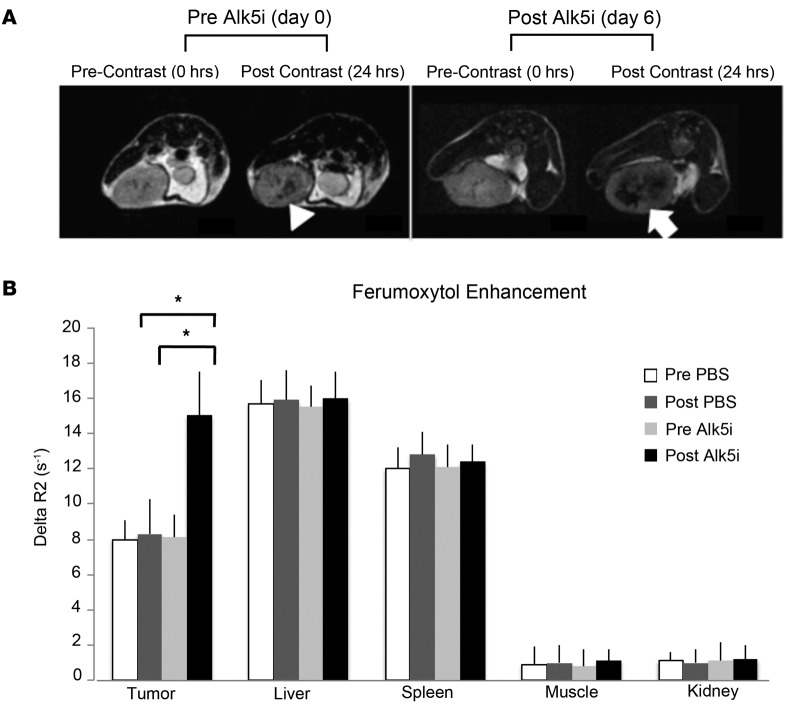
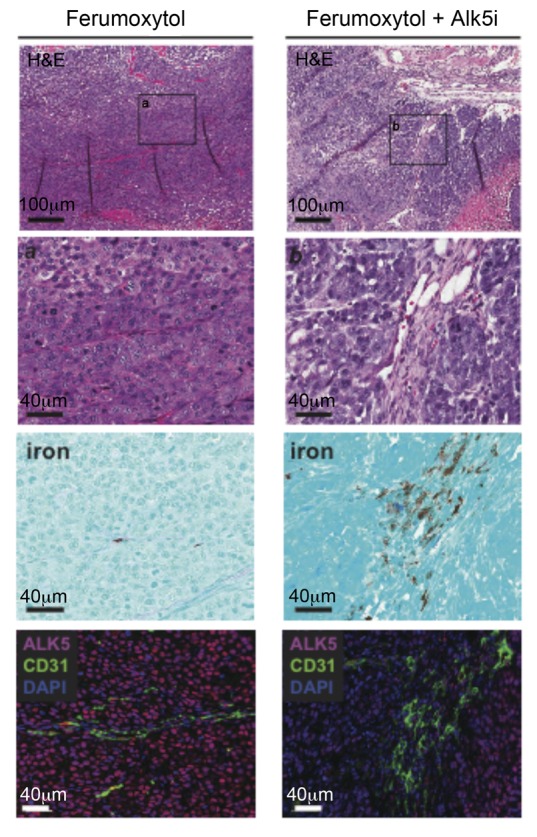
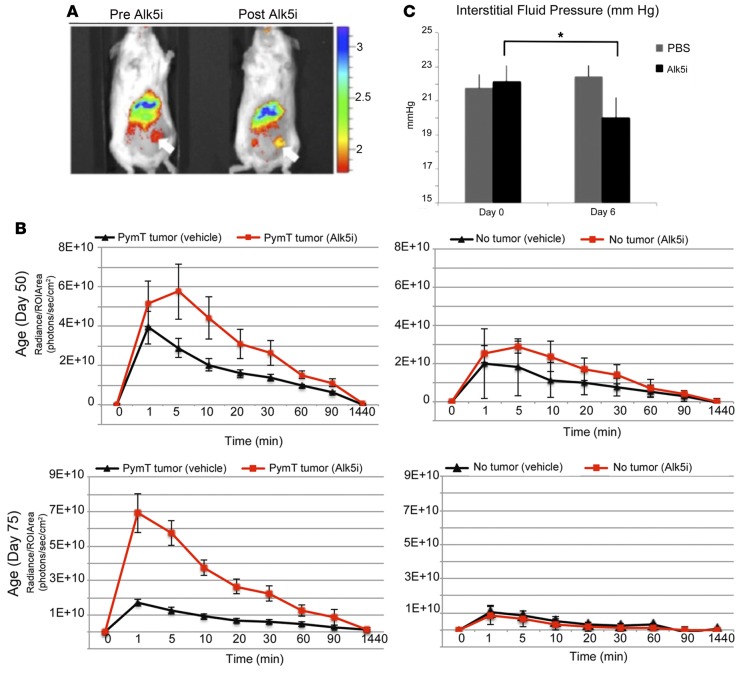
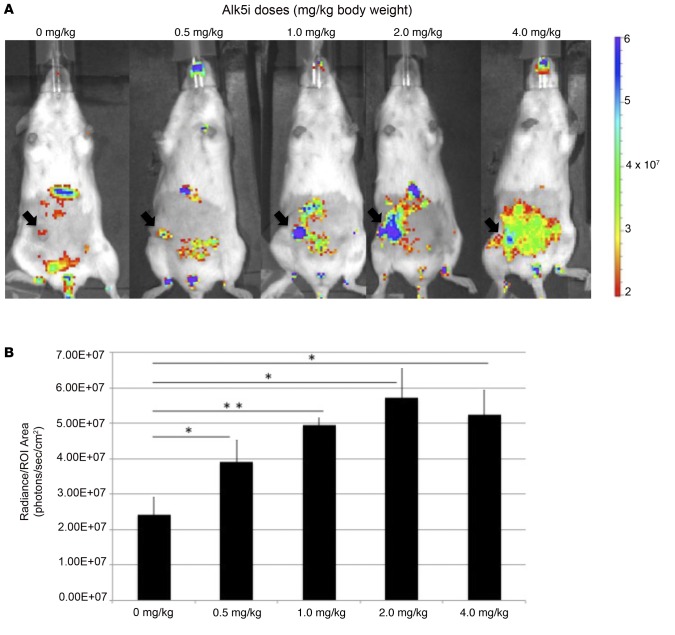
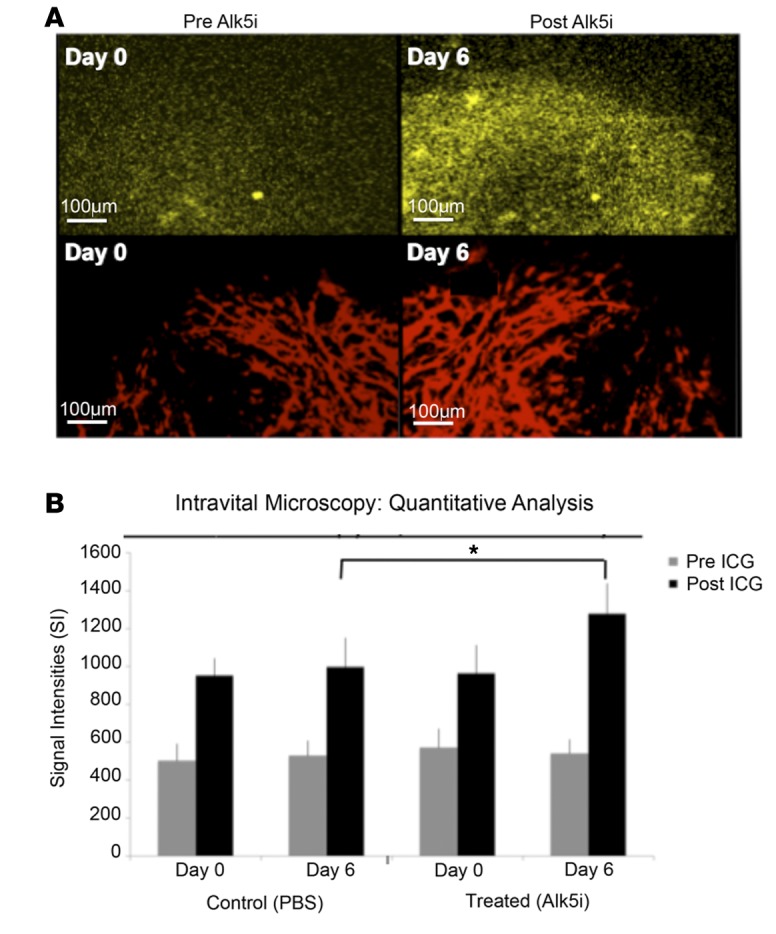
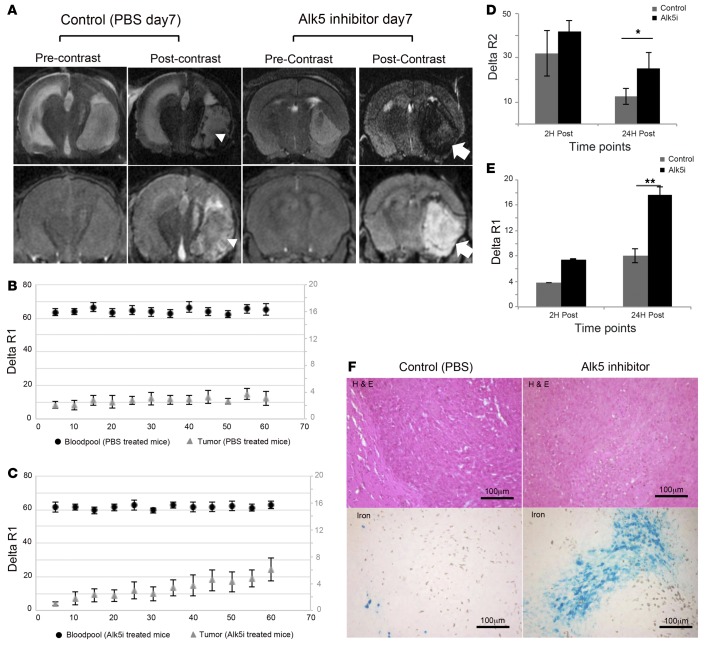
Limited transendothelial permeability across tumor microvessels represents a significant bottleneck in the development of tumor-specific diagnostic agents and theranostic drugs. Here, we show an approach to increase transendothelial permeability of macromolecular and nanoparticle-based contrast agents via inhibition of the type I TGF-β receptor, activin-like kinase 5 (Alk5), in tumors. Alk5 inhibition significantly increased tumor contrast agent delivery and enhancement on imaging studies, while healthy organs remained relatively unaffected. Imaging data correlated with significantly decreased tumor interstitial fluid pressure, while tumor vascular density remained unchanged. This immediately clinically translatable concept involving Alk5 inhibitor pretreatment prior to an imaging study could be leveraged for improved tumor delivery of macromolecular and nanoparticle-based imaging probes and, thereby, facilitate development of more sensitive imaging tests for cancer diagnosis, enhanced tumor characterization, and personalized, image-guided therapies.


Figures

Figure 1
Figure 1. Alk5 inhibition leads to increased gadofosveset trisodium accumulation and enhancement of MMTV-PyMT tumors on MR images.
(A) Representative axial T1-weighted MR images before and after i.v. injection of gadofosveset trisodium show stronger positive (bright) tumor enhancement after Alk5 inhibition (arrow) as compared with untreated tumors (arrowhead). (B) Corresponding quantitative changes in tumor R1 relaxation rates, measured as R1precontrast – R1postcontrast and displayed as means for 6 animals in each group ± SD, confirm significantly increased tumor enhancement after Alk5 inhibition (Alk5i). ANOVA was used to compare the differences between various groups. *P < 0.05, between MR enhancement of Alk5 inhibitor-treated tumors compared with controls. Results are representative of 3 independent experiments. Alk5, activin-like kinase 5; MMTV-PyMT, mouse mammary tumor virus–driven expression of the polyoma middle T oncogene; MR, magnetic resonance.
Figure 2
Figure 2. Alk5 inhibition leads to increased iron oxide nanoparticle accumulation and enhancement of MMTV-PyMT tumors on MR images.
(A) Representative axial T2-weighted MR images before and after i.v. injection of ferumoxytol nanoparticles show stronger negative (dark) tumor enhancement after Alk5 inhibition (arrow) compared with untreated tumors (arrowhead). (B) Corresponding quantitative changes in tumor R2 relaxation rates after ferumoxytol injection, measured as R2precontrast – R2postcontrast and displayed as means for 4 animals in each group ± SD. ANOVA was used to compare the differences between various groups. *P < 0.05, between MR enhancement of Alk5 inhibitor-treated tumors compared with untreated controls. Results are representative of 3 independent experiments. Alk5, activin-like kinase 5; Alk5i, Alk5 inhibition; MMTV-PyMT, mouse mammary tumor virus–driven expression of the polyoma middle T oncogene; MR, magnetic resonance.
Figure 3
Figure 3. Representative histology of MMTV-PyMT mammary tumors indicates increased ferumoxytol accumulation after Alk5 inhibition.
(Top) H&E staining of formalin-fixed paraffin-embedded tissue sections of MMTV-PyMT tumors (original magnification, ×10; scale bar: 100 μm), with boxed regions shown below at higher magnification (original magnification, ×40; scale bar: 400 μm) in images below. Prussian blue staining was used to reveal ferumoxytol/iron in adjacent tissue sections. (Bottom) Immunofluorescent staining for CD31 (green) and Alk5 (red) was conducted in adjacent tissue sections from the tissue block. Results are representative of 3 independent experiments. Scale bar: 40 μm. Alk5, activin-like kinase 5; Alk5i, Alk5 inhibition; MMTV-PyMT, mouse mammary tumor virus–driven expression of the polyoma middle T oncogene.
Figure 4
Figure 4. Alk5 inhibition leads to increased indocyanine green accumulation and enhancement of MMTV-PyMT tumors on optical images.
(A) Representative optical scans demonstrate higher fluorescence in an Alk5 inhibitor-treated tumor as compared with an untreated age-matched tumor (arrows). Liver fluorescence is not significantly different. (B) Quantitative fluorescence signal of early-stage (day 50) and late-stage (day 75) MMTV-PyMT tumors before and after treatment with Alk5 inhibitor. The breast fat pad of non-tumor-bearing mice served as controls. Alk5 inhibition led to improved indocyanine green (ICG) tumor enhancement of both early- and late-stage cancers; the effect is relatively stronger in late-stage cancers. Data are displayed as mean (± SD) tumor fluorescence of 4 animals in each group. (C) Tumor interstitial fluid pressure (IFP) measurements revealed significantly reduced IFP in Alk5 inhibitor-treated tumors compared with untreated controls. Data are displayed as mean tumor fluorescence of 8 animals in each group with SD. ANOVA was used to compare the differences between various groups. *P < 0.05. Results are representative of 3 independent experiments. Alk5, activin-like kinase 5; Alk5i, Alk5 inhibition; MMTV-PyMT, mouse mammary tumor virus–driven expression of the polyoma middle T oncogene.
Figure 5
Figure 5. Increased accumulation of indocyanine green in MMTV-PyMT tumors following Alk5 inhibition at different doses.
(A) Representative optical scans demonstrate higher fluorescence at increasing doses of Alk5 inhibitor treatment as compared with vehicle treated age-matched tumor (arrows). Liver fluorescence is not significantly different. (B) Quantitative fluorescence signal of vehicle- and Alk5 inhibitor-treated MMTV-PyMT tumors. Data are displayed as mean tumor fluorescence of 4 animals in each group (± SD). ANOVA was used to compare the differences between various groups. *P < 0.05, **P < 0.005. Alk5, activin-like kinase 5; Alk5i, Alk5 inhibition; MMTV-PyMT, mouse mammary tumor virus–driven expression of the polyoma middle T oncogene.
Figure 6
Figure 6. Increased accumulation of indocyanine green in MMTV-PyMT tumors following Alk5 inhibition.
(A) Representative intravital microscopy images confirm markedly increased indocyanine green (ICG) tumor delivery after Alk5 inhibition (top), while tumor vascularity (bottom) did not change. Scale bar: 100 μm. (B) Corresponding quantitative data demonstrate a significantly increased ICG fluorescence signal in Alk5-treated tumors compared with sham-treated controls. Data are displayed as mean tumor fluorescence and SD of 4 animals in each group before and after ICG injection. At least 3 nonoverlapping fields of immunofluorescence images were counted per animal. ANOVA was used to compare the differences between various groups. *P < 0.05. Results are representative of 3 independent experiments. Alk5, activin-like kinase 5; Alk5i, Alk5 inhibition; MMTV-PyMT, mouse mammary tumor virus–driven expression of the polyoma middle T oncogene.
Figure 7
Figure 7. Alk5 inhibition leads to increased iron oxide nanoparticle accumulation and enhancement of orthotopic glioblastomas on MR images.
(A) Representative coronal T2-weighted MR images (top) and T1-weighted MR images (bottom) before and after i.v. injection of ferumoxytol nanoparticles show stronger tumor enhancement after Alk5 inhibition (arrow) compared with untreated tumors (arrowhead). (B and C) Representative plots for dynamic contrast ferumoxytol scans in blood pool versus tumor tissue of mice treated with or without Alk5 inhibitor. ΔR1 values for blood pool from PBS- or Alk5-treated mice are represented on the primary y axis, whereas ΔR1 values for tumors are represented on secondary y axis. (D and E) Corresponding quantitative changes in tumor R2 and R1 relaxation rates after ferumoxytol injection, measured as R2precontrast – R2postcontrast or R1precontrast – R1postcontrast and displayed as means for 9 animals in each group ± SD, respectively. ANOVA was used to compare the differences between various groups. *P < 0.05, **P < 0.005, between MR enhancements of Alk5-treated tumors compared with untreated controls. (F) H&E and Prussian blue staining of a representative Alk5 inhibitor-treated glioblastoma (right) and untreated control (left) mice (original magnification, ×20). Prussian blue staining shows increased ferumoxytol deposition in Alk5 inhibitor-treated glioblastoma. Scale bar: 100 μm. Alk5, activin-like kinase 5; Alk5i, Alk5 inhibition; MR, magnetic resonance

References

    1. Albanese A, Tang PS, Chan WC. The effect of nanoparticle size, shape, and surface chemistry on biological systems. Annu Rev Biomed Eng. 2012;14:1–16. doi: 10.1146/annurev-bioeng-071811-150124. - DOI - PubMed
    1. Daldrup-Link HE, et al. Decrease in tumor apparent permeability-surface area product to a MRI macromolecular contrast medium following angiogenesis inhibition with correlations to cytotoxic drug accumulation. Microcirculation. 2004;11(5):387–396. doi: 10.1080/10739680490457665. - DOI - PubMed
    1. Daldrup-Link HE, Simon GH, Brasch RC. Imaging of tumor angiogenesis: current approaches and future prospects. Curr Pharm Des. 2006;12(21):2661–2672. doi: 10.2174/138161206777698774. - DOI - PubMed
    1. Dreaden EC, Mackey MA, Huang X, Kang B, El-Sayed MA. Beating cancer in multiple ways using nanogold. Chem Soc Rev. 2011;40(7):3391–3404. doi: 10.1039/c0cs00180e. - DOI - PMC - PubMed
    1. Ferrara K, Pollard R, Borden M. Ultrasound microbubble contrast agents: fundamentals and application to gene and drug delivery. Annu Rev Biomed Eng. 2007;9:415–447. doi: 10.1146/annurev.bioeng.8.061505.095852. - DOI - PubMed