

The Status of Honey Bee Health in Italy: Results from the Nationwide Bee Monitoring Network
- PMID: 27182604
- PMCID: PMC4868308
- DOI: 10.1371/journal.pone.0155411
The Status of Honey Bee Health in Italy: Results from the Nationwide Bee Monitoring Network
Abstract
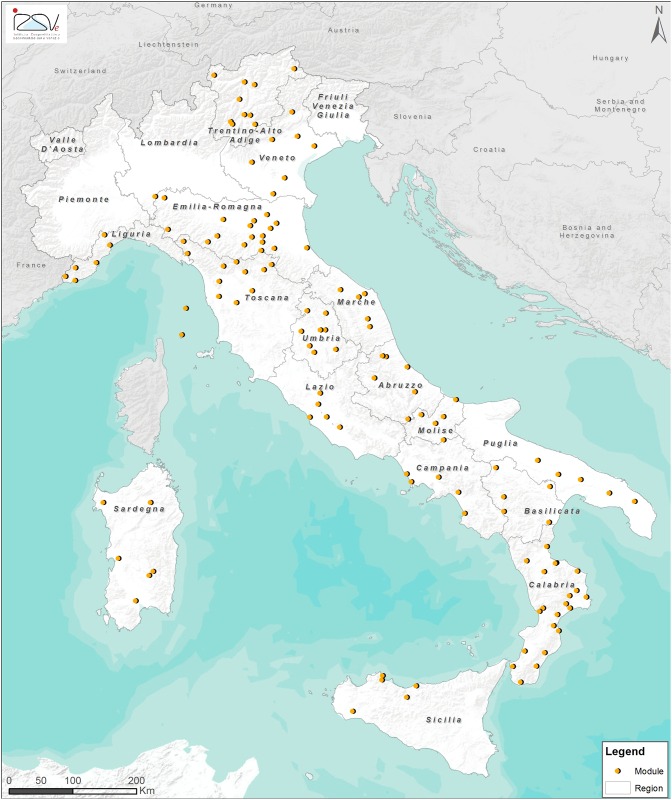
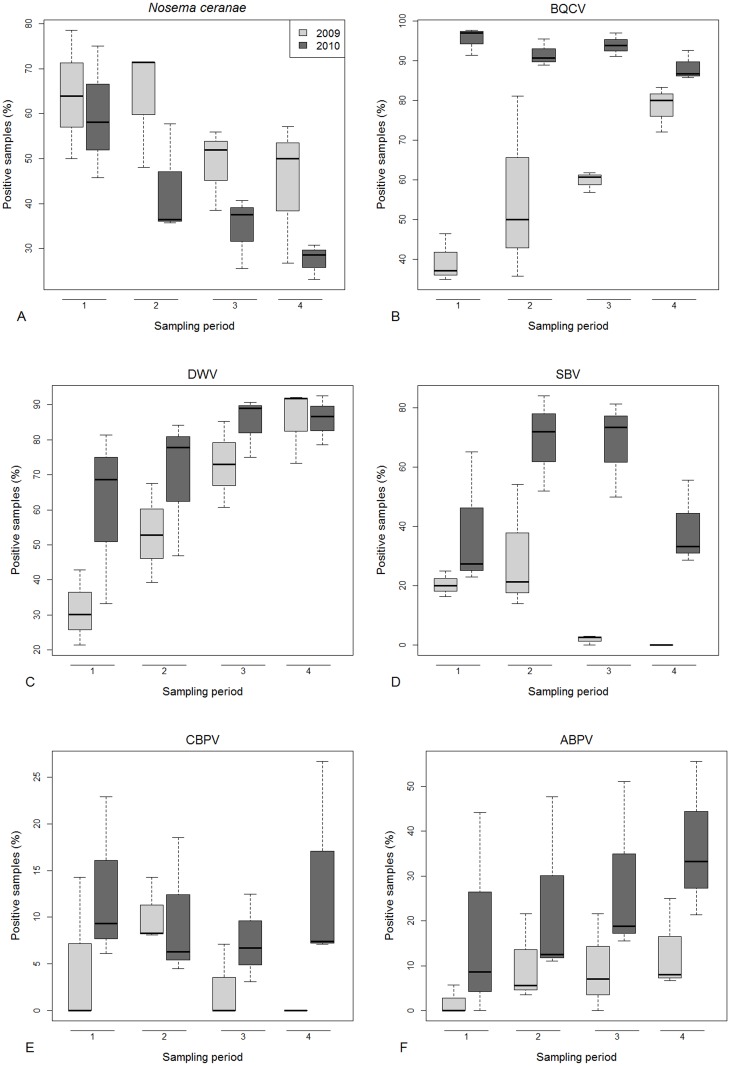
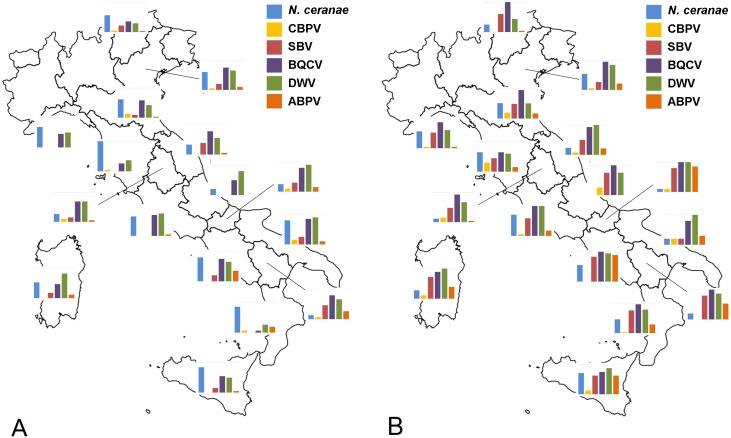
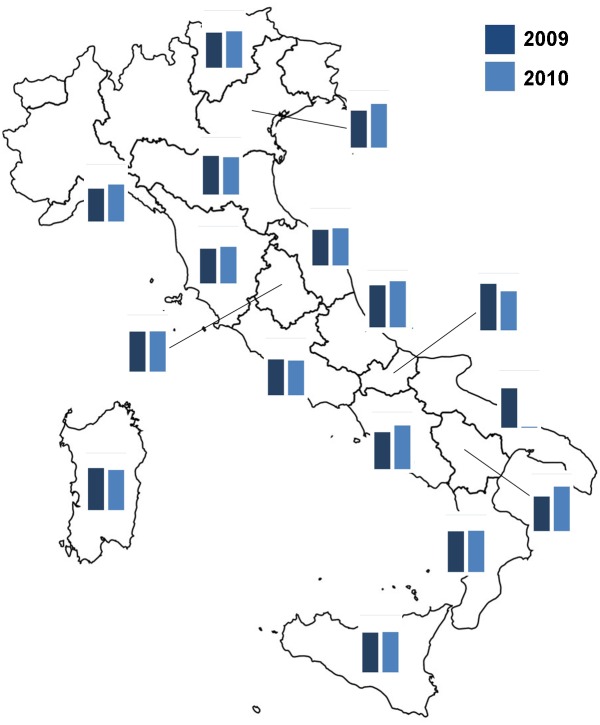
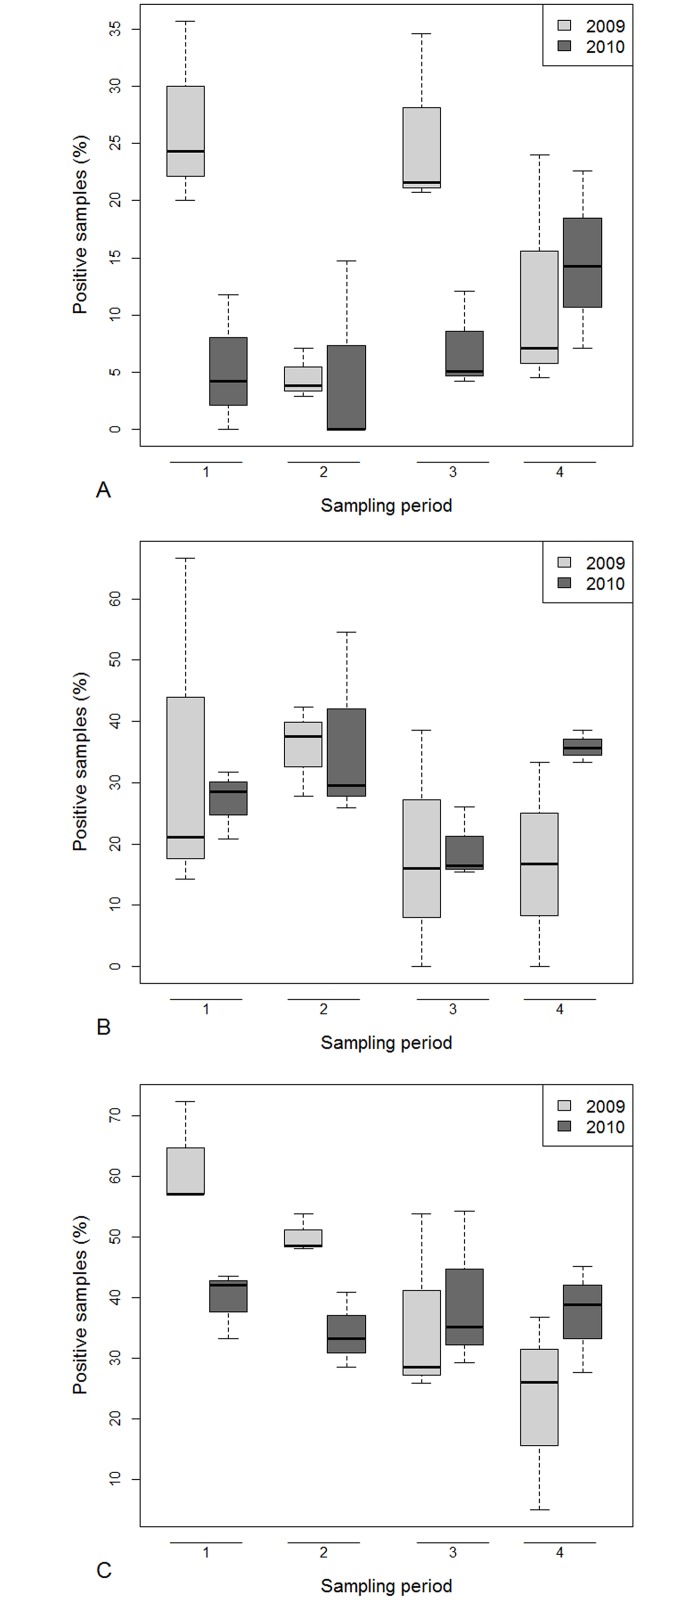
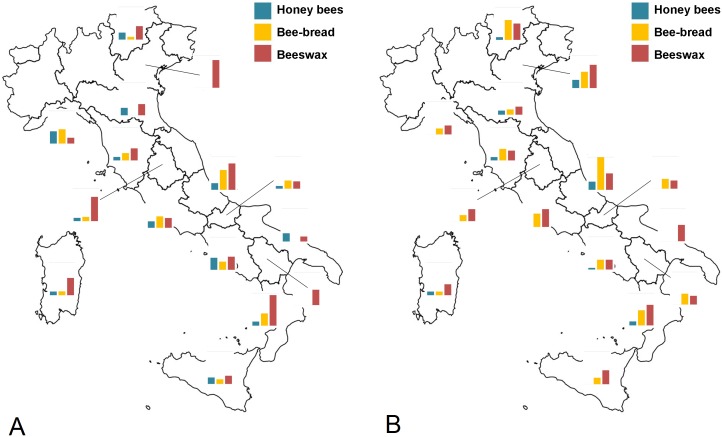
In Italy a nation-wide monitoring network was established in 2009 in response to significant honey bee colony mortality reported during 2008. The network comprised of approximately 100 apiaries located across Italy. Colonies were sampled four times per year, in order to assess the health status and to collect samples for pathogen, chemical and pollen analyses. The prevalence of Nosema ceranae ranged, on average, from 47-69% in 2009 and from 30-60% in 2010, with strong seasonal variation. Virus prevalence was higher in 2010 than in 2009. The most widespread viruses were BQCV, DWV and SBV. The most frequent pesticides in all hive contents were organophosphates and pyrethroids such as coumaphos and tau-fluvalinate. Beeswax was the most frequently contaminated hive product, with 40% of samples positive and 13% having multiple residues, while 27% of bee-bread and 12% of honey bee samples were contaminated. Colony losses in 2009/10 were on average 19%, with no major differences between regions of Italy. In 2009, the presence of DWV in autumn was positively correlated with colony losses. Similarly, hive mortality was higher in BQCV infected colonies in the first and second visits of the year. In 2010, colony losses were significantly related to the presence of pesticides in honey bees during the second sampling period. Honey bee exposure to poisons in spring could have a negative impact at the colony level, contributing to increase colony mortality during the beekeeping season. In both 2009 and 2010, colony mortality rates were positively related to the percentage of agricultural land surrounding apiaries, supporting the importance of land use for honey bee health.
Conflict of interest statement
Figures
Similar articles
-
A 3-year survey of Italian honey bee-collected pollen reveals widespread contamination by agricultural pesticides.Sci Total Environ. 2018 Feb 15;615:208-218. doi: 10.1016/j.scitotenv.2017.09.226. Epub 2017 Sep 29. Sci Total Environ. 2018. PMID: 28968582
-
Pesticide residues in honey bees, pollen and beeswax: Assessing beehive exposure.Environ Pollut. 2018 Oct;241:106-114. doi: 10.1016/j.envpol.2018.05.062. Epub 2018 May 24. Environ Pollut. 2018. PMID: 29803024
-
Effects of Wintering Environment and Parasite-Pathogen Interactions on Honey Bee Colony Loss in North Temperate Regions.PLoS One. 2016 Jul 22;11(7):e0159615. doi: 10.1371/journal.pone.0159615. eCollection 2016. PLoS One. 2016. PMID: 27448049 Free PMC article.
-
Viral impacts on honey bee populations: A review.Saudi J Biol Sci. 2021 Jan;28(1):523-530. doi: 10.1016/j.sjbs.2020.10.037. Epub 2020 Oct 28. Saudi J Biol Sci. 2021. PMID: 33424335 Free PMC article. Review.
-
Honey bee pathology: current threats to honey bees and beekeeping.Appl Microbiol Biotechnol. 2010 Jun;87(1):87-97. doi: 10.1007/s00253-010-2573-8. Epub 2010 Apr 17. Appl Microbiol Biotechnol. 2010. PMID: 20401479 Review.
Cited by
-
Detection of replicative Kashmir Bee Virus and Black Queen Cell Virus in Asian hornet Vespa velutina (Lepelieter 1836) in Italy.Sci Rep. 2019 Jul 12;9(1):10091. doi: 10.1038/s41598-019-46565-2. Sci Rep. 2019. PMID: 31300700 Free PMC article.
-
Pesticide residue survey of pollen loads collected by honeybees (Apis mellifera) in daily intervals at three agricultural sites in South Germany.PLoS One. 2018 Jul 6;13(7):e0199995. doi: 10.1371/journal.pone.0199995. eCollection 2018. PLoS One. 2018. PMID: 29979756 Free PMC article.
-
Detection of honey bee viruses in larvae of Vespa orientalis.Front Cell Infect Microbiol. 2023 Jun 23;13:1207319. doi: 10.3389/fcimb.2023.1207319. eCollection 2023. Front Cell Infect Microbiol. 2023. PMID: 37424785 Free PMC article.
-
The Heat Shock Response in the Western Honey Bee (Apis mellifera) is Antiviral.Viruses. 2020 Feb 22;12(2):245. doi: 10.3390/v12020245. Viruses. 2020. PMID: 32098425 Free PMC article.
-
Nosema Disease of European Honey Bees.J Fungi (Basel). 2021 Aug 30;7(9):714. doi: 10.3390/jof7090714. J Fungi (Basel). 2021. PMID: 34575752 Free PMC article. Review.
References
-
- Aizen MA, Harder LD. The global stock of domesticated honey bees is growing slower than agricultural demand for pollination. Curr Biol 2009; 19: 1–4. - PubMed
-
- Potts SG, Roberts SPM, Dean R, Marris G, Brown MA, Jones HR, et al. Declines of managed honey bees and beekeepers in Europe. J Apic Res 2010; 49, 15–22.
-
- Cox-Foster DL, Conlan S, Holmes EC, Palacios G, Evans JD, Moran NA, et al. A metagenomic survey of microbes in honey bee colony collapse disorder. Science 2007; 318, 283–287. - PubMed
-
- vanEngelsdorp D, Underwood R, Caron D, Hayes J. An estimate of managed colony losses in the winter of 2006–2007: A report commissioned by the apiary inspectors of America. Am Bee J 2007;147, 599–603.
-
- Underwood RM, vanEngelsdorp D. Colony Collapse Disorder: have we seen this before? Bee Culture 2007; 135: 13–18.
Publication types
MeSH terms
Substances
LinkOut - more resources
Full Text Sources
Other Literature Sources
