. 2016 Jul;48(7):803-10.
doi: 10.1038/ng.3572. Epub 2016 May 16.

A method to decipher pleiotropy by detecting underlying heterogeneity driven by hidden subgroups applied to autoimmune and neuropsychiatric diseases

Affiliations

A method to decipher pleiotropy by detecting underlying heterogeneity driven by hidden subgroups applied to autoimmune and neuropsychiatric diseases

Buhm Han et al. Nat Genet. 2016 Jul.

Abstract

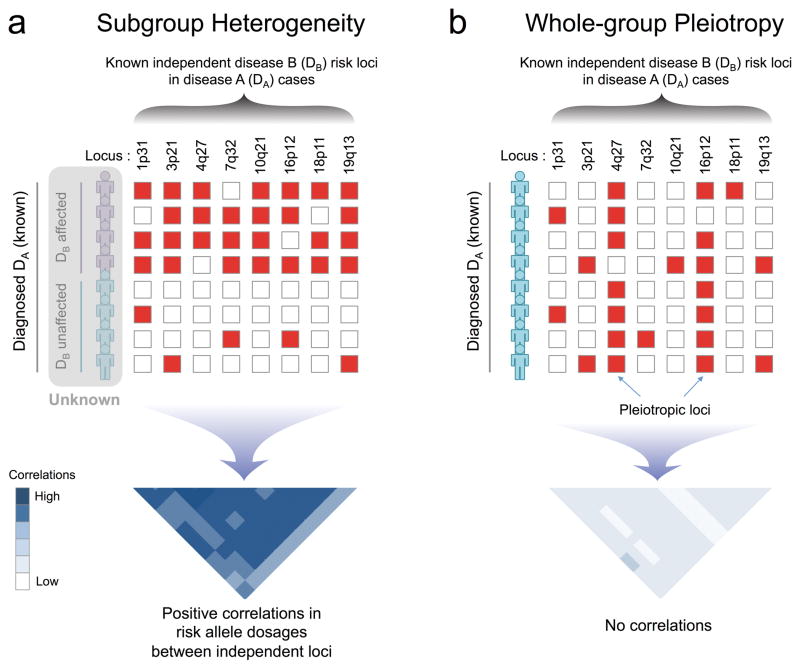
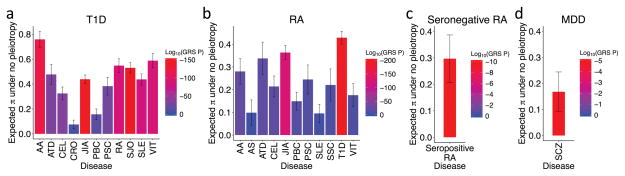
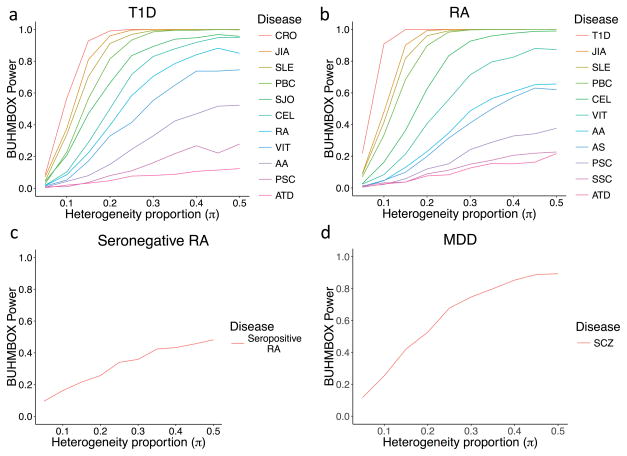
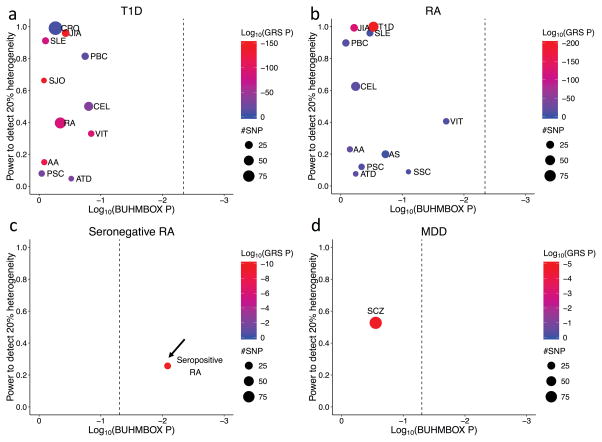
There is growing evidence of shared risk alleles for complex traits (pleiotropy), including autoimmune and neuropsychiatric diseases. This might be due to sharing among all individuals (whole-group pleiotropy) or a subset of individuals in a genetically heterogeneous cohort (subgroup heterogeneity). Here we describe the use of a well-powered statistic, BUHMBOX, to distinguish between those two situations using genotype data. We observed a shared genetic basis for 11 autoimmune diseases and type 1 diabetes (T1D; P < 1 × 10(-4)) and for 11 autoimmune diseases and rheumatoid arthritis (RA; P < 1 × 10(-3)). This sharing was not explained by subgroup heterogeneity (corrected PBUHMBOX > 0.2; 6,670 T1D cases and 7,279 RA cases). Genetic sharing between seronegative and seropostive RA (P < 1 × 10(-9)) had significant evidence of subgroup heterogeneity, suggesting a subgroup of seropositive-like cases within seronegative cases (PBUHMBOX = 0.008; 2,406 seronegative RA cases). We also observed a shared genetic basis for major depressive disorder (MDD) and schizophrenia (P < 1 × 10(-4)) that was not explained by subgroup heterogeneity (PBUHMBOX = 0.28; 9,238 MDD cases).


Conflict of interest statement

The authors declare no competing financial interests.

Figures

Figure 1
Figure 1. Overview of BUHMBOX
(a) Under the scenario of subgroup heterogeneity, risk alleles of disease B (DB)-associated loci will be enriched in a subgroup of disease A (DA) cases, producing positive correlations between DB risk allele dosages from independent loci. (b) Under the scenario where there is no heterogeneity and DA and DB share alleles due to pleiotropy (i.e. whole-group pleiotropy), DB risk alleles will be uniformly distributed and have no correlations. Red boxes: risk alleles; white boxes: non-risk alleles.
Figure 2
Figure 2. Power gain by weighting SNPs by allele frequency and effect size
We compared the statistical power of BUHMBOX with a weighting scheme that optimally weights correlations between SNPs (weighted) to an alternative approach that weights correlations uniformly (unweighted; equation (12) in Supplementary Note). We simulated 1,000 case individuals and assumed 50 risk loci, whose OR and RAFs were sampled from the GWAS catalog. Colored bands denote 95% confidence intervals of power estimates.
Figure 3
Figure 3. BUHMBOX power analysis
Power of BUHMBOX for detecting heterogeneity as a function of the number of risk loci, number of case samples, and the proportion of samples that actually have different phenotype (heterogeneity proportion, π). We assume that we have the same number of controls as cases. White lines denote 20, 40, 60, and 80% power. (a) Power as a function of number of case individuals and heterogeneity proportion, when the number of risk loci is fixed at 50. (b) Power as a function of number of risk loci and heterogeneity proportion, when the case sample size is fixed at 2,000.
Figure 4
Figure 4. Genetic sharing between autoimmune diseases and psychiatric disorders
In (a) and (b), we show only the diseases that have significantly positive GRS p-values out of the 17 tested. Y-axis denotes the expected heterogeneity proportion (π) to explain observed genetic sharing. Vertical bars indicate 95% confidence intervals. Heterogeneity proportion estimates are based on GRS analysis, assuming no pleiotropy for (a) T1D, (b) RA, (c) seronegative RA, and (d) MDD.
Figure 5
Figure 5. Statistical power of BUHMBOX to detect heterogeneity
We calculated power by performing 1,000 simulations with corresponding sample size, number of risk alleles, risk allele frequencies, and odds ratios. To calculate power for (c) and (d), we used a significance threshold of 0.05. For (a) and (b), the threshold was adjusted using the Bonferroni correction accounting for 11 tests in T1D and RA, respectively.
Figure 6
Figure 6. BUHMBOX results
We show only diseases with significantly positive GRS p-values (for complete results for all traits tested, see Supplementary Table 4). Significant GRS p-values indicate evidence of shared genetic structure; significant BUHMBOX p-value indicates evidence of heterogeneity. Point size represents the number of DB-associated SNPs included in the analysis. Dashed vertical lines denote the Bonferroni-adjusted significance threshold for the BUHMBOX test statistic. Arrow indicates significant BUHMBOX test statistic.

References

    1. Sivakumaran S, et al. Abundant pleiotropy in human complex diseases and traits. Am J Hum Genet. 2011;89:607–618. - PMC - PubMed
    1. Cotsapas C, et al. Pervasive sharing of genetic effects in autoimmune disease. PLoS Genet. 2011;7:e1002254. - PMC - PubMed
    1. Cross-Disorder Group of the Psychiatric Genomics Consortium. Identification of risk loci with shared effects on five major psychiatric disorders: a genome-wide analysis. Lancet. 2013;381:1371–1379. - PMC - PubMed
    1. Fortune MD, et al. Statistical colocalization of genetic risk variants for related autoimmune diseases in the context of common controls. Nat Genet. 2015;47:839–846. - PMC - PubMed
    1. Lee SH, Yang J, Goddard ME, Visscher PM, Wray NR. Estimation of pleiotropy between complex diseases using single-nucleotide polymorphism-derived genomic relationships and restricted maximum likelihood. Bioinformatics. 2012;28:2540–2542. - PMC - PubMed

Publication types

MeSH terms

Substances