. 2016 Jun;22(6):657-65.
doi: 10.1038/nm.4109. Epub 2016 May 16.

Activation of the pluripotency factor OCT4 in smooth muscle cells is atheroprotective

Affiliations

Activation of the pluripotency factor OCT4 in smooth muscle cells is atheroprotective

Olga A Cherepanova et al. Nat Med. 2016 Jun.

Abstract

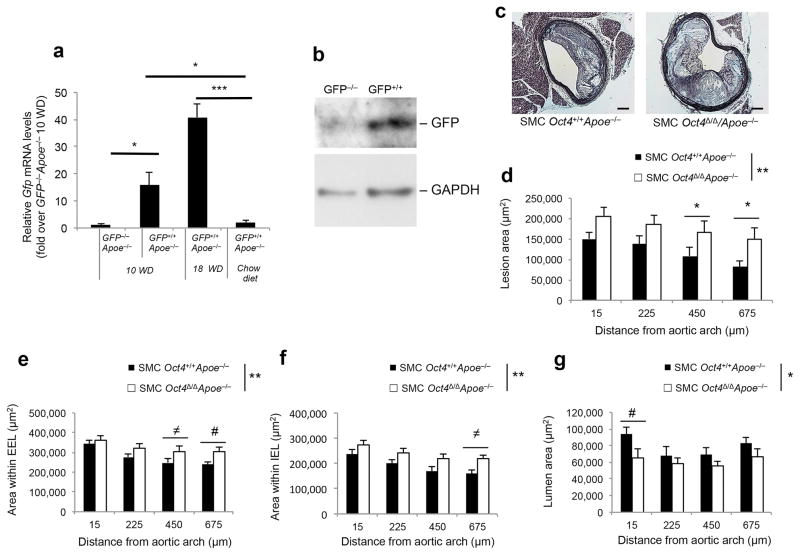
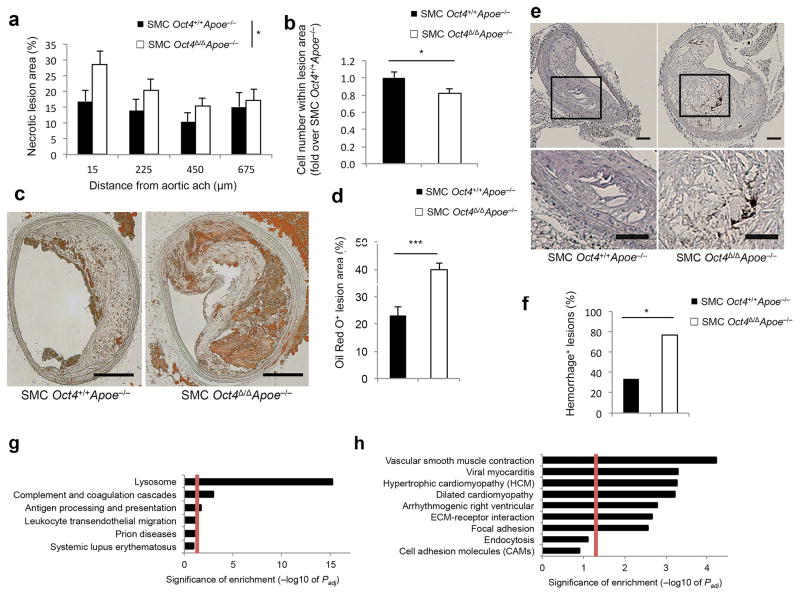
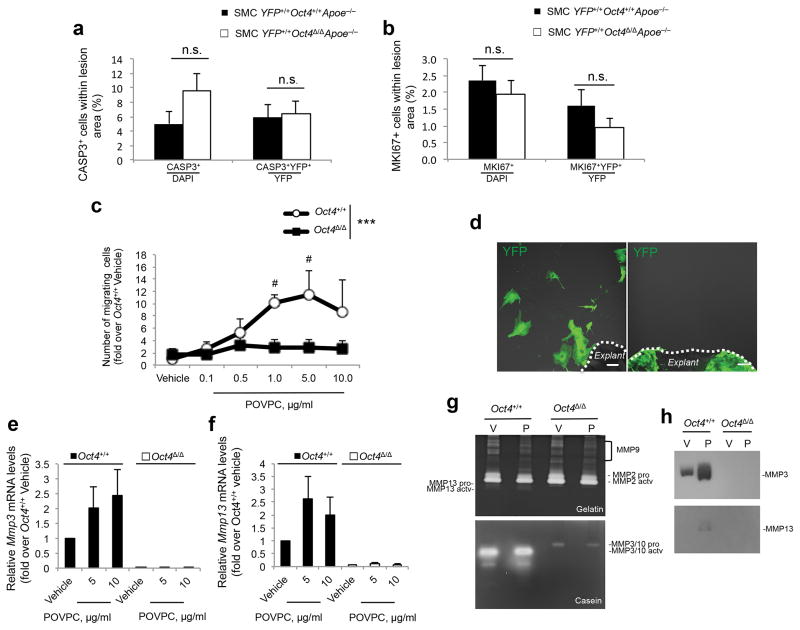
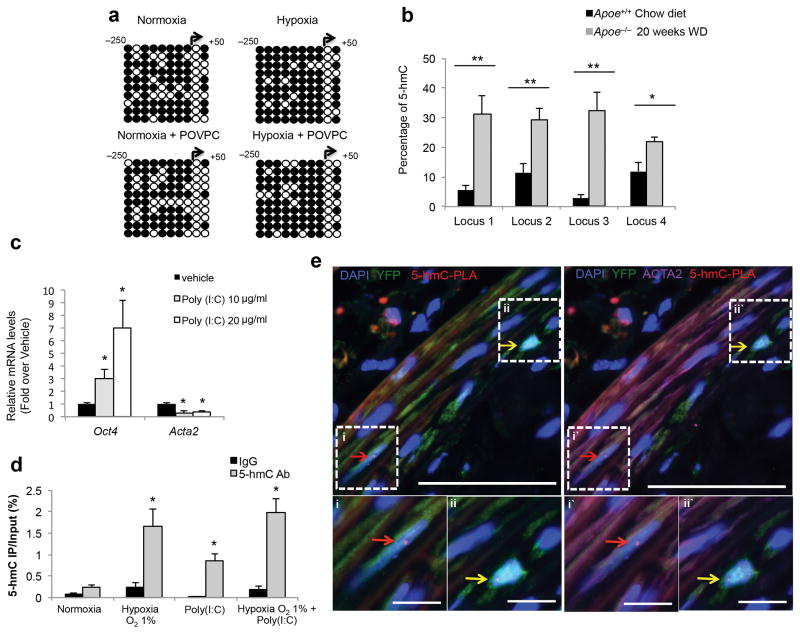
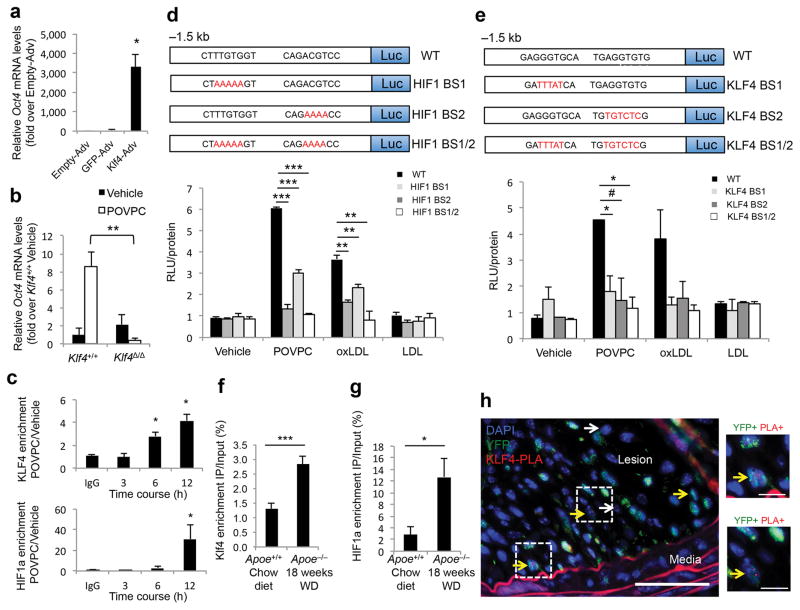
Although somatic cell activation of the embryonic stem cell (ESC) pluripotency factor OCT4 has been reported, this previous work has been controversial and has not demonstrated a functional role for OCT4 in somatic cells. Here we demonstrate that smooth muscle cell (SMC)-specific conditional knockout of Oct4 in Apoe(-/-) mice resulted in increased lesion size and changes in lesion composition that are consistent with decreased plaque stability, including a thinner fibrous cap, increased necrotic core area, and increased intraplaque hemorrhage. Results of SMC-lineage-tracing studies showed that these effects were probably the result of marked reductions in SMC numbers within lesions and SMC investment within the fibrous cap, which may result from impaired SMC migration. The reactivation of Oct4 within SMCs was associated with hydroxymethylation of the Oct4 promoter and was hypoxia inducible factor-1α (HIF-1α, encoded by HIF1A) and Krüppel-like factor-4 (KLF4)-dependent. These results provide the first direct evidence that OCT4 has a functional role in somatic cells, and they highlight the potential role of OCT4 in normal and diseased somatic cells.


Conflict of interest statement

Competing financial interests

The authors declare no competing financial interests.

Figures

Figure 1
Figure 1. Activation of Oct4 in SMCs within the atherosclerotic lesions regulates plaque size
(a) Quantification of Gfp mRNA levels within BCA regions of Oct4-IRES-GFP+/+Apoe−/− or Oct4-IRES-GFP−/−Apoe−/− mice fed a high-fat Western diet for 10 or 18 weeks. *P < 0.05, ***P < 0.001 by one way Analysis of Variance (ANOVA). IRES-GFP+/+ApoE−/− (n = 4 for 10 or 18 weeks of diet), Oct4-IRES-GFP−/−Apoe−/− (n = 3), Oct4-IRES-GFP+/+/Apoe+/+ chow diet control (n = 4). (b) Western blot showing protein levels of GFP and GAPDH within BCA regions of Oct4-IRES-GFP+/+Apoe−/− or Oct4-IRES-GFP−/−Apoe−/− mice fed a high-fat Western diet for 18 weeks. (c) Movat staining of a representative BCA from a SMC Oct4+/+Apoe−/− and SMC Oct4Δ/ΔApoe−/− mouse. Scale bar, 50 μm. (d) Quantitative analysis of (d) atherosclerotic lesion area, (e) area within the external elastic lamina (EEL), (f) area within the internal elastic lamina (IEL) and (g) lumen area based on the Movat staining of the cross-sections of atherosclerotic lesions within the BCAs of SMC Oct4+/+Apoe−/− compared to SMC Oct4Δ/ΔApoe−/− mice. Values represent mean ± s.e.m. *P < 0.05, **P < 0.01 SMC Oct4+/+Apoe−/− (n = 12) versus SMC Oct4Δ/ΔApoe−/− (n = 14) across multiple locations along the BCA. Data were analyzed by linear mixed model ANOVA followed by Tukey’s post hoc test (#P < 0.05, P < 0.08) (eg) or non-parametric ANOVA (d).
Figure 2
Figure 2. SMC-specific conditional knockout of the pluripotency gene Oct4 increased multiple indices of atherosclerotic plaque instability
(a) Necrotic core area. Values represent mean ± s.e.m. *P < 0.05 for SMC Oct4+/+Apoe−/− (n = 12) versus SMC Oct4Δ/ΔApoe−/− (n = 14) mice by linear mixed model ANOVA. (b) Cell density analysis. Values represent mean ± s.e.m. *P < 0.05 for SMC YFP+/+Oct4+/+Apoe−/− (n = 9) versus SMC YFP+/+Oct4Δ/ΔApoe−/− (n = 14) mice by Student t-test. (c) Oil Red O staining of representative BCA sections of SMC YFP+/+Oct4+/+Apoe−/− and SMC YFP+/+Oct4Δ/ΔApoe−/− mice. Scale bar, 100 μm. (d) Quantification of the percentage of Oil Red O positive lesion area. Values represent mean ± s.e.m. ***P < 0.001 for SMC YFP+/+Oct4+/+Apoe−/− (n = 6) versus SMC YFP+/+Oct4Δ/ΔApoe−/− (n = 9) by Student t-test. (e) Immunostaining for the red blood cell marker TER-119. Scale bar, 50 μm. (f) The percentage of BCAs exhibiting intraplaque hemorrhage based on TER119 staining. *P < 0.05 SMC Oct4+/+Apoe−/− (n = 12) versus SMC Oct4Δ/ΔApoe−/− (n = 14) mice by Fisher’s exact test. (g,h) Pathway enrichment charts displaying pathways that were up-regulated (g) or down-regulated (h) in the BCA/aortic root regions of 18 weeks Western diet fed SMC YFP+/+Oct4Δ/ΔApoe−/− mice (n = 4) compared to SMC YFP+/+Oct4+/+Apoe−/− (n = 4) based on RNA-seq analysis. Red lines mark pathways that are significantly enriched (adjusted P value (Padj ≤ 0.05). Enrichment is shown as −log10 of Padj values.
Figure 3
Figure 3. SMC-specific conditional knockout of the pluripotency gene Oct4 resulted in reduced numbers of lesion SMCs
(a) Immunostaining of representative BCA sections of SMC YFP+/+Oct4+/+Apoe−/− and SMC YFP+/+Oct4Δ/ΔApoe−/− mice fed a Western diet for 18 weeks showing a marked decrease in the number of SMC-derived YFP+ cells within lesions of SMC YFP+/+Oct4Δ/ΔApoe−/− mice as compared to control SMC YFP+/+Oct4+/+Apoe−/− mice. Scale bars, 50 μm. (b) Quantification of the percentage of YFP+ cells within atherosclerotic lesions. Values represent the percent of YFP+ cells within the total cell population based on DAPI staining. Data were analyzed for differences across multiple locations along the BCA by linear mixed-model ANOVA, mean ± s.e.m. **P < 0.01. (c,d) Quantification of the percentages of YFP+, ACTA2+, MYH11+ and LGALS3+ cells within the 30 μm fibrous cap area. (e,f) Quantification of the percentages of LGALS3+, YFP+LGALS3+ (macrophage-like SMCs) cells within the tunica media (e) and lesion area (f). (cf) Values represent mean ± s.e.m. *P < 0.05, **P < 0.01, #P = 0.05, P = 0.08, P = 0.15 SMC YFP+/+Oct4+/+Apoe−/− (n = 10) versus SMC YFP+/+Oct4Δ/ΔApoe−/− (n = 14) mice by Student t-test (f) or Satterthwaite t-test (e).
Figure 4
Figure 4. Loss of Oct4 within SMCs was associated with impaired SMC migration, reduced expression of Mmp3 and Mmp13, but no change in apoptosis or proliferation
(a,b) Quantification of the percentages of total CASP3+ cells, and YFP+CASP3+ over YFP+ (a) or total MKI67+ cells, and YFP+MKI67+ over YFP+ cells (b) within BCA atherosclerotic lesions (see representative images in Supplementary Fig. 6). Data were analyzed by non-parametric ANOVA for SMC YFP+/+Oct4+/+Apoe−/− (n = 9) versus SMC YFP+/+Oct4Δ/ΔApoe−/− (n = 14) mice, n.s., nonsignificant. (c) Migration of Oct4+/+ and Oct4Δ/Δ SMCs in response to POVPC. ***P < 0.001 Oct4+/+ versus Oct4Δ/Δ SMCs by linear mixed model ANOVA, #P < 0.05 vehicle versus POVPC by Tukey’s post hoc test. (d) Representative image of the migration assay in freshly isolated aortic explants from SMC YFP+/+Oct4+/+ (right, n = 5, all explants demonstrated outgrowth of YFP+ cells) or SMC YFP+/+Oct4Δ/Δ mice (left, n = 5, no explants had YFP+ cell outgrowth). Scale bar, 50 μm. (e,f) Quantification of Mmp3 (e) and Mmp13 (f) mRNA expression in Oct4+/+ and Oct4Δ/Δ SMCs treated with vehicle or POVPC, (ac,e and f) Values represent mean ± s.e.m. (c,e and f) n = 3 independent experiments. (g,h) Conditioned media from Oct4+/+ and Oct4Δ/Δ SMCs treated with vehicle (V) or POVPC (P) were analyzed by Gelatin (g, top panel) or Casein (g, bottom panel) Zymography or by Western blot using antibody specific to MMP3 or MMP13 (h).
Figure 5
Figure 5. Activation of the Oct4 promoter in vitro and in vivo was associated with increased hydroxymethylation
(a) Bisulfite sequencing analysis of the Oct4 promoter in cultured SMCs in response to hypoxia ± POVPC versus normoxia ± POVPC. See Supplementary Fig. 14 for more details. Open circles indicate unmethylated cytosines, and closed circles indicate methylated cytosines. (b) Sequence specific detection of 5-hmC at the Oct4 promoter within the aortic arch regions of Apoe−/− mice fed a high-fat diet as compared to the control age-matched ApoE+/+ mice fed a chow diet as determined by glycosylation-coupled methylation sensitive qPCR. **P < 0.05 for Apoe−/− (n = 6) versus Apoe+/+ (n = 6) by Student’s t-test. (c) Quantification of Oct4 and Acta2 mRNA expression in cultured SMCs treated with poly(I:C). *P < 0.05 versus vehicle by Student’s t-test. (d) hMeDIP assays showing enrichment of 5-hmC at the Oct4 promoter in SMCs treated with either hypoxia, or poly(I:C), or both. DNA was precipitated with an antibody for 5-hmC or with an isotope-matched control antibody (IgG). *P < 0.05 versus normoxia by Student’s t-test. (b,c and d) Values represent mean ± s.e.m. (c,d) n = 3 independent experiments. (e) ISH-PLA assay showing hydroxymethylation of the Oct4 promoter within atherosclerotic arteries of SMC YFP+/+Apoe−/− mouse (red dots). Arrows indicate examples of YFP+ACTA2+5-hmC-PLA+ cells (red arrows), YFP+ACTA25-hmC-PLA+ cells (yellow arrows). Bars = 50 μm. Bottom panels i, ii and i′, ii′ represent magnified boxed areas from the top panels. Bars = 10 μm.
Figure 6
Figure 6. Activation of Oct4 in SMCs was KLF4- and HIF1α-dependent
(a,b) Quantification of Oct4 mRNA expression in SMCs infected with adenoviruses (Adv) expressing KLF4, GFP or Empty-adenovirus (a) or in Klf4+/+ and Klf4Δ/Δ SMCs treated with vehicle or POVPC (b). *P < 0.05 by Student’s t-test. (c) ChIP analyses in SMCs treated with vehicle or POVPC using antibodies specific for KLF4 (top panel), HIF1α (bottom panel) or control IgG. *P < 0.05 versus IgG control (12 hours) by Student’s t-test. (d,e) Cultured rat aortic SMCs transfected with either the wild type (WT), KLF4 binding site mutants (KLF4 BS1, 2, 1/2), or HIF1α binding site mutants (HIF BS1, 2, 1/2) Oct4 promoter-luciferase constructs and treated with vehicle, POVPC, oxLDL or LDL. Values represent Relative Luciferase Units (RLU) normalized to protein. *P < 0.05, **P < 0.01, ***P < 0.001, #P = 0.07 versus WT by Student’s t-test. (ae) n = 3 independent experiments, mean ± s.e.m. (f,g) ChIP analyses using antibodies for KLF4 (f), or HIF1α (g) as compared to control IgG within chromatin isolated from blood vessels of Apoe−/− mice fed a high-fat diet or control age-matched Apoe+/+ mice fed a chow diet, mean ± s.e.m. *P < 0.05, ***P < 0.01 values Apoe−/− (n = 5) versus Apoe+/+ (n = 5) by one-way ANOVA. (h) ISH-PLA assay showing binding of KLF4 to the Oct4 promoter within atherosclerotic lesions of SMC YFP+/+Apoe−/− mice. Arrows indicate examples of YFP+KLF4-PLA+ cells (yellow arrows) and YFPKLF4-PLA+ cells (white arrows). Bars = 50 μm (left panel), 10 μm (right panels).

References

    1. Schöler HR, Ruppert S, Suzuki N, Chowdhury K, Gruss P. New type of POU domain in germ line-specific protein Oct-4. Nature. 1990;344:435–439. - PubMed
    1. Lengner CJ, Welstead GG, Jaenisch R. The pluripotency regulator Oct4. Cell Cycle. 2008;7:725–728. - PubMed
    1. Firth AL, Yao W, Remillard CV, Ogawa A, Yuan JX. Upregulation of Oct-4 isoforms in pulmonary artery smooth muscle cells from patients with pulmonary arterial hypertension. Am J Physiol Lung Cell Mol Physiol. 2010;298:L548–L557. - PMC - PubMed
    1. He W, Li K, Wang F, Qin YR, Fan QX. Expression of OCT4 in human esophageal squamous cell carcinoma is significantly associated with poorer prognosis. World J Gastroenterol. 2012;18:712–719. - PMC - PubMed
    1. Holmberg J, He X, Peredo I, Orrego A, et al. Activation of neural and pluripotent stem cell signatures correlates with increased malignancy in human glioma. PLoS One. 2011;6:e18454. - PMC - PubMed

MeSH terms