. 2016 Jun;22(6):606-13.
doi: 10.1038/nm.4100. Epub 2016 May 16.

Impact of pre-adapted HIV transmission

Affiliations

Impact of pre-adapted HIV transmission

Jonathan M Carlson et al. Nat Med. 2016 Jun.

Abstract

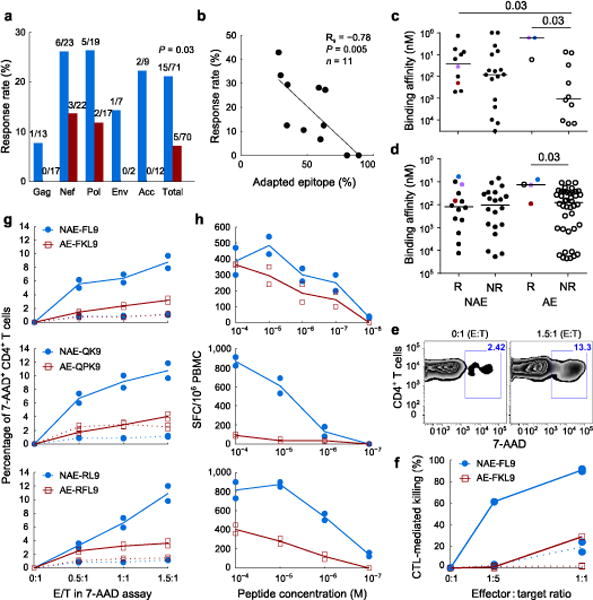
Human leukocyte antigen class I (HLA)-restricted CD8(+) T lymphocyte (CTL) responses are crucial to HIV-1 control. Although HIV can evade these responses, the longer-term impact of viral escape mutants remains unclear, as these variants can also reduce intrinsic viral fitness. To address this, we here developed a metric to determine the degree of HIV adaptation to an HLA profile. We demonstrate that transmission of viruses that are pre-adapted to the HLA molecules expressed in the recipient is associated with impaired immunogenicity, elevated viral load and accelerated CD4(+) T cell decline. Furthermore, the extent of pre-adaptation among circulating viruses explains much of the variation in outcomes attributed to the expression of certain HLA alleles. Thus, viral pre-adaptation exploits 'holes' in the immune response. Accounting for these holes may be key for vaccine strategies seeking to elicit functional responses from viral variants, and to HIV cure strategies that require broad CTL responses to achieve successful eradication of HIV reservoirs.


Figures

Figure 1
Figure 1. Adaptation of viral sequence to HLA-I alleles
(a) The distribution of adaptation scores computed for all viruses against all HLA profiles in Southern Africa (left) and British Columbia (right). Adaptation of autologous virus to host HLA (autologous adaptation) is shown in red; adaptation of a virus sequence to a different host’s HLA (heterologous adaptation) is shown in blue. Median scores for each distribution are indicated. (b) Autologous adaptation is shown for linked transmission pairs from Zambia. Colors indicate adaptation with respect to recipients’ (solid) or donors’ (dashed) HLA-A (red), -B (blue) and -C (purple) alleles or entire repertoire (black). Error bars, 95% confidence intervals. Number of samples in each time point indicated at top. Adaptation of linked donor sequence (time point ‘D’) is set to −50 d for display.
Figure 2
Figure 2. Autologous adaptation predicts faster disease progression
(a) Adaptation in controllers (VL < 50 copies/ml; left blue, n = 21) and non-controllers (middle red, n = 80, Ragon cohort; right purple, n = 383, British Columbia cohort with no missing sequence data). Right, individuals who express B*57 or B*27 (n = 11, 8, and 41, for the three cohorts, respectively). P-values, two-tailed Mann-Whitney U test. (b) Estimated HLA-specific effects on VL in the Southern Africa cohort. Estimated VL (error bars, 95% CI) relative to cohort average for individuals expressing the allele with no (blue) or with complete (red) allele-specific adaptation. Significant adaptation effects are denoted for P < 0.001 (***), P < 0.01 (**), and P < 0.05 (*), estimated from likelihood ratio test. (c) VL for each of n = 691 HIVC-infected subjects from Durban are shown, stratified by Gag-specific adaptation and OLP response breadth (above vs. below population averages). Red, below (blue, above) average OLP responses; solid bars, stratum median; dashed line, cohort median. P-values, two-tailed Mann-Whitney U-test (primary and interaction effects remain significant at P = 0.02 when treated as continuous variables in a mixed model).
Figure 3
Figure 3. Transmitted adaptation establishes clinical prognosis and largely explains which HLA alleles are protective
(a, b) Pre-adaptation of donor virus to the recipient HLA alleles among Zambian Transmission Pairs predicts CD4 decline (a) and early setpoint VL (b). (a) For visualization, individuals are stratified into above (red) and below (blue) mean transmitted adaptation; here, adaptation is scaled to define a unit change as the difference of transmitted adaptation means between the two strata. Hazard ratio (HR) and two-tailed P-value from Cox proportional hazard, computed from continuous value. Data for all individuals with longitudinal CD4 counts are shown. (c) Adaptation of founder virus from infected participants of the Step vaccine trial. Data from all individuals in both vaccine and placebo arms with at least two VL measurements prior to initiation of therapy). Rs, P-value, Spearman rank correlation. Best fit and 95% CI lines from unadjusted model. See Supplementary Table 2 for mixed model with additional covariates.
Figure 4
Figure 4. Adaptation impacts HLA-VL associations and heritability estimates
(a) Circulating allele-specific adaptation is compared against allele-specific effects on VL, as estimated from a mixed model fitted to the Southern Africa (left; n = 2,298) or British Columbia (right; n = 1,048) cohorts. Alleles selected in an independent stepwise regression analysis are shown. P-values, pseudo-R2, from mixed model with random offsets for each locus. Blue, HLA-A; red, HLA-B, purple, HLA-C. (b) Four alleles showed city-specific VL effects (Durban, Lusaka, Gaborone). Their relative VL and circulating adaptation (mean centered for each allele) is shown. P-value, pseudo-R2, from mixed model with random offset for each city. See Supplementary Fig. 8. (c) Heritability (h) estimates (95% CI) over all 275 Zambian linked transmission pairs with available VL and HLA types, stratified into tertiles by HLA-B adaptation-similarity (from left to right: low, medium, high). Donor and recipient VL adjusted for sex, age, and sample year independently for each stratum.
Figure 5
Figure 5. CTL responses against pre-adapted transmitted epitopes are dysfunctional
(a, b) Interferon-γ response rates for autologous founder epitopes. (a) Response frequencies for non-adapted (blue) and adapted (red) epitopes. Number of epitopes tested and number of responses for each protein are indicated. P-value, Fisher’s exact test over total. (b) Response rate versus proportion of autologous epitopes that are adapted, on a per-subject level. (c, d) Experimental (c) and predicted (d) HLA-peptide binding affinity for adapted (AE) and non-adapted (NAE) epitopes that elicited response (R) or not (NR). Colored points represent matched immunogenic NAE/AE pairs. Solid bars, median; P-values, Mann-Whitney test. (e–h) Epitope-specific CD8+ T-cells (effectors) assessed for cytotoxicity of activated CD4+ T-cells (targets). All results from duplicate experiments shown. Lines, mean values; dotted lines, negative controls. (e) Representative flow cytometry plot for 7-AAD+ targets in the absence (0:1 E:T) or presence (1.5:1 E:T) of effectors. (f) Relative killing of targets from HLA-matched (solid) and mismatched (dotted) donors, infected with MJ4 virus mutated to contain the NAE or AE FL9 variant and incubated with NAE- or AE-specific effectors. (g, h) Cytoxicity (g) and antigen sensitivity (h) curves are indicated for the three matched NAE/AE epitopes pairs.

Comment in

References

    1. Goonetilleke N, et al. The first T cell response to transmitted/founder virus contributes to the control of acute viremia in HIV-1 infection. J Exp Med. 2009;206:1253–72. - PMC - PubMed
    1. Pereyra F, et al. HIV Control Is Mediated in Part by CD8+ T-Cell Targeting of Specific Epitopes. J Virol. 2014;88:12937–12948. - PMC - PubMed
    1. Carlson JM, Le AQ, Shahid A, Brumme ZL. HIV-1 adaptation to HLA: a window into virus–host immune interactions. Trends Microbiol. 2015;23:212–224. - PubMed
    1. Martinez-Picado J, et al. Fitness cost of escape mutations in p24 Gag in association with control of human immunodeficiency virus type 1. J Virol. 2006;80:3617–23. - PMC - PubMed
    1. Boutwell CL, Rowley CF, Essex M. Reduced viral replication capacity of human immunodeficiency virus type 1 subtype C caused by cytotoxic-T-lymphocyte escape mutations in HLA-B57 epitopes of capsid protein. J Virol. 2009;83:2460–8. - PMC - PubMed

Publication types

MeSH terms

Substances