. 2016 Jun 1;126(6):2372-84.
doi: 10.1172/JCI85396. Epub 2016 May 16.

Enzyme replacement with PEGylated cystathionine β-synthase ameliorates homocystinuria in murine model

Enzyme replacement with PEGylated cystathionine β-synthase ameliorates homocystinuria in murine model

Erez M Bublil et al. J Clin Invest. .

Abstract

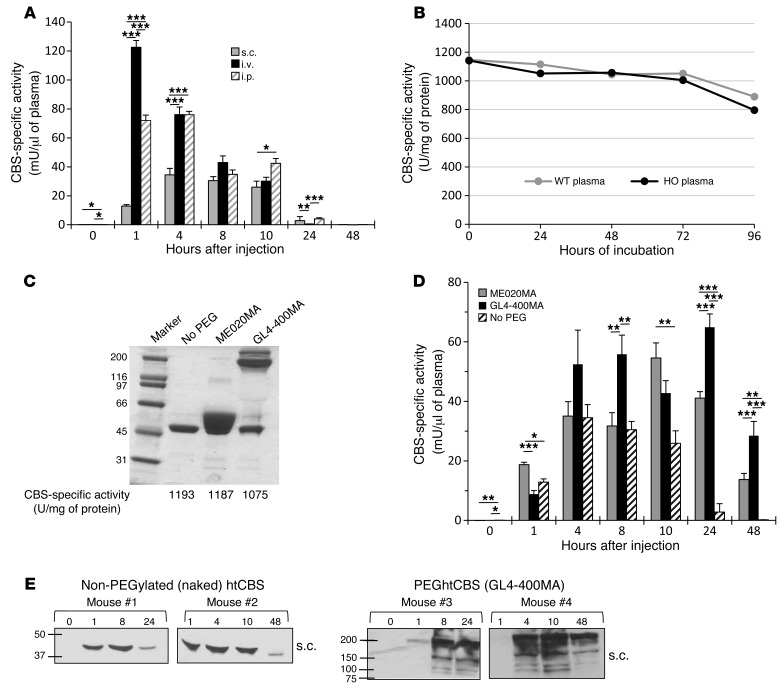
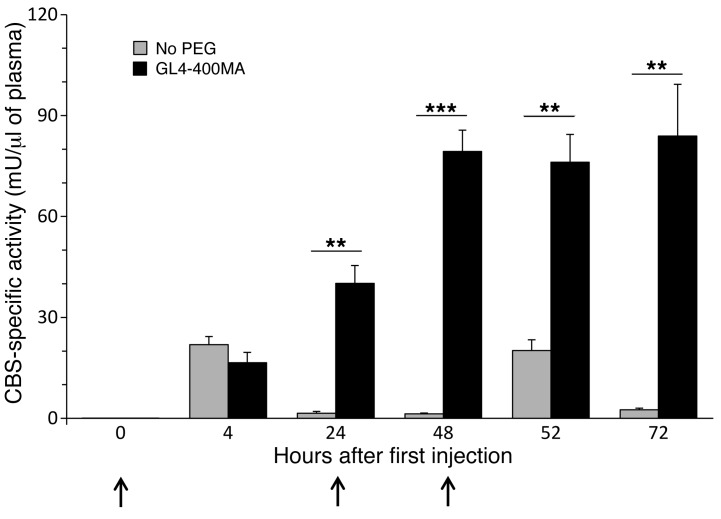
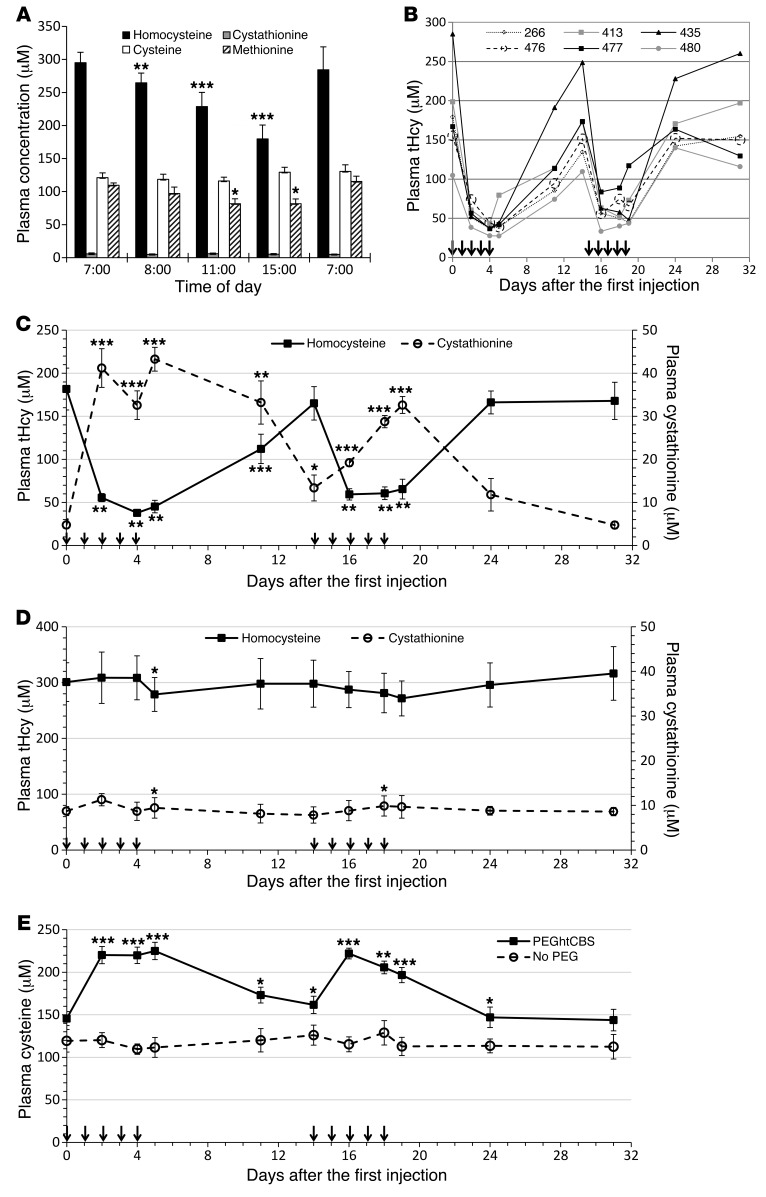
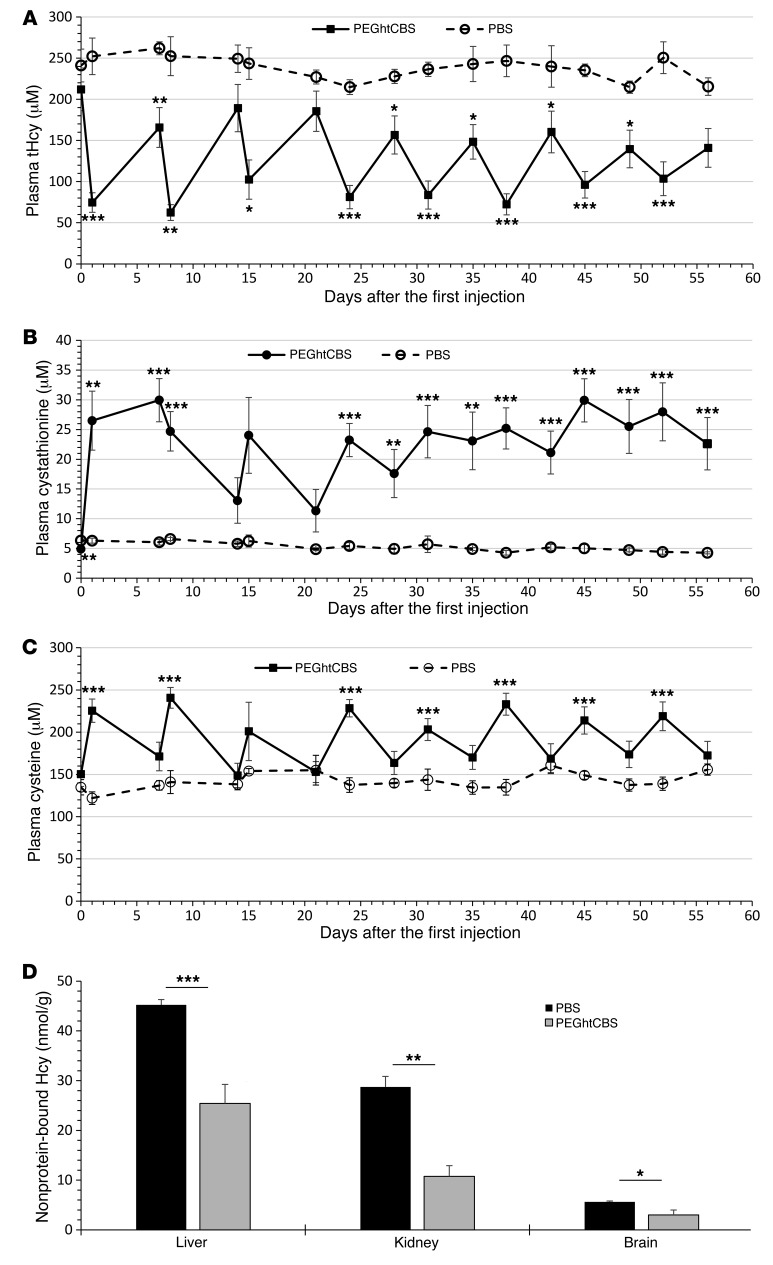
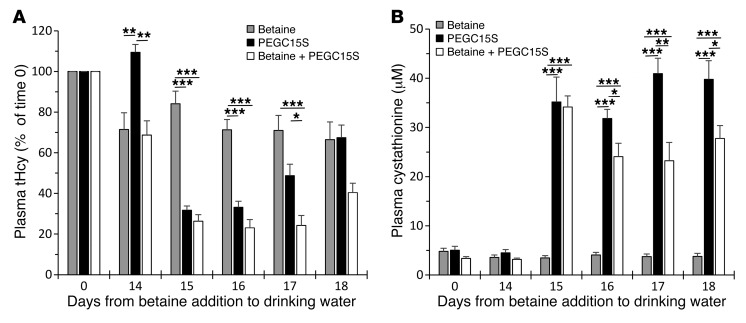
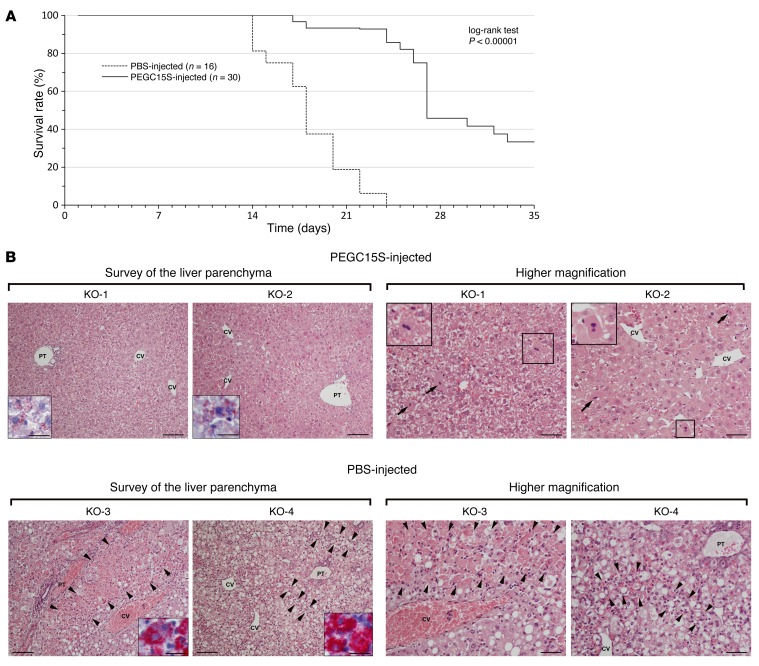
Homocystinuria, which typically results from cystathionine β-synthase (CBS) deficiency, is the most common defect of sulfur amino acid metabolism. CBS condenses homocysteine and serine to cystathionine that is then converted to cysteine. Individuals with homocystinuria have markedly elevated plasma levels of homocysteine and methionine and reduced concentrations of cystathionine and cysteine. Clinical disease manifestations include thromboembolism and neuropsychiatric, ocular, and skeletal complications. Here, we have shown that administration of PEGylated CBS into the circulation of homocystinuria model mice alters the extra- and intracellular equilibrium of sulfur amino acids, resulting in a decrease of approximately 75% in plasma total homocysteine (tHcy) and normalization of cysteine concentrations. Moreover, the decrease in homocysteine and the normalization of cysteine in PEGylated CBS-treated model mice were accompanied by improvement of histopathological liver symptoms and increased survival. Together, these data suggest that CBS enzyme replacement therapy (ERT) is a promising approach for the treatment of homocystinuria and that ERT for metabolic diseases may not necessitate introduction of the deficient enzyme into its natural intracellular compartment.


Figures

Figure 1
Figure 1. Enzyme retention time in vivo is enhanced following htCBS PEGylation.
(A) CBS activity in plasma taken from C57BL/6J mice that were injected with 5 mg/kg BW of htCBS via the i.p., i.v., or s.c. route. Two experimental arms (n = 5 each) were used for each injection route (due to an IACUC restriction on blood volume collected and time between different bleedings of the same mouse; the 1-hour time point was chosen as a shared point between all groups for comparison). Blood was collected after injection from the mice in group 1 at 0, 1, 8, and 24 hours and from the mice in group 2 at 1, 4, 10, and 48 hours. (B) The htCBS enzyme was incubated in WT or HO plasma at 37°C (160 ng/μl), and activity was measured at the indicated time points. (C) Coomassie-stained SDS-PAGE of the PEGylated and non-PEGylated htCBS with the corresponding specific activity values. (D) Mice (n = 4–5) were injected s.c., as described in A, with ME020MA- or GL4-400MA-PEGylated htCBS as compared with the non-PEGylated htCBS. (E) Plasma samples from mice injected s.c. with non-PEGylated htCBS or GL4-400MA PEGylated htCBS were analyzed by Western blotting using an anti-hCBS Ab. Data in A and D are presented as the mean ± SEM and were compared using ANOVA, followed by Tukey’s post-hoc test. *P ≤ 0.05, **P ≤ 0.01, and ***P ≤ 0.001. PEG, PEGylated; No PEG, non-PEGylated.
Figure 2
Figure 2. Repeated injection of the PEGylated, but not the non-PEGylated, htCBS shows buildup of CBS activity in vivo.
C57BL/6J mice were injected at 0, 24, 48 hours (indicated by arrows) with 5 mg/kg BW of the non-PEGylated htCBS (n = 5) or with GL4-400MA PEGylated htCBS (n = 5) and were bled at the indicated time points. Data are presented as the mean ± SEM and were compared using an unpaired Student’s t test. **P ≤ 0.01 and ***P ≤ 0.001.
Figure 3
Figure 3. Repeated injection of PEGhtCBS significantly impacts tHcy, cystathionine, and cysteine plasma levels.
(A) Metabolites levels in HO mice (n = 6) throughout a 24-hour cycle. (B) tHcy levels in individual HO mice (n = 6) that were injected with 5 mg/kg PEGhtCBS for 5 consecutive days on weeks 1 and 3. (C) Mean tHcy and cystathionine levels of the animals described in B. See Figure 4 for typical levels of metabolites in untreated HO mice. (D) Mean tHcy and cystathionine levels in HO mice (n = 5) that were injected with 5 mg/kg non-PEGylated htCBS for 5 consecutive days on weeks 1 and 3. (E) Comparison of cysteine levels in the animals injected with PEGylated versus non-PEGylated htCBS. Data in A, C, and D are presented as the mean ± SEM and are compared with time 0 values, using a paired Student’s t test. Data in E are presented as the mean ± SEM, and each time point is compared between the 2 groups using an unpaired Student’s t test. *P ≤ 0.05, **P ≤ 0.01, and ***P ≤ 0.001. Arrows in panels BE represent injection times.
Figure 4
Figure 4. Long-term repeated injections of PEGhtCBS significantly impacts tHcy, cystathionine, and cysteine plasma levels.
(AC) tHcy, cystathionine, and cysteine plasma levels in HO mice that were injected with 7.5 mg/kg BW of PEGhtCBS (n = 8) or PBS (n = 4) twice per week (Monday and Thursday) for the first 2 weeks and 3 times per week (Monday, Wednesday, and Friday) for an additional 6 weeks. Values indicate plasma levels 24 hours (Tuesdays) and 72 hours (Mondays) after injection. (D) Levels of nonprotein-bound homocysteine (Hcy) in liver, kidney, and brain tissues harvested from the long-term–injected animals. Data are presented as the mean ± SEM, and each time point is compared between the 2 groups using an unpaired Student’s t test. *P ≤ 0.05, **P ≤ 0.01, and ***P ≤ 0.001.
Figure 5
Figure 5. HtCBS C15S mutant prevents protein aggregation, forms mainly dimers, and exhibits a reproducible PEGylation pattern.
(A) Coomassie-stained native PAGE of different htCBS batches. (B) In-gel activity assay for htCBS. (C) Coomassie-stained SDS-PAGE showing a different PEGylation pattern for 2 independent batches of htCBS. (D) Coomassie-stained native PAGE of 2 different htCBS batches, with or without TCEP. (E) Coomassie-stained SDS-PAGE showing the effect of TCEP on PEGylation. (F) Coomassie-stained native-PAGE showing the difference between htCBS C15S and the htCBS dimer/tetramer ratio. (G) Coomassie-stained SDS-PAGE showing the reproducibility of htCBS C15S PEGylation between different batches and comparison with htCBS. (H) SEC-HPLC showing a predominantly tetrameric htCBS and an exclusively dimeric htCBS C15S mutant. M, molecular weight marker.
Figure 6
Figure 6. CBS and betaine operate synergistically to reduce and maintain low tHcy levels.
(A and B) One group of HO mice was maintained on 2% betaine water for 18 days (Betaine, n = 5); the second group (Betaine + PEGC15S, n = 5) received the same treatment, but they received 2 injections of 7.5 mg/kg PEGC15S on days 14 and 15. The third group of mice (PEGC15S, n = 5) was maintained on normal water and received 2 injections of 7.5 mg/kg htCBS C15S on days 14 and 15. tHcy and cystathionine levels in these groups were determined on day 0 and on days 14–18. Data are presented as the mean ± SEM and were analyzed using ANOVA, followed by Tukey’s post-hoc test. *P ≤ 0.05, **P ≤ 0.01, and ***P ≤ 0.001.
Figure 7
Figure 7. PEGC15S administration rescues complete CBS-KO mice from early lethality.
(A) Kaplan-Meier survival curve of KO mice that were injected twice weekly with PEGC15S (n = 30) versus mice injected with PBS (n = 16). Mice were maintained on betaine water until day 21. A log-rank test was used for comparison of the 2 survival curves, and significance was calculated using the χ2 test. (B) Liver histology results for 2 PEGC15S-injected KO mice that were sacrificed on day 35 versus liver histology results for 2 PBS-injected KO animals that died on days 17 and 24 (H&E staining). Low-magnification views of the liver parenchyma (left panels) show moderate changes, with slightly irregular liver cell plates and mild-to-moderate steatosis, in PEGC15S-injected KO-1 and KO-2 mice, contrasting with massive zonal necroses of hepatocytes (KO-3 mouse, marked by arrowheads) and diffuse steatosis, with multiple dispersed hepatocellular necroses (KO-4 mouse, necroses marked by arrowheads) in the PBS-injected KO mice. A specific stain for apolar lipids in the cytoplasm of hepatocytes is shown in the insets. Higher-magnification views (right panels) demonstrate the presence of frequent mitoses (marked by arrows and shown in detail in the insets) and enlarged pleiomorphic nuclei, with prominent nucleoli in hepatocytes, in the PEGC15S-injected KO mice. Higher-magnification views of the liver parenchyma in PBS-injected KO mice demonstrate confluent hepatocellular necroses, with a sparse inflammatory infiltration (KO-3 mouse, marked by arrowheads) or multiple dispersed necroses, accompanied by a prominent resorptive inflammatory reaction (KO-4 mouse, marked by arrowheads). The remaining liver parenchyma show micro- and macrovesicular steatosis in PBS-injected KO mice. CV, central vein; PT, portal tract. Scale bars: 200 μm (low-magnification images); 100 μm (high-magnification images); and 50 μm (insets).

Comment in

References

    1. Carson NA, Neill DW. Metabolic abnormalities detected in a survey of mentally backward individuals in Northern Ireland. Arch Dis Child. 1962;37:505–513. doi: 10.1136/adc.37.195.505. - DOI - PMC - PubMed
    1. Mudd SH, Finkelstein JD, Irreverre F, Laster L. Homocystinuria: an enzymatic defect. Science. 1964;143(3613):1443–1445. doi: 10.1126/science.143.3613.1443. - DOI - PubMed
    1. Miles EW, Kraus JP. Cystathionine β-synthase: structure, function, regulation, and location of homocystinuria-causing mutations. J Biol Chem. 2004;279(29):29871–29874. doi: 10.1074/jbc.R400005200. - DOI - PubMed
    1. Mudd SH, Levy HL, Kraus JP. Disorders of transsulfuration. In: Scriver CR, et al., eds. The Metabolic and Molecular Bases of Inherited Disease. New York, New York, USA: McGraw-Hill; 2001:2007–2056.
    1. Kraus JP, Kožich V. Cystathionine-β-synthase and its deficiency. In: Carmel R, Jacobsen DW, editors. Homocysteine in Health and Disease. Cambridge, United Kingdom: Cambridge University Press; 2001. pp. 223–243. , eds.