

Heightened Immune Activation in Fetuses with Gastroschisis May Be Blocked by Targeting IL-5
- PMID: 27183609
- PMCID: PMC4977025
- DOI: 10.4049/jimmunol.1502587
Heightened Immune Activation in Fetuses with Gastroschisis May Be Blocked by Targeting IL-5
Abstract
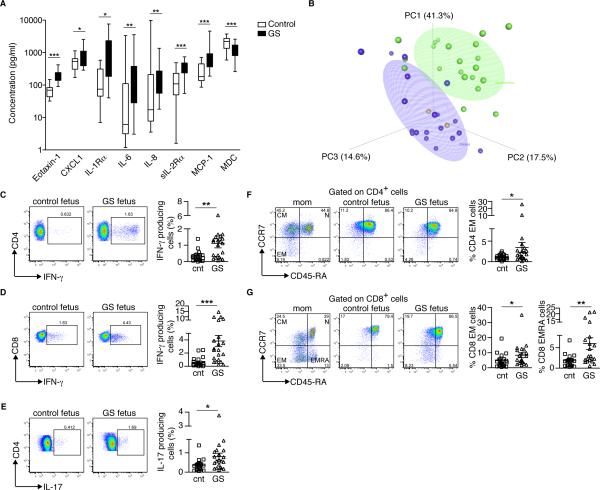
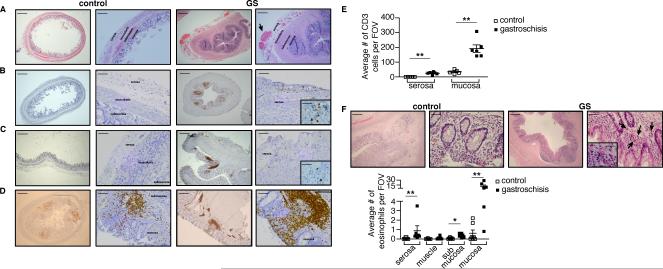
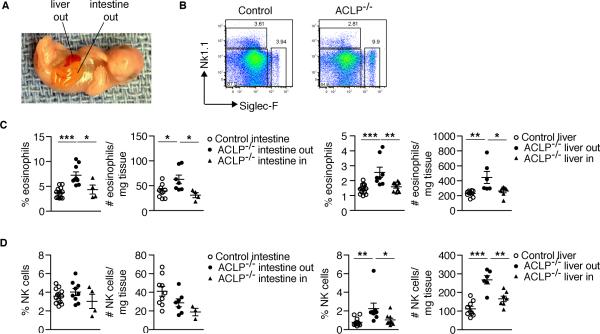
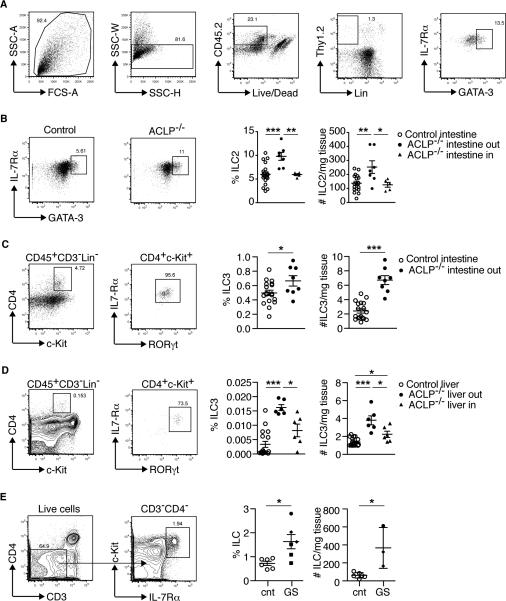
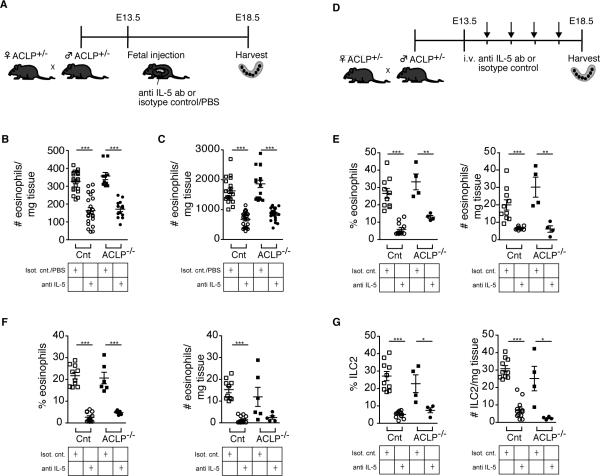
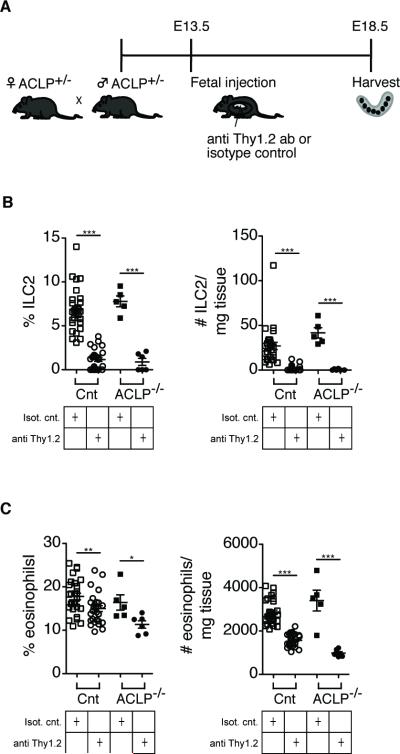
The development of the fetal immune system during pregnancy is a well-orchestrated process with important consequences for fetal and neonatal health, but prenatal factors that affect immune activation are poorly understood. We hypothesized that chronic fetal inflammation may lead to alterations in development of the fetal immune system. To test this hypothesis, we examined neonates with gastroschisis, a congenital abdominal wall defect that leads to exposure of the fetal intestines to amniotic fluid, with resultant intestinal inflammation. We determined that patients with gastroschisis show high systemic levels of inflammatory cytokines and chemokines such as eotaxin, as well as earlier activation of CD4(+) and CD8(+) effector and memory T cells in the cord blood compared with controls. Additionally, increased numbers of T cells and eosinophils infiltrate the serosa and mucosa of the inflamed intestines. Using a mouse model of gastroschisis, we observed higher numbers of eosinophils and both type 2 and type 3 innate lymphoid cells (ILC2 and ILC3), specifically in the portion of organs exposed to the amniotic fluid. Given the role of IL-5 produced by ILC2 in regulating eosinophil development and survival, we determined that maternal or fetal administration of the anti-IL-5 neutralizing Ab, or a depleting Ab against ILCs, can both effectively reduce intestinal eosinophilia. Thus, a congenital anomaly causing chronic inflammation can alter the composition of circulating and tissue-resident fetal immune cells. Given the high rate of prenatal and neonatal complications in these patients, such changes have clinical significance and might become targets for fetal therapy.
Copyright © 2016 by The American Association of Immunologists, Inc.
Figures
Similar articles
-
CD161 contributes to prenatal immune suppression of IFNγ-producing PLZF+ T cells.J Clin Invest. 2019 May 30;129(9):3562-3577. doi: 10.1172/JCI125957. J Clin Invest. 2019. PMID: 31145102 Free PMC article.
-
Changes in intestinal waste products during the antenatal management of gastroschisis by serial amniotic fluid exchange and infusion.Fetal Diagn Ther. 2008;24(4):448-51. doi: 10.1159/000176298. Epub 2008 Nov 26. Fetal Diagn Ther. 2008. PMID: 19033725
-
Influence of amnioinfusion in a model of in utero created gastroschisis in the pregnant ewe.Fetal Diagn Ther. 2000 Jul-Aug;15(4):224-8. doi: 10.1159/000021011. Fetal Diagn Ther. 2000. PMID: 10867484
-
Prenatal management of gastroschisis: the place of the amnioexchange procedure.Clin Perinatol. 2003 Sep;30(3):551-72, viii. doi: 10.1016/s0095-5108(03)00056-3. Clin Perinatol. 2003. PMID: 14533896 Review.
-
Transamniotic stem cell therapy: a novel strategy for the prenatal management of congenital anomalies.Pediatr Res. 2018 Jan;83(1-2):241-248. doi: 10.1038/pr.2017.228. Epub 2017 Oct 11. Pediatr Res. 2018. PMID: 28915235 Review.
Cited by
-
Hypoxic renal injury in newborns with abdominal compartment syndrome (clinical and experimental study).Pediatr Res. 2018 Feb;83(2):520-526. doi: 10.1038/pr.2017.263. Epub 2017 Nov 15. Pediatr Res. 2018. PMID: 29053704
-
CD161 contributes to prenatal immune suppression of IFNγ-producing PLZF+ T cells.J Clin Invest. 2019 May 30;129(9):3562-3577. doi: 10.1172/JCI125957. J Clin Invest. 2019. PMID: 31145102 Free PMC article.
-
The immunophenotype of amniotic fluid leukocytes in normal and complicated pregnancies.Am J Reprod Immunol. 2018 Apr;79(4):e12827. doi: 10.1111/aji.12827. Epub 2018 Mar 3. Am J Reprod Immunol. 2018. PMID: 29500850 Free PMC article.
-
Fetal T Cell Activation in the Amniotic Cavity during Preterm Labor: A Potential Mechanism for a Subset of Idiopathic Preterm Birth.J Immunol. 2019 Oct 1;203(7):1793-1807. doi: 10.4049/jimmunol.1900621. Epub 2019 Sep 6. J Immunol. 2019. PMID: 31492740 Free PMC article. Clinical Trial.
-
ILC3: a case of conflicted identity.Front Immunol. 2023 Oct 17;14:1271699. doi: 10.3389/fimmu.2023.1271699. eCollection 2023. Front Immunol. 2023. PMID: 37915588 Free PMC article. Review.
References
-
- van de Pavert SA, Ferreira M, Domingues RG, Ribeiro H, Molenaar R, Moreira-Santos L, Almeida FF, Ibiza S, Barbosa I, Goverse G, Labão-Almeida C, Godinho-Silva C, Konijn T, Schooneman D, O'Toole T, Mizee MR, Habani Y, Haak E, Santori FR, Littman DR, Schulte-Merker S, Dzierzak E, Simas JP, Mebius RE, Veiga-Fernandes H. Maternal retinoids control type 3 innate lymphoid cells and set the offspring immunity. Nature. 2014;508:123–127. - PMC - PubMed
-
- Bunders MJ, van der Loos CM, Klarenbeek PL, van Hamme JL, Boer K, Wilde JCH, de Vries N, van Lier RAW, Kootstra N, Pals ST, Kuijpers TW. Memory CD4+CCR5+ T cells are abundantly present in the gut of newborn infants to facilitate mother-to-child transmission of HIV-1. Blood. 2012;120:4383–4390. - PubMed
-
- Gibbons D, Fleming P, Virasami A, Michel M-L, Sebire NJ, Costeloe K, Carr R, Klein N, Hayday A. Interleukin-8 (CXCL8) production is a signatory T cell effector function of human newborn infants. Nat Med. 2014;20:1206–1210. - PubMed
-
- Christison-Lagay ER, Kelleher CM, Langer JC. Neonatal abdominal wall defects. Semin Fetal Neonatal Med. 2011;16:164–172. - PubMed
-
- Guibourdenche J, Berrebi D, Vuillard E, de Lagausie P, Aigrain Y, Oury J-F, Luton D. Biochemical investigations of bowel inflammation in gastroschisis. Pediatr Res. 2006;60:565–568. - PubMed
Publication types
MeSH terms
Substances
Grants and funding
LinkOut - more resources
Full Text Sources
Other Literature Sources
Medical
Research Materials
