. 2016 May 16:14:76.
doi: 10.1186/s12916-016-0617-3.

Human newborn bacille Calmette-Guérin vaccination and risk of tuberculosis disease: a case-control study

Collaborators, Affiliations

Human newborn bacille Calmette-Guérin vaccination and risk of tuberculosis disease: a case-control study

Helen A Fletcher et al. BMC Med. .

Abstract

Background: An incomplete understanding of the immunological mechanisms underlying protection against tuberculosis (TB) hampers the development of new vaccines against TB. We aimed to define host correlates of prospective risk of TB disease following bacille Calmette-Guérin (BCG) vaccination.

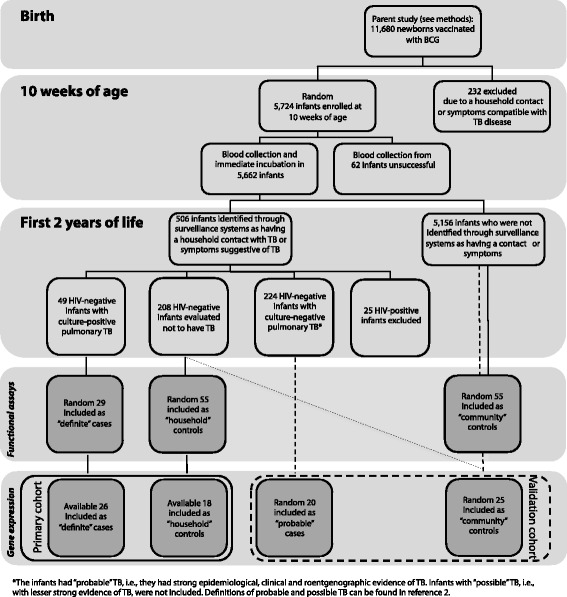
Methods: In this study, 5,726 infants vaccinated with BCG at birth were enrolled. Host responses in blood collected at 10 weeks of age were compared between infants who developed pulmonary TB disease during 2 years of follow-up (cases) and those who remained healthy (controls).

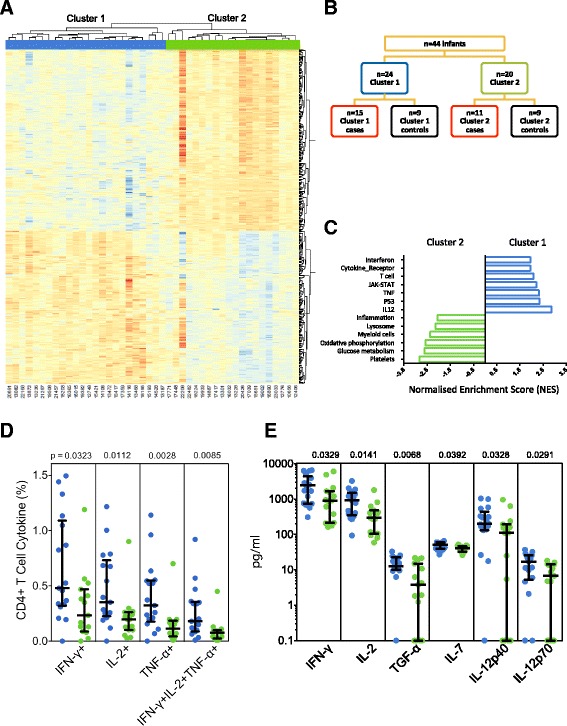
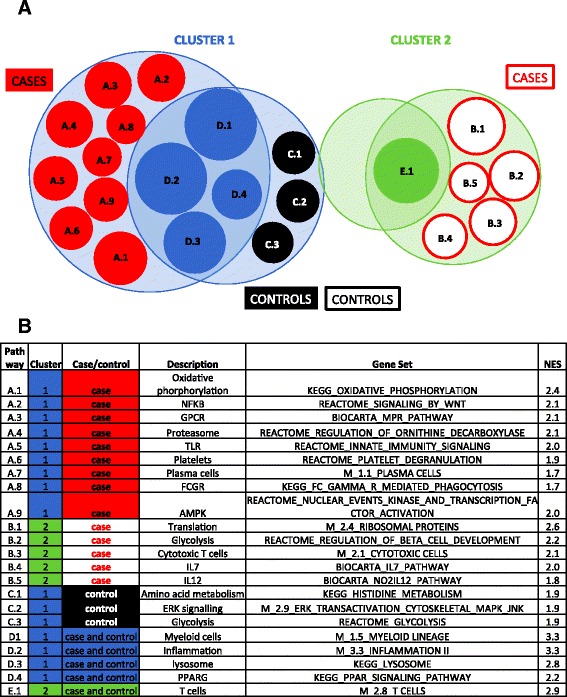
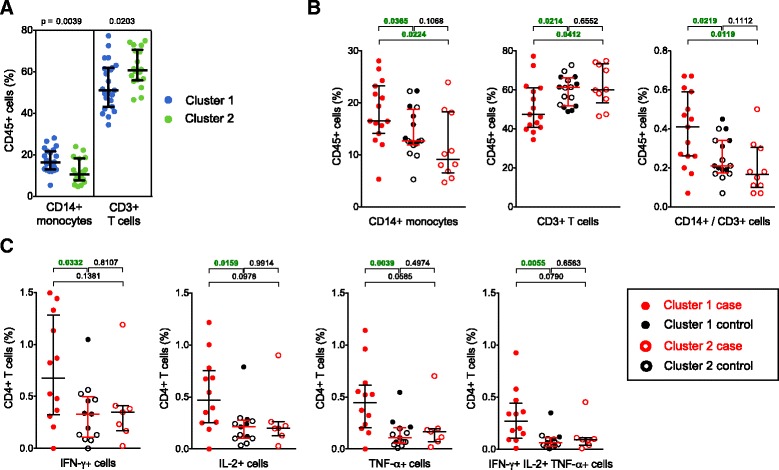
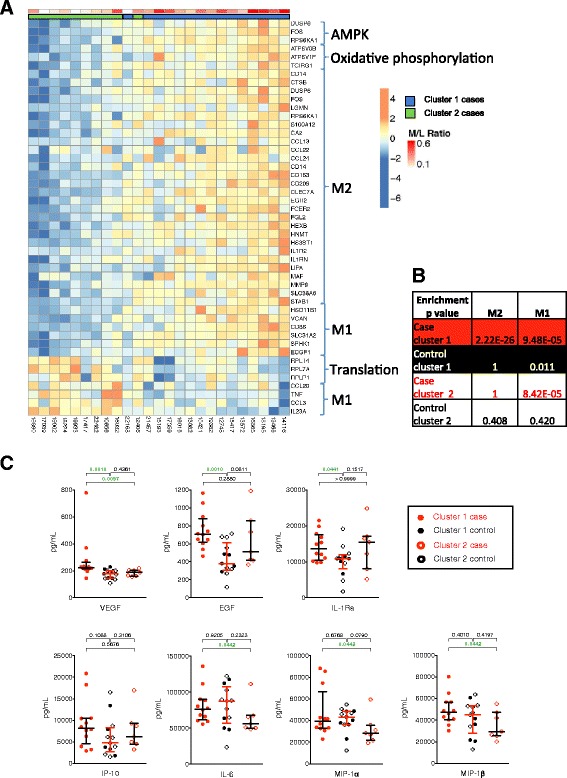
Results: Comprehensive gene expression and cellular and soluble marker analysis failed to identify a correlate of risk. We showed that distinct host responses after BCG vaccination may be the reason: two major clusters of gene expression, with different myeloid and lymphoid activation and inflammatory patterns, were evident when all infants were examined together. Cases from each cluster demonstrated distinct patterns of gene expression, which were confirmed by cellular assays.

Conclusions: Distinct patterns of host responses to Mycobacterium bovis BCG suggest that novel TB vaccines may also elicit distinct patterns of host responses. This diversity should be considered in future TB vaccine development.

Keywords: Correlates of risk; Systems biology; Tuberculosis; Vaccine.


Figures

Fig. 1
Fig. 1
Cohort of infants vaccinated with BCG at birth. At 10 weeks of age, blood was collected from HIV-negative, HIV-unexposed infants with no active or chronic illnesses (including suspected TB), and with no household exposure to an adult who was coughing, or who had TB disease. Infants were then followed for 2 years. Community-wide surveillance systems identified all children exposed to adults with TB, or children with suspected TB disease. Among these children, “definite” TB cases were defined by presence of clinical signs and symptoms of lung disease plus a sputum (induced, or early morning gastric aspirate) culture positive for M. tuberculosis, while “probable” TB cases were defined by absence of a positive culture in the presence of strong epidemiological, clinical and chest roentgenographic evidence of TB disease. Two groups of controls were identified: “household” controls were exposed to an adult in the household with TB but were found not to have TB, whereas “community” controls were infants who were either investigated for TB and found not to have disease, or infants chosen at random from the rest of the cohort. For functional assays, up to 29 definite cases and 110 controls (household controls, n = 55, and community controls, n = 55) were included in different analyses. Primary analysis of transcriptional profiling was restricted to those cases and controls included in functional assay analysis for whom PBMC were available
Fig. 2
Fig. 2
Identification of two clusters of gene expression in infants. Samples from the primary cohort of definite cases and household contacts were examined together. a Unsupervised clustering analysis was performed as described in “Methods”, resulting in two major clusters of infants. The heatmap shows results of supervised hierarchical clustering analysis (Pearson correlation), using genes differentially expressed between infants belonging to the two clusters (Additional file 1: Figures S1 and S2); the normalized probe intensity obtained from PBMC stimulated with media only was subtracted from the normalized probe intensity obtained from PBMC stimulated with BCG for 12 h. b Representation of cases and controls among the two clusters. c Gene expression within biological pathways, identified by GSEA, that differed between cluster 1 (blue) and cluster 2 (green). Representative GSEA pathways were ranked by FDR q value (and p value < 0.05). d Frequencies of BCG-specific CD4+ T cells among infants from cluster 1 (blue circles) or cluster 2 (green circles). Antigen-specific cells were identified by cytokine expression following incubation of whole blood with BCG for 12 h. Bars depict medians and IQR; the Mann–Whitney U test was used to assess differences. e Quantification of molecules released in whole blood after a 7-h incubation with BCG. BCG-specific levels were calculated by subtracting levels in plasma from whole blood incubated with costimulatory antibodies alone from those in BCG-stimulated blood. Bars depict medians and IQR; the Mann–Whitney U test was used to assess differences
Fig. 3
Fig. 3
Pathway analysis, using gene expression data from unstimulated PBMC, in the two clusters of infants. Samples from the primary cohort were analyzed. A one group versus all other groups analysis approach was used to identify genes differentially expressed in each of the four groups, when compared to a pool of the three other groups (Additional file 4: Table S3). Then, genes were ranked according to the moderated t test and GSEA used to identify pathways enriched in each of the four groups. Finally, pathways uniquely and commonly expressed within each group were identified, using a FDR adjusted p value cutoff of < 0.05. The Venn diagram (a) shows both shared and unique gene sets, which are identified in (b). Gene sets are sized by normalized enrichment score (NES)
Fig. 4
Fig. 4
Cellular phenotype and function in case and control infants from cluster 1 and cluster 2. Samples from the primary cohort were analyzed. a Frequencies of monocytes and T cells, measured by flow cytometry (Additional file 1: Figure S6) in unstimulated PBMC from infants in cluster 1 (blue circles, n = 23) and cluster 2 (green circles, n = 18). b Comparison of the cellular phenotype of definite TB case infants from cluster 1 (red closed circles, n = 15) and from cluster 2 (red open circles, n = 10) with that of pooled household controls (black closed circles for cluster 1, n = 8, and black open circles for cluster 2, n = 8). CD14+ monocytes, CD3+ T cells and the ratio of monocytes divided by lymphocytes are shown. c Frequencies of CD4+ T cells expressing either IFN-γ, IL-2 or TNF-α, or all three cytokines together, measured by intracellular cytokine staining and flow cytometry, following whole blood stimulation with BCG for 12 h. For this analysis, definite TB case infants from cluster 1 (red closed circles, n = 12) and from cluster 2 (red open circles, n = 7) were compared to pooled household controls (black closed circles for cluster 1, n = 5, and black open circles for cluster 2, n = 8). Bars depict medians and IQR; the Mann–Whitney U test was used to assess differences in all analyses
Fig. 5
Fig. 5
Evidence of differential M1 and M2 monocyte activation in cases and controls from different clusters. Samples from the primary cohort were analyzed. a Heatmap showing genes associated with AMPK, oxidative phosphorylation, translation, M1 monocytes and M2 monocytes, which were differentially expressed between cluster 1 cases and the three other groups, or cluster 2 cases and the three other groups. Cases from clusters 1 and 2 are shown. To build the heatmap, the infants were first ranked by increasing expression intensity for each gene. Then, the mean-rank, across the set of genes, for each infant was used to order infants from the lowest to the highest mean-rank. A Spearman correlation was used to assess the significance (p value < 0.0008) of the association between the ordering of the infants and the monocyte to T cell ratio. b The p value table from an over-representation test performed using Fisher’s exact test to identify M1 (right column) and M2 (left column) gene signature enrichment amongst up-regulated in each of the four groups of infants. (c) Concentrations of pro- and anti-inflammatory molecules were measured by Luminex in plasma from whole blood stimulated with BCG for 7 h. Bars depict medians and IQR; the Mann–Whitney test was used to assess differences in all analyses

Similar articles

Cited by

References

    1. Mangtani P, Abubakar I, Ariti C, Beynon R, Pimpin L, Fine PE, et al. Protection by BCG vaccine against tuberculosis: a systematic review of randomized controlled trials. Clin Infect Dis. 2014;58(4):470–80. doi: 10.1093/cid/cit790. - DOI - PubMed
    1. Hawkridge A, Hatherill M, Little F, Goetz MA, Barker L, Mahomed H, et al. Efficacy of percutaneous versus intradermal BCG in the prevention of tuberculosis in South African infants: randomised trial. BMJ. 2008;337:a2052. doi: 10.1136/bmj.a2052. - DOI - PMC - PubMed
    1. Kagina BM, Abel B, Scriba TJ, Hughes EJ, Keyser A, Soares A, et al. Specific T cell frequency and cytokine expression profile do not correlate with protection against tuberculosis after bacillus Calmette-Guerin vaccination of newborns. Am J Respir Crit Care Med. 2010;182(8):1073–9. doi: 10.1164/rccm.201003-0334OC. - DOI - PMC - PubMed
    1. Fletcher HA, Keyser A, Bowmaker M, Sayles PC, Kaplan G, Hussey G, et al. Transcriptional profiling of mycobacterial antigen-induced responses in infants vaccinated with BCG at birth. BMC Med Genomics. 2009;2:10. doi: 10.1186/1755-8794-2-10. - DOI - PMC - PubMed
    1. Reddy TB, Riley R, Wymore F, Montgomery P, DeCaprio D, Engels R, et al. TB database: an integrated platform for tuberculosis research. Nucleic Acids Res. 2009;37(Database issue):D499–508. doi: 10.1093/nar/gkn652. - DOI - PMC - PubMed

Publication types

MeSH terms