Effect of the particle-hole channel on BCS-Bose-Einstein condensation crossover in atomic Fermi gases
- PMID: 27183875
- PMCID: PMC4868972
- DOI: 10.1038/srep25772
Effect of the particle-hole channel on BCS-Bose-Einstein condensation crossover in atomic Fermi gases
Abstract
BCS-Bose-Einstein condensation (BEC) crossover is effected by increasing pairing strength between fermions from weak to strong in the particle-particle channel, and has attracted a lot of attention since the experimental realization of quantum degenerate atomic Fermi gases. Here we study the effect of the (often dropped) particle-hole channel on the zero T gap Δ(0), superfluid transition temperature Tc, the pseudogap at Tc, and the mean-field ratio 2Δ(0)/, from BCS through BEC regimes, using a pairing fluctuation theory which includes self-consistently the contributions of finite-momentum pairs and features a pseudogap in single particle excitation spectrum. Summing over the infinite particle-hole ladder diagrams, we find a complex dynamical structure for the particle-hole susceptibility χph, and conclude that neglecting the self-energy feedback causes a serious over-estimate of χph. While our result in the BCS limit agrees with Gor'kov et al., the particle-hole channel effect becomes more complex and pronounced in the crossover regime, where χph is reduced by both a smaller Fermi surface and a big (pseudo)gap. Deep in the BEC regime, the particle-hole channel contributions drop to zero. We predict a density dependence of the magnetic field at the Feshbach resonance, which can be used to quantify χph and test different theories.
Figures


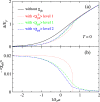
 shows a simple monotonic behavior, the dressed susceptibility
  has a nonmonotonic p dependence, and a substantially reduced value at p = 0. This reduction derives from the gap effect in the Green’s function G(K). Namely,
  seriously over-estimated particle-hole fluctuations.

 , which shows a serious over-estimate due to the neglect of the self-energy feedback. Here Tc = 0.256EF and associated gap and μ values are calculated without the particle-hole channel effect. The open circles on each curve denote level 1 average, i.e., k = kμ. The vertical axis readings of the horizontal short bars indicate the corresponding values of level 2 average. The thick section of each curve indicates the range of k used for level 2 averaging. Clearly, there are strong temperature and k dependencies in both 〈χph(0, p)〉 and
  . The (absolute) values of Level 2 average are substantially smaller than their level 1 counterpart.
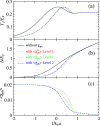
 with level 1 averaging (red dotted line), dressed particle-hole susceptibility 〈χph〉 with level 1 (green dot-dashed curve) and level 2 (blue dashed line) averaging, respectively. The corresponding values of the average particle-hole susceptibility with a minus sign are plotted in (b), in units of
  . The particle-hole channel effect can be essentially neglected beyond 1/kFa > 1.5.
 with level 1 averaging (red dotted line), dressed particle-hole susceptibility 〈χph〉 with level 1 (green dot-dashed curve) and level 2 (blue dashed line) averaging, respectively. The corresponding values of the average particle-hole susceptibility with a minus sign are plotted in (c), in units of
  . The particle-hole channel effect can be essentially neglected beyond 1/kFa > 1.5.

Similar articles
-
Excitation Spectrum and Superfluid Gap of an Ultracold Fermi Gas.Phys Rev Lett. 2022 Mar 11;128(10):100401. doi: 10.1103/PhysRevLett.128.100401. Phys Rev Lett. 2022. PMID: 35333076
-
Giant superconducting fluctuations in the compensated semimetal FeSe at the BCS-BEC crossover.Nat Commun. 2016 Sep 30;7:12843. doi: 10.1038/ncomms12843. Nat Commun. 2016. PMID: 27687782 Free PMC article.
-
Signatures of superfluidity for Feshbach-resonant Fermi gases.Phys Rev Lett. 2004 Jun 11;92(23):230403. doi: 10.1103/PhysRevLett.92.230403. Epub 2004 Jun 10. Phys Rev Lett. 2004. PMID: 15245145
-
Transition from an atomic to a molecular Bose-Einstein condensate.Nature. 2021 Apr;592(7856):708-711. doi: 10.1038/s41586-021-03443-0. Epub 2021 Apr 28. Nature. 2021. PMID: 33911270
-
A Molecular Perspective of Exciton Condensation from Particle-Hole Reduced Density Matrices.J Phys Chem Lett. 2025 Feb 6;16(5):1352-1366. doi: 10.1021/acs.jpclett.4c03198. Epub 2025 Jan 29. J Phys Chem Lett. 2025. PMID: 39878146 Review.
Cited by
-
Enhancement effect of mass imbalance on Fulde-Ferrell-Larkin-Ovchinnikov type of pairing in Fermi-Fermi mixtures of ultracold quantum gases.Sci Rep. 2017 Jan 4;7:39783. doi: 10.1038/srep39783. Sci Rep. 2017. PMID: 28051145 Free PMC article.
References
-
- Leggett A. J. Diatomic molecules and Cooper pairs. In Modern Trends in the Theory of Condensed Matter, 13–27 (Springer-Verlag, Berlin, 1980).
-
- Nozières P. & Schmitt-Rink S. Bose condensation in an attractive fermion gas: from weak to strong coupling superconductivity. J. Low Temp. Phys. 59, 195–211 (1985).
-
- Friedberg R. & Lee T. D. Boson-fermion model of superconductivity. Phys. Lett. A 138, 423–427 (1989). - PubMed
-
- Sá de Melo C. A. R., Randeria M. & Engelbrecht J. R. Crossover from BCS to Bose superconductivity: Transition temperature and time-dependent Ginzburg-Landau theory. Phys. Rev. Lett. 71, 3202–3205 (1993). - PubMed
-
- Randeria M. Crossover from BCS theory to Bose-Einstein condensation. In Griffin A., Snoke D. & Stringari S. (eds.) Bose Einstein Condensation, 355–92 (Cambridge Univ. Press, Cambridge, 1995).
Publication types
LinkOut - more resources
Full Text Sources
Other Literature Sources
Miscellaneous

