

Fine-mapping markers of lung cancer susceptibility in a sub-region of chromosome 19q13.3 among Chinese
- PMID: 27183913
- PMCID: PMC5308627
- DOI: 10.18632/oncotarget.9279
Fine-mapping markers of lung cancer susceptibility in a sub-region of chromosome 19q13.3 among Chinese
Abstract
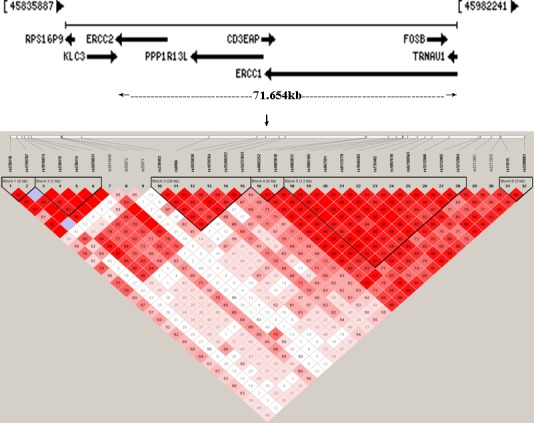
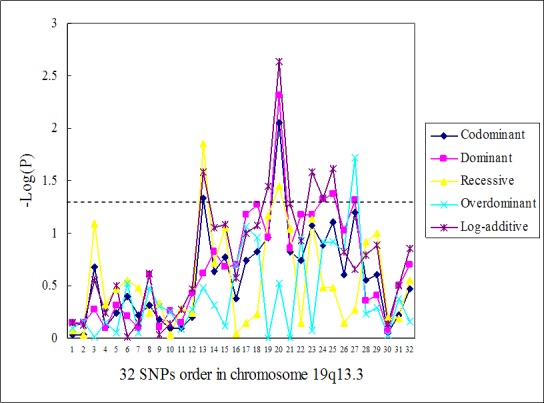
Linkage disequilibrium-mapping studies in Caucasians have indicated anassociation of Chr19q13.3 sub-region spanning ERCC2, PPP1R13L, CD3EAP and ERCC1 with several cancers. To refine the region of association and identify potential causal variations among Asians, we performed a fine-mapping study using 32 (39) SNPs in a 71.654kb sub-region. The study included 384 Chinese lung cancer cases and 387 controls. Seven closely situated SNPs showed significant associations with lung cancer risk in five different genetic models of single-locus associations (adjusted for smoking duration). These were PPP1R13L rs1970764 [OR (95% CI) = 1.58 (1.09-2.29), P = 0.014] in a recessive model and PPP1R13L rs1005165 [OR (95% CI) = 1.25 (1.01-1.54), P = 0.036], CD3EAP rs967591 [OR (95% CI) = 1.40 (1.13-1.75), P = 0.0023], rs735482 [OR (95% CI) = 1.29 (1.03-1.61), P = 0.026], rs1007616 [OR (95% CI) = 0.78 (0.61-1.00), P = 0.046], and rs62109563 [OR (95% CI) = 1.28 (1.03-1.59), P = 0.024] in a log-additive model and ERCC1 rs3212965 [OR (95% CI) = 0.70 (0.52-0.94), P = 0.019] in an over-dominant model. Six-haplotype blocks were determined in the sub-region. Using an alternative approach where we performed a haplotype analysis of all significant polymorphisms, rs1970764 was found to be most consistently associated with lung cancer risk. The combined data suggest that the sub-region with the strongest association to lung cancer susceptibility might locate to the 23.173kb from PPP1R13L intron8 rs1970764 to rs62109563 3' to CD3EAP. Limited risk loci and span on lung cancer in this sub-region are initially defined among Asians.
Keywords: Chinese; Chr19q13.3; ERCC2 and PPP1R13L and CD3EAP and ERCC1; fine-mapping; lung cancer.
Conflict of interest statement
The authors declare no conflict of interest.
Figures
Similar articles
-
A specific diplotype defined by PPP1R13L rs1970764, CD3EAP rs967591 and ERCC1 rs11615 and lung cancer risk in a Chinese population.Lung Cancer. 2012 Jun;76(3):286-91. doi: 10.1016/j.lungcan.2012.01.001. Epub 2012 Feb 14. Lung Cancer. 2012. PMID: 22335888
-
Effects of PPP1R13L and CD3EAP variants on lung cancer susceptibility among nonsmoking Chinese women.Gene. 2013 Jul 25;524(2):228-31. doi: 10.1016/j.gene.2013.04.017. Epub 2013 Apr 24. Gene. 2013. PMID: 23624123
-
Hapmap-based evaluation of ERCC2, PPP1R13L, and ERCC1 and lung cancer risk in a Chinese population.Environ Mol Mutagen. 2012 Apr;53(3):239-45. doi: 10.1002/em.21681. Epub 2012 Feb 20. Environ Mol Mutagen. 2012. PMID: 22351191
-
GLTSCR1, ATM, PPP1R13L and CD3EAP Genetic Variants and Lung Cancer Risk in a Chinese Population.Curr Med Sci. 2018 Aug;38(4):734-740. doi: 10.1007/s11596-018-1938-6. Epub 2018 Aug 20. Curr Med Sci. 2018. PMID: 30128886
-
Genetic polymorphisms in the nucleotide excision repair pathway and lung cancer risk: a meta-analysis.Int J Med Sci. 2007 Feb 1;4(2):59-71. doi: 10.7150/ijms.4.59. Int J Med Sci. 2007. PMID: 17299578 Free PMC article. Review.
Cited by
-
Common variants of pro-inflammatory gene IL1B and interactions with PPP1R13L and POLR1G in relation to lung cancer among Northeast Chinese.Sci Rep. 2023 May 5;13(1):7352. doi: 10.1038/s41598-023-34069-z. Sci Rep. 2023. PMID: 37147350 Free PMC article.
-
TP53 common variants and interaction with PPP1R13L and CD3EAP SNPs and lung cancer risk and smoking behavior in a Chinese population.Biomed J. 2022 Feb;45(1):169-178. doi: 10.1016/j.bj.2021.01.006. Epub 2021 Jan 29. Biomed J. 2022. PMID: 35351459 Free PMC article.
-
Methylation status of the PPP1R13L promoter region among lung cancer patients and healthy controls. Analytical cross-sectional study.Sao Paulo Med J. 2019 Aug 29;137(3):255-261. doi: 10.1590/1516-3180.2018.0358230419. Sao Paulo Med J. 2019. PMID: 31483011 Free PMC article.
-
Interaction between common variants of MDM2 and PPP1R13L and CD3EAP and TP53 SNPs in relation to lung cancer risk among Chinese.Ann Transl Med. 2020 Aug;8(15):934. doi: 10.21037/atm-19-4784. Ann Transl Med. 2020. PMID: 32953734 Free PMC article.
References
-
- Nexø BA, Vogel U, Olsen A, Nyegaard M, Bukowy Z, Rockenbauer E, Zhang X, Koca C, Mains M, Hansen B, Hedemand A, Kjeldgaard A, Laska MJ, Raaschou-Nielsen O, Cold S, Overvad K, Tjønneland A, Bolund L, Børglum AD. Linkage disequilibrium mapping of a breast cancer susceptibility locus near RAI/PPP1R13L/Iaspp. BMC Med Genet. 2008;9:56. - PMC - PubMed
-
- Ferlay J, Soerjomataram I, Dikshit R, Eser S, Mathers C, Rebelo M, Parkin DM, Forman D, Bray F. Cancer incidence and mortality worldwide: sources, methods and major patterns in GLOBOCAN 2012. Int J Cancer. 2015;136:E359–386. - PubMed
-
- Yin J, Rockenbauer E, Hedayati M, Jacobsen NR, Vogel U, Grossman L, Bolund L, Nexø BA. Multiple single nucleotide polymorphisms on human chromosome 19q13. 2-3 associate with risk of Basal cell carcinoma. Cancer Epidemiol Biomarkers Prev. 2002;11:1449–1453. - PubMed
-
- Rockenbauer E, Bendixen MH, Bukowy Z, Yin J, Jacobsen NR, Hedayati M, Vogel U, Grossman L, Bolund L, Nexø BA. Association of chromosome 19q13. 2-3 haplotypes with basal cell carcinoma: tentative delineation of an involved region using data for single nucleotide polymorphisms in two cohorts. Carcinogenesis. 2002;23:1149–1153. - PubMed
MeSH terms
Substances
LinkOut - more resources
Full Text Sources
Other Literature Sources
Medical
Research Materials
Miscellaneous
