

Single-cell antibody nanowells: a novel technology in detecting anti-SSA/Ro60- and anti-SSB/La autoantibody-producing cells in peripheral blood of rheumatic disease patients
- PMID: 27184054
- PMCID: PMC4869329
- DOI: 10.1186/s13075-016-1010-5
Single-cell antibody nanowells: a novel technology in detecting anti-SSA/Ro60- and anti-SSB/La autoantibody-producing cells in peripheral blood of rheumatic disease patients
Abstract
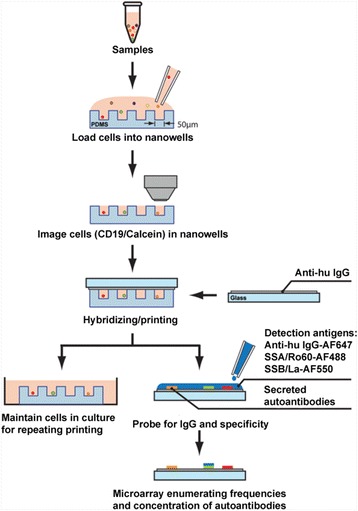
Background: Anti-SSA/Ro60 and anti-SSB/La are essential serological biomarkers for rheumatic diseases, specifically Sjögren's syndrome (SS) and systemic lupus erythematosus (SLE). Currently, laboratory detection technology and platforms are designed with an emphasis on high-throughput methodology; therefore, the relationship of sensitivity with specificity remains a significant area for improvement. In this study, we used single-cell antibody nanowells (SCAN) technology to directly profile individual B cells producing antibodies against specific autoantigens such as SSA/Ro60 and SSB/La.
Methods: Peripheral blood mononuclear cells were isolated using Ficoll gradient. Fluorescently labeled cells were added to fabricated nanowells and imaged using a high-speed epifluorescence microscope. The microengraving process was conducted using printed slides coated with immunoglobulins. Printed slides were hybridized with fluorescence-conjugated immunoglobulin G (IgG), SSA/Ro60, and SSB/La antigens. Microarray spots were analyzed for nanowells with single live B cells that produced antigen-specific autoantibodies.
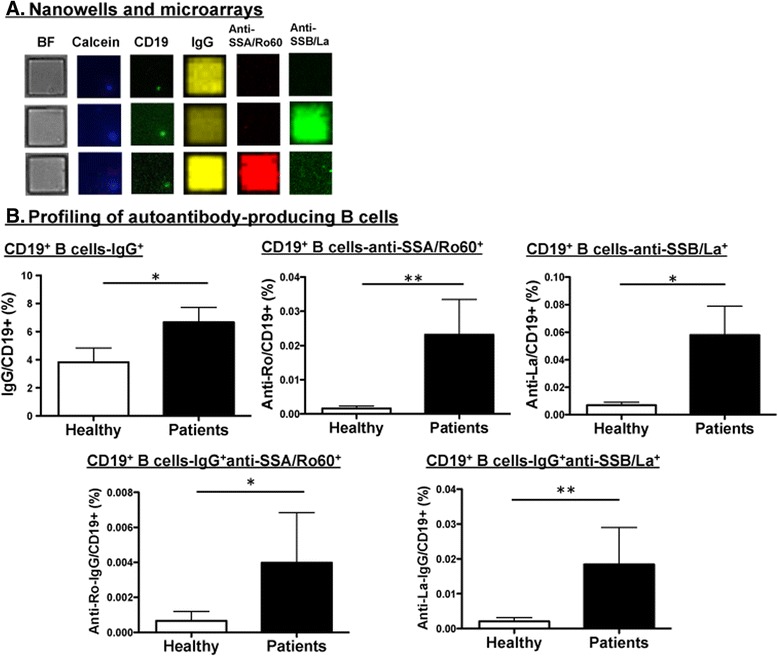
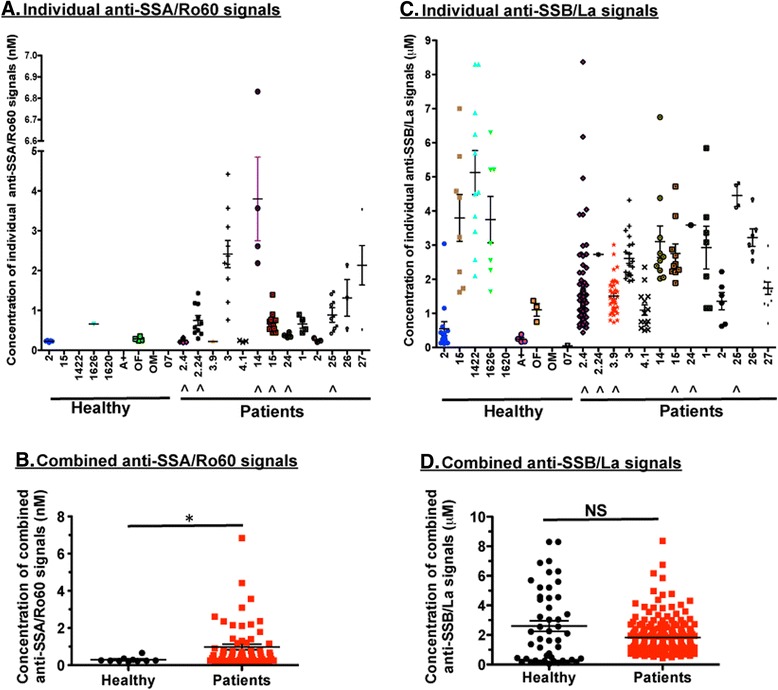
Results: Our results indicate that SCAN can simultaneously detect high frequencies of anti-SSA/Ro60 and anti-SSB/La with a specific IgG isotype in peripheral blood mononuclear cells of patients, as well as measure their individual secretion levels. The data showed that patients with SS and SLE exhibited higher frequency and greater concentration of anti-SSA/Ro60- and anti-SSB/La-producing B cells in the IgG isotype. Furthermore, individual B cells of patients produced higher levels of IgG-specific anti-SSA/Ro60 autoantibody, but not IgG-specific anti-SSB/La autoantibody, compared with healthy control subjects.
Conclusions: These results support the application of SCAN as a robust multiparametric analytical bioassay that can directly measure secretion of autoantibody and accurately report antigen-specific, autoantibody-producing cells.
Keywords: Anti-SSA/Ro60; Anti-SSB/La; Antinuclear autoantibody; Single-cell analysis; Sjögren’s syndrome; Systemic lupus erythematosus.
Figures
Similar articles
-
Association of anti-Ro52, anti-Ro60 and anti-La antibodies with diagnostic, clinical and laboratory features in a referral hospital in Jerez, Spain.Reumatol Clin. 2016 Sep-Oct;12(5):256-62. doi: 10.1016/j.reuma.2015.10.010. Epub 2015 Dec 25. Reumatol Clin. 2016. PMID: 26725021 English, Spanish.
-
Ro52, Ro60 and La IgG autoantibody levels and Ro52 IgG subclass profiles longitudinally throughout pregnancy in congenital heart block risk pregnancies.Lupus. 2006;15(6):346-53. doi: 10.1191/0961203306lu2309oa. Lupus. 2006. PMID: 16830880
-
Detection of anti-Ro/SSA and anti-La/SSB autoantibody-producing cells in salivary glands from patients with Sjögren's syndrome.Arthritis Rheum. 1998 Dec;41(12):2238-48. doi: 10.1002/1529-0131(199812)41:12<2238::AID-ART20>3.0.CO;2-V. Arthritis Rheum. 1998. PMID: 9870881
-
B cell apotopes of the 60-kDa Ro/SSA and La/SSB autoantigens.J Autoimmun. 2008 Nov;31(3):263-7. doi: 10.1016/j.jaut.2008.04.008. Epub 2008 Jun 3. J Autoimmun. 2008. PMID: 18511235 Review.
-
Neonatal lupus: bedside to bench and back.Scand J Rheumatol. 1996;25(5):271-6. doi: 10.3109/03009749609104057. Scand J Rheumatol. 1996. PMID: 8921918 Review.
Cited by
-
Antibodies, repertoires and microdevices in antibody discovery and characterization.Lab Chip. 2024 Feb 27;24(5):1207-1225. doi: 10.1039/d3lc00887h. Lab Chip. 2024. PMID: 38165819 Free PMC article. Review.
-
Leveraging blood and tissue CD4+ T cell heterogeneity at the single cell level to identify mechanisms of disease in rheumatoid arthritis.Curr Opin Immunol. 2017 Dec;49:27-36. doi: 10.1016/j.coi.2017.08.005. Epub 2017 Sep 6. Curr Opin Immunol. 2017. PMID: 28888129 Free PMC article. Review.
-
Unique glandular ex-vivo Th1 and Th17 receptor motifs in Sjögren's syndrome patients using single-cell analysis.Clin Immunol. 2018 Jul;192:58-67. doi: 10.1016/j.clim.2018.04.009. Epub 2018 Apr 19. Clin Immunol. 2018. PMID: 29679709 Free PMC article.
-
Fluorescent probes in autoimmune disease research: current status and future prospects.J Transl Med. 2025 Apr 9;23(1):411. doi: 10.1186/s12967-025-06430-5. J Transl Med. 2025. PMID: 40205498 Free PMC article. Review.
-
High-throughput strategies for monoclonal antibody screening: advances and challenges.J Biol Eng. 2025 May 8;19(1):41. doi: 10.1186/s13036-025-00513-z. J Biol Eng. 2025. PMID: 40340930 Free PMC article. Review.
References
MeSH terms
Substances
Grants and funding
LinkOut - more resources
Full Text Sources
Other Literature Sources
Research Materials
