. 2016 Aug;6(8):886-99.
doi: 10.1158/2159-8290.CD-15-0947. Epub 2016 May 16.

GM-CSF Mediates Mesenchymal-Epithelial Cross-talk in Pancreatic Cancer

Affiliations

GM-CSF Mediates Mesenchymal-Epithelial Cross-talk in Pancreatic Cancer

Meghna Waghray et al. Cancer Discov. 2016 Aug.

Abstract

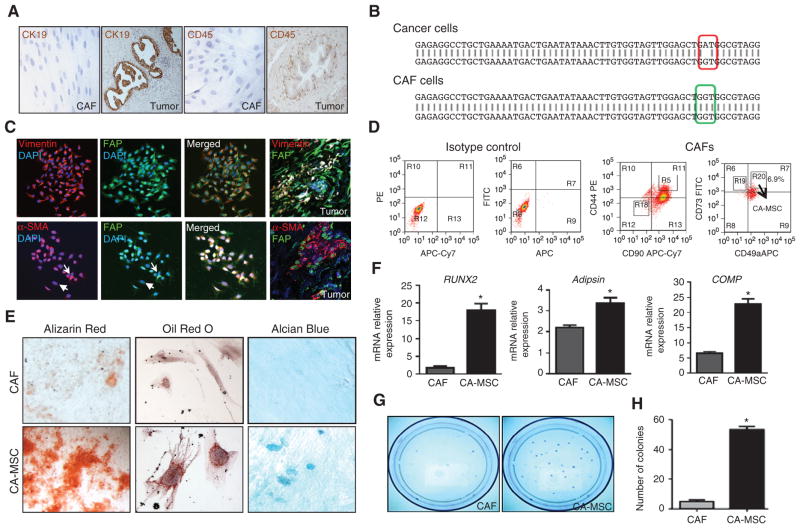
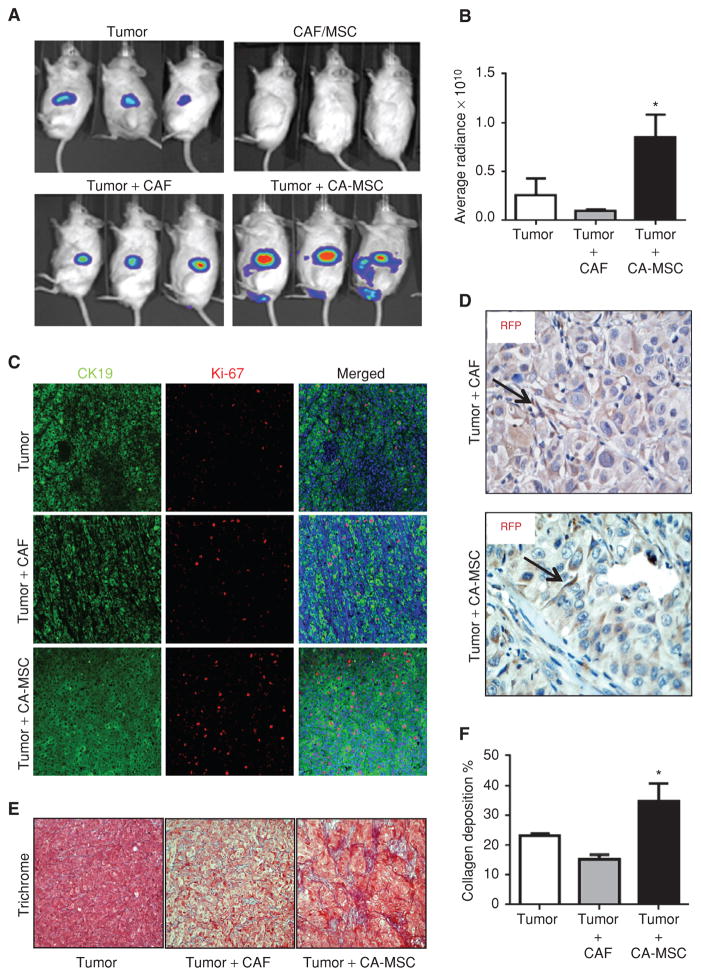
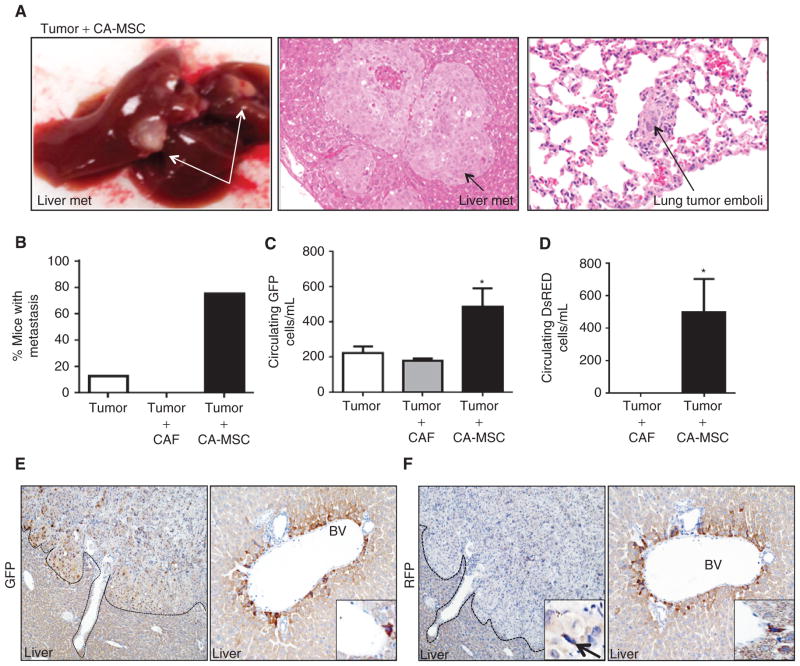
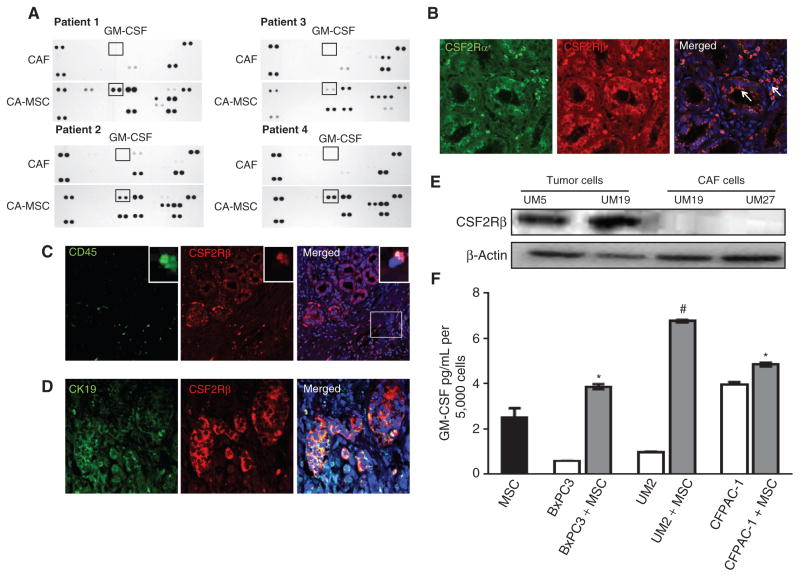
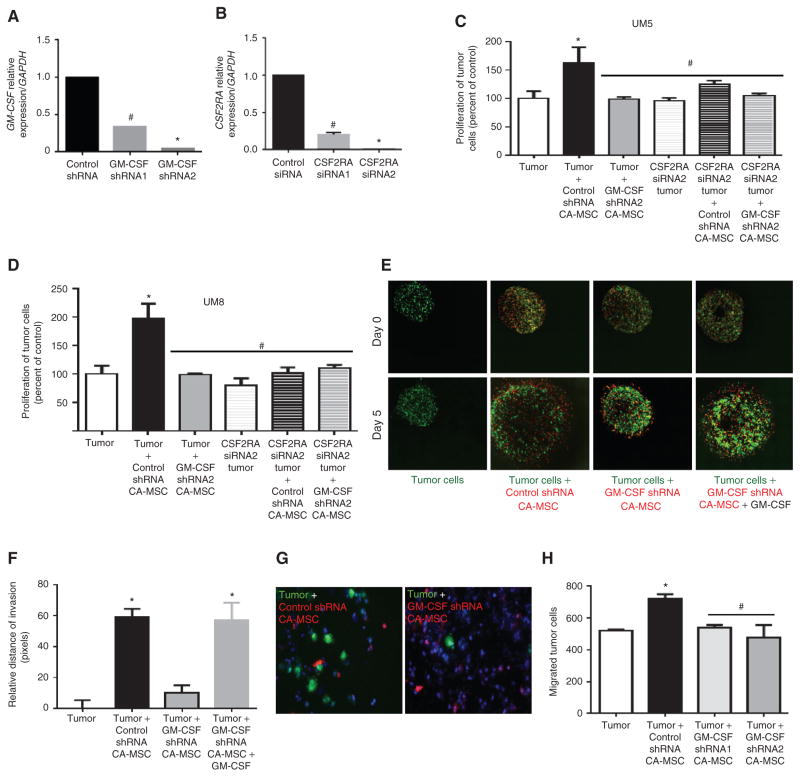
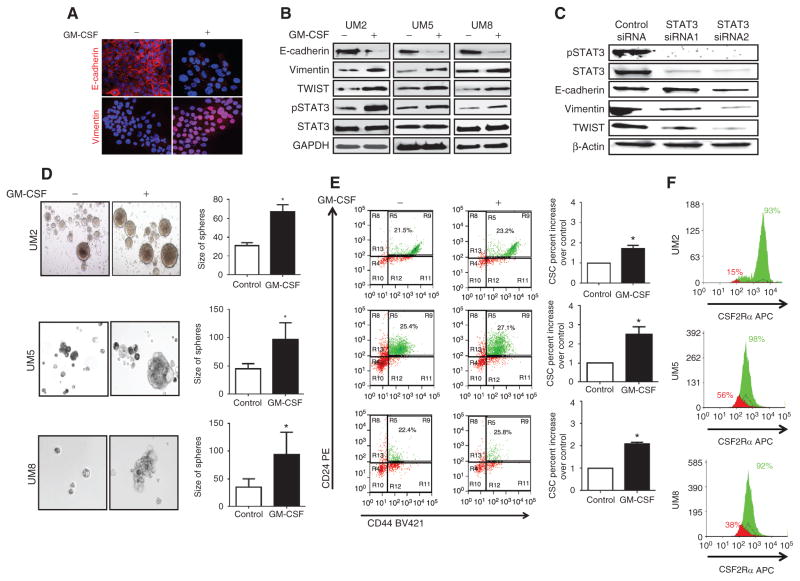
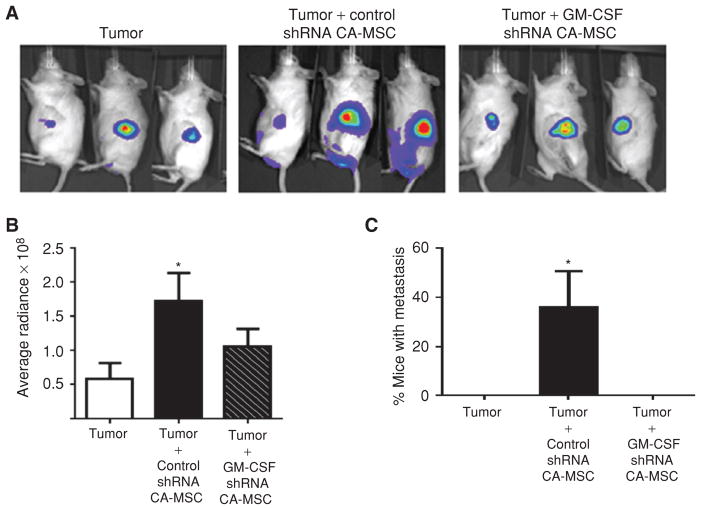
Pancreatic ductal adenocarcinoma (PDA) is characterized by a dense stroma consisting of a prevalence of activated fibroblasts whose functional contributions to pancreatic tumorigenesis remain incompletely understood. In this study, we provide the first identification and characterization of mesenchymal stem cells (MSC) within the human PDA microenvironment, highlighting the heterogeneity of the fibroblast population. Primary patient PDA samples and low-passage human pancreatic cancer-associated fibroblast cultures were found to contain a unique population of cancer-associated MSCs (CA-MSC). CA-MSCs markedly enhanced the growth, invasion, and metastatic potential of PDA cancer cells. CA-MSCs secreted the cytokine GM-CSF that was required for tumor cell proliferation, invasion, and transendothelial migration. Depletion of GM-CSF in CA-MSCs inhibited the ability of these cells to promote tumor cell growth and metastasis. Together, these data identify a population of MSCs within the tumor microenvironment that possesses a unique ability, through GM-CSF signaling, to promote PDA survival and metastasis.

Significance: The role of stroma in pancreatic cancer is controversial. Here, we provide the first characterization of MSCs within the human PDA microenvironment and demonstrate that CA-MSCs promote tumorigenesis through the production of GM-CSF. These data identify a novel cytokine pathway that mediates mesenchymal-epithelial cross-talk and is amenable to therapeutic intervention. Cancer Discov; 6(8); 886-99. ©2016 AACR.This article is highlighted in the In This Issue feature, p. 803.


Conflict of interest statement

Disclosure of Potential Conflict of Interest

No potential conflicts of interest were disclosed.

Figures

Figure 1
Figure 1
Isolation of primary human pancreatic cancer-associated MSCs (CA-MSC). A, IHC staining for CK19 and CD45 protein expression in representative samples of human pancreatic cancer tissue and isolated CAF cells. B, representative KRAS mutational analysis of matched cancer cells and isolated CAFs. A mutation is present in the codon 12/13 region (red) in the cancer cells but absent in the CAFs (green). C, immunofluorescence staining for α-SMA (red), vimentin (red), and FAP (green) protein in human pancreatic cancer tissue and isolated CAFs. Arrows indicate higher expression of protein within cells, and arrowheads indicate lower expression of protein within cells. Magnification, ×200. D, FACS analysis of primary human pancreatic CAF line, demonstrating CD44+ CD73+ CD90+ CD49α+ expression. E, CA-MSCs but not CAFs demonstrate multipotent differentiation capacity in differential culture conditions. Specific cell stains used were Alizarin Red for bone, Oil Red O for adipose, and Alcian Blue for cartilage. Magnification, ×200. F, quantitative RT-PCR analysis of the differentiation-specific expression markers RUNX2 for bone, Adipsin for adipose, and COMP for cartilage. All samples were normalized to GAPDH; n = 3; *, P < 0.05. G, photograph of colonies stained with crystal violet. H, quantitation of colonies generated from CAF vs. CA-MSC is shown; n = 3; *, P < 0.05 vs. CAF.
Figure 2
Figure 2
Pancreatic CA-MSCs promote tumor growth and metastasis. 104 UM5 pancreatic cancer cells transduced with a luciferase-expressing lentivirus were orthotopically injected alone or with CAF or CA-MSC into the pancreatic tail of NOD/SCID mice (n = 8 per group). A, representative bioluminescent images of animals in each group are shown at 3 weeks after injection depicting tumor growth. B, bioluminescent-based tumor growth (measured by signal intensity p/s/cm2) of luciferase tumors alone or in combination with CAFs or CA-MSCs (MSC). Pooled results of the average tumor size ± SEM from each group. *, P < 0.05. C, sections from orthotopic pancreatic tumors were stained for CK19 (green) to mark epithelial cells and Ki-67 (red) to mark proliferating cells. Nuclei were stained with DAPI (blue). D, immunostaining for RFP on sections of tumor + CAF and tumor + CA-MSC orthotopic grafts at 6 weeks after implantation. E, trichrome blue staining showing differences in fibrosis in different groups. F, quantitation of % collagen-positive area over total visual field (20x, n = 5) is shown (*, P < 0.05 vs. tumor).
Figure 3
Figure 3
Pancreatic CA-MSCs promote tumor cell metastasis. Pancreatic cancer cells transduced with a luciferase-expressing lentivirus were orthotopically injected alone or with CAFs or CA-MSCs into the pancreatic tail of NOD/SCID mice (n = 8 per group). A, representative images of gross metastatic lesions in the liver from mice in the tumor + CA-MSCs groups at 6 weeks after implantation, and representative hematoxylin and eosin–stained sections of metastatic nodules in liver and lung are shown. B, percentage of mice with metastasis is indicated in the graph (n = 8 per group). C, quantification of circulating GFP+ tumor cells (CTC). D, quantification of circulating DsRed+ fibroblast cells (CFC). In B and C, *, P < 0.05 vs. tumor alone; in D, *, P < 0.05 vs. tumor + CAF. E, sections of metastatic nodules from tumor plus CA-MSC liver stained with anti-GFP. F, sections of metastatic nodules from tumor plus CA-MSC liver stained with anti-RFP antibody. Inset showing RFP-labeled MSC next to GFP-labeled proliferating tumor cells, and both RFP-and GFP-labeled cells next to blood vessels (BV).
Figure 4
Figure 4
CA-MSCs differentially secrete GM-CSF. Human cytokine arrays showing the cytokine expression of human primary pancreatic CAFs and CA-MSCs (MSC) from 4 patients with pancreatic cancer. A, differential expression of GM-CSF by CA-MSCs was present in all 4 patient samples. B, immunofluorescent staining for the GM-CSF receptors CSF2Rα (green) and CSF2Rβ (red) in human PDA tissue sections. Nuclei are stained with DAPI (blue). C, immunofluorescent staining for CD45 (green) used to identify immune cells and CSF2Rβ (red) in human PDA tissue sections. D, immunofluorescence staining for CK19 (green) to identify ductal cells and CSF2Rβ (red) in human PDA tissue sections. E, Western blots showing differential expression of GM-CSF receptors in tumor and CAF cells. F, ELISA data quantifying amount of GM-CSF secreted by KRAS wild-type (BxPC-3) and KRAS-mutant (UM2 and CFPAC-1) tumor cells and CA-MSCs (data expressed as mean ± SEM; *, P < 0.0001 compared with BxPC-3 alone; #, P < 0.0001 compared with UM2 alone; and +, P < 0.005 compared with CFPAC-1 alone).
Figure 5
Figure 5
GM-CSF from CA-MSCs is required for tumor cell invasion and transendothelial migration. A, levels of GM-CSF mRNA in CA-MSCs expressing control shRNA or GM-CSF shRNA 1 or 2. B, levels of CSFR2A mRNA in tumor cells expressing control siRNA or CSF2RA siRNA 1 or 2. C, increased proliferation of UM5 tumor cells when cultured with CA-MSC cells expressing control vs. GM-CSF shRNA (data expressed as mean ± SEM; n = 3; *, P < 0.0002 compared with UM5 control; #, P < 0.0002 compared with UM5 tumor cell + GM-CSF shRNA CA-MSC). D, increased proliferation of UM8 tumor cells when cultured with CA-MSC cells expressing control vs. GM-CSF shRNA (*, P < 0.001 compared with UM8 control; #, P < 0.001 compared with UM8 tumor cell + GM-CSF shRNA CA-MSC). E, collagen invasion assays in GFP-labeled tumor cells alone, tumor cells + control shRNA CA-MSC, tumor cells + GM-CSF shRNA CA-MSCs, and exogenous GM-CSF added to tumor cells + GM-CSF shRNA MSCs. CA-MSCs are labeled with DsRed. F, the invasion of tumor cells was significantly increased in the presence of CA-MSC cells. This increase in invasion index was inhibited with GM-CSF knockdown in MSCs and rescued with exogenous GM-CSF (data expressed as mean ± SEM; n = 3; *, P < 0.0001 compared with control). G, microscopic images showing enhanced migration through an endothelial layer of tumor cells + control shRNA CA-MSC compared with tumor cells + GM-CSF shRNA CA-MSCs [GFP-labeled tumor cells (green), DsRed-labeled CA-MSC cells (red), and nuclei stained with DAPI (blue)]. H, quantification of tumor cells migrating through the endothelial layer under different treatment conditions. Increase in tumor cell migration when cultured with CA-MSCs expressing control vs. GM-CSF shRNA (data expressed as mean ± SEM; n = 3; *, P < 0.001 compared with control; #, P < 0.01 compared with tumor + GM-CSF shRNA CA-MSC).
Figure 6
Figure 6
GM-CSF induces tumor cell EMT and stemness. A, IHC staining of UM5 tumor cells for the epithelial marker E-cadherin and mesenchymal marker vimentin following treatment with exogenous GM-CSF (100 ng/mL). B, Western blotting for EMT markers and phosphorylated (p) and total STAT3 in the UM5, UM2, and UM8 pancreatic cancer cells treated with exogenous GM-CSF. C, Western blot evaluating expression of EMT markers in either control or STAT3 siRNA (1 and 2) UM5 cells treated with GM-CSF. D, enhanced size of tumorspheres when UM5, UM2, and UM8 tumor cells were treated with 100 ng/mL GM-CSF (*, P < 0.0001 vs. control for UM5; *, P < 0.0001 vs. control for UM2; *, P < 0.004 vs. control for UM8). E, FACS analysis revealed an increase in the percentage of CSCs (ESA+ CD44+ CD24+) when cultured in the presence of exogenous GM-CSF (100 ng/mL; *, P < 0.05 vs. control for UM5; *, P < 0.02 vs. control for UM2; *, P < 0.0001 vs. control for UM8). F, FACS analysis for CSF2Rα receptor expression in CSCs (green) and bulk cells (red) showing significantly higher number of CSCs (green) expressing GM-CSF receptor than the bulk tumor cell population (red).
Figure 7
Figure 7
GM-CSF is required for CA-MSC–induced tumor metastasis. Pancreatic cancer cells transduced with a luciferase-expressing lentivirus were orthotopically injected alone or with CA-MSCs expressing control or GM-CSF shRNA-2 into the pancreatic tail of NOD/SCID mice (n = 5 per group). A, representative bioluminescent images of animals in each group are shown 3 weeks after injection depicting tumor burden. B, bioluminescent-based tumor growth from tumor cells alone or in combination with CA-MSCs expressing control or GM-CSF shRNA. Pooled results of the average tumor size ± SEM from each group. C, percentage of mice with metastasis in each group is indicated (n = 5 per group; *, P < 0.05 vs. tumor alone).

Similar articles

Cited by

References

    1. Chen J, Carcamo JM, Borquez-Ojeda O, Erdjument-Bromage H, Tempst P, Golde DW. The laminin receptor modulates granulocyte-macrophage colony-stimulating factor receptor complex formation and modulates its signaling. Proc Natl Acad Sci U S A. 2003;100:14000–5. - PMC - PubMed
    1. Olive KP, Jacobetz MA, Davidson CJ, Gopinathan A, McIntyre D, Honess D, et al. Inhibition of Hedgehog signaling enhances delivery of chemotherapy in a mouse model of pancreatic cancer. Science. 2009;324:1457–61. - PMC - PubMed
    1. Hwang RF, Moore T, Arumugam T, Ramachandran V, Amos KD, Rivera A, et al. Cancer-associated stromal fibroblasts promote pancreatic tumor progression. Cancer Res. 2008;68:918–26. - PMC - PubMed
    1. Ikenaga N, Ohuchida K, Mizumoto K, Cui L, Kayashima T, Morimatsu K, et al. CD10+ pancreatic stellate cells enhance the progression of pancreatic cancer. Gastroenterology. 2010;139:1041–51. 51 e1–8. - PubMed
    1. Kikuta K, Masamune A, Watanabe T, Ariga H, Itoh H, Hamada S, et al. Pancreatic stellate cells promote epithelial-mesenchymal transition in pancreatic cancer cells. Biochem Biophys Res Commun. 2010;403:380–4. - PubMed

MeSH terms