

Hyperosmosis and its combination with nutrient-limitation are novel environmental stressors for induction of triacylglycerol accumulation in cells of Chlorella kessleri
- PMID: 27184595
- PMCID: PMC4869002
- DOI: 10.1038/srep25825
Hyperosmosis and its combination with nutrient-limitation are novel environmental stressors for induction of triacylglycerol accumulation in cells of Chlorella kessleri
Abstract
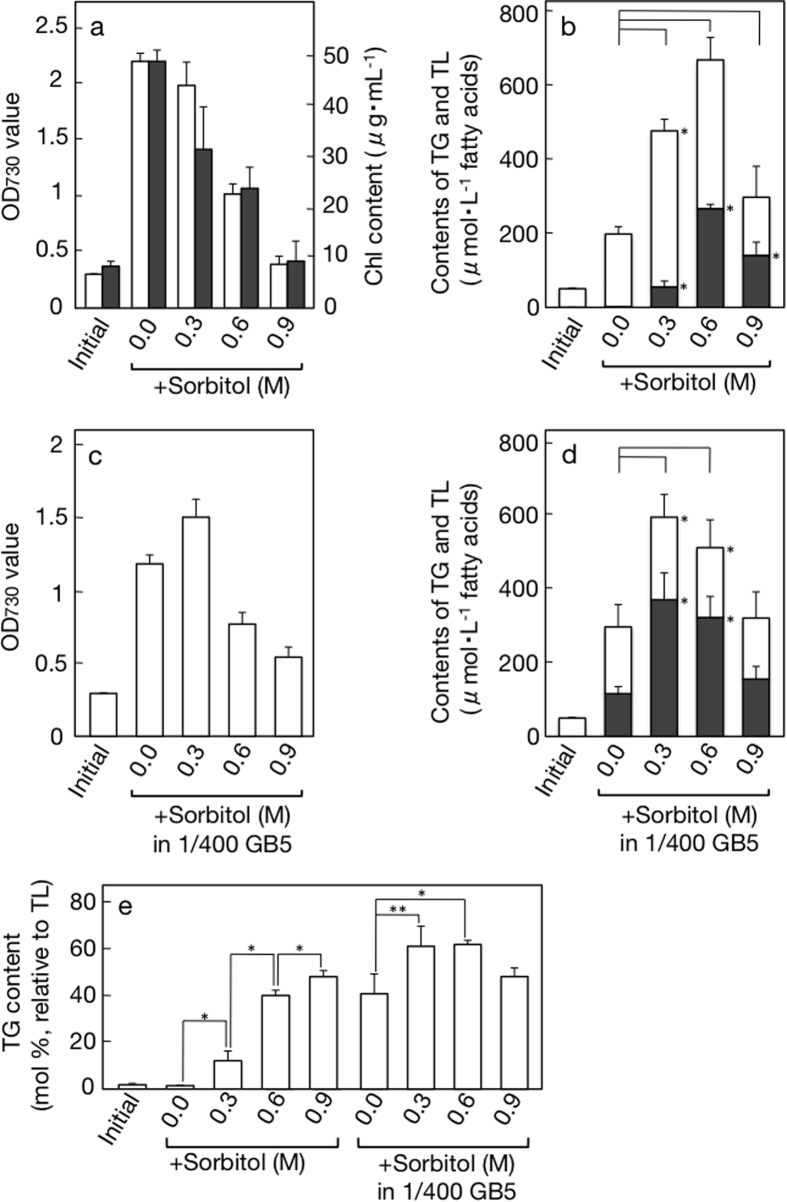
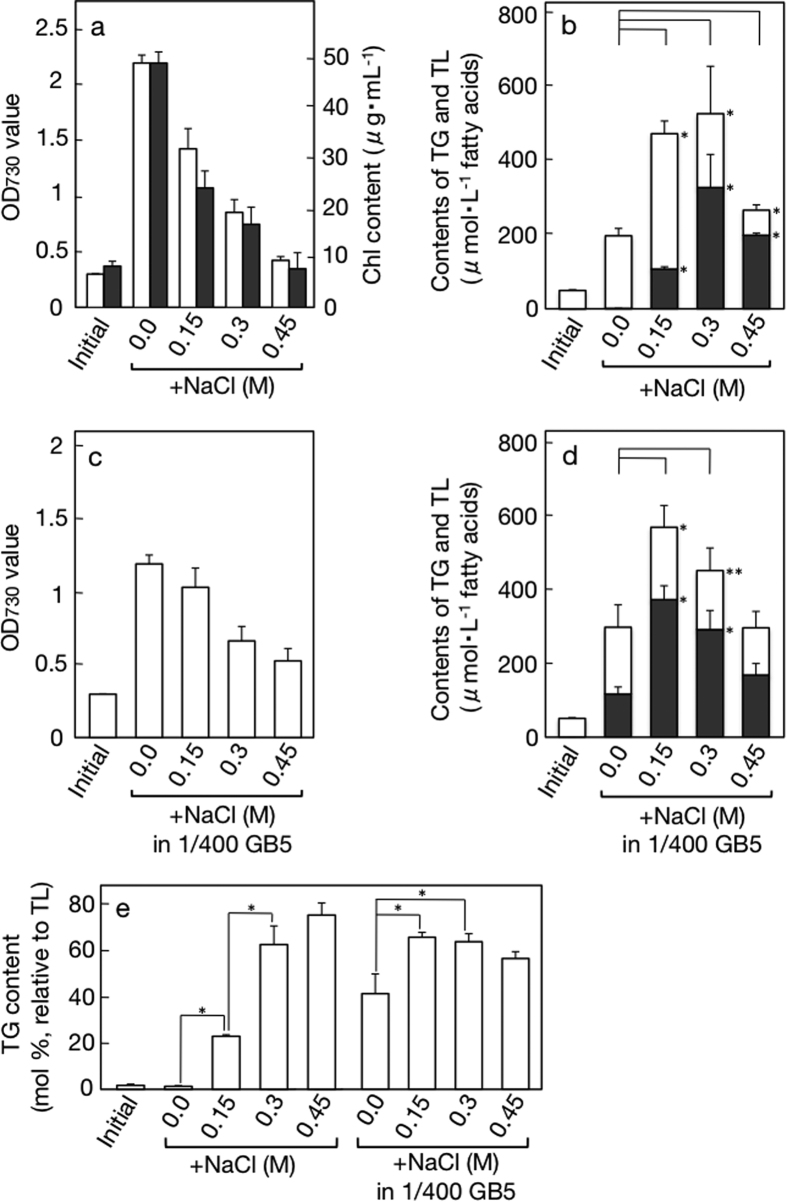
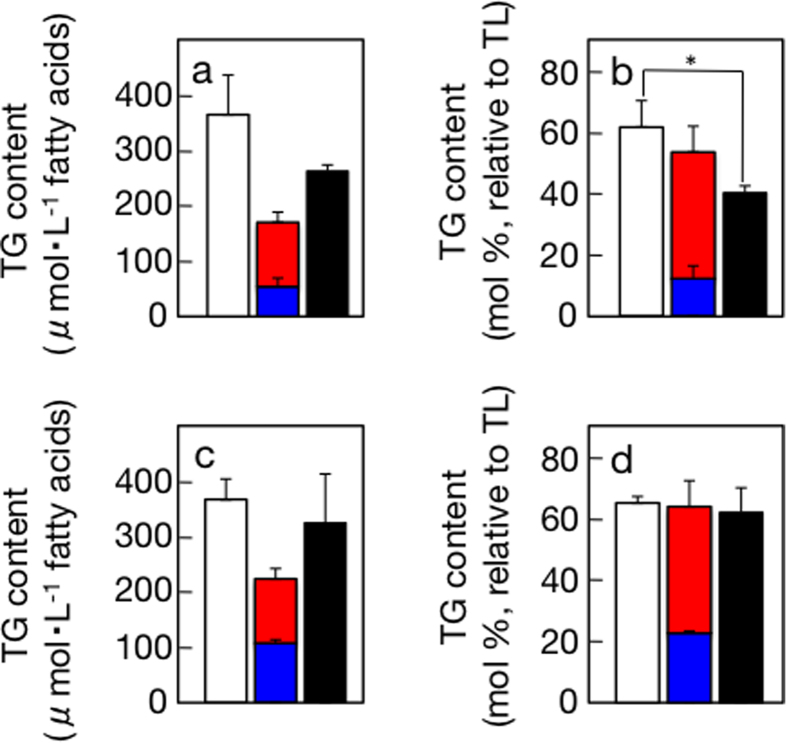
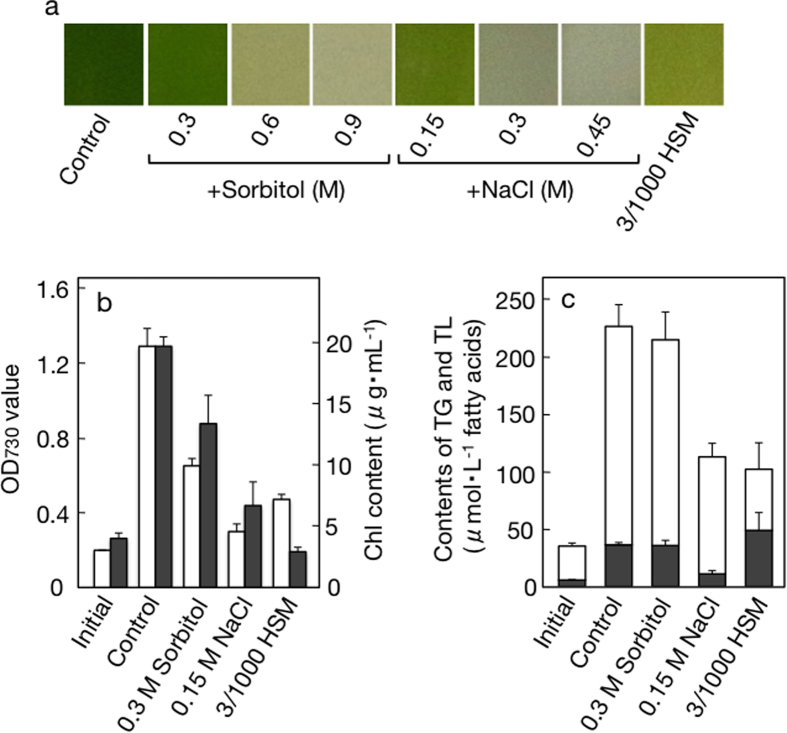
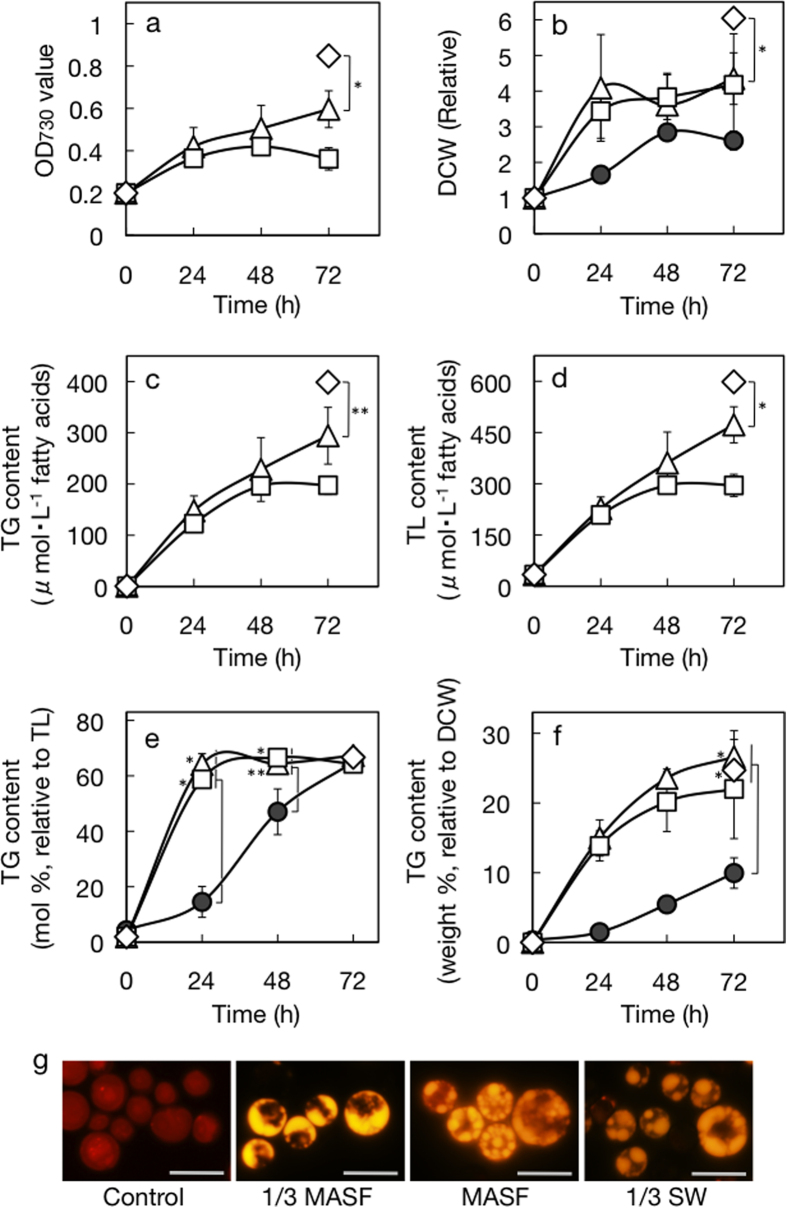
Triacylglycerols of oleaginous algae are promising for production of food oils and biodiesel fuel. Air-drying of cells induces triacylglycerol accumulation in a freshwater green alga, Chlorella kessleri, therefore, it seems that dehydration, i.e., intracellular hyperosmosis, and/or nutrient-limitation are key stressors. We explored this possibility in liquid-culturing C. kessleri cells. Strong hyperosmosis with 0.9 M sorbitol or 0.45 M NaCl for two days caused cells to increase the triacylglycerol content in total lipids from 1.5 to 48.5 and 75.3 mol%, respectively, on a fatty acid basis, whereas nutrient-limitation caused its accumulation to 41.4 mol%. Even weak hyperosmosis with 0.3 M sorbitol or 0.15 M NaCl, when nutrient-limitation was simultaneously imposed, induced triacylglycerol accumulation to 61.9 and 65.7 mol%, respectively. Furthermore, culturing in three-fold diluted seawater, the chemical composition of which resembled that of the medium for the combinatory stress, enabled the cells to accumulate triacylglycerol up to 24.7 weight% of dry cells in only three days. Consequently, it was found that hyperosmosis is a novel stressor for triacylglycerol accumulation, and that weak hyperosmosis, together with nutrient-limitation, exerts a strong stimulating effect on triacylglycerol accumulation. A similar combinatory stress would contribute to the triacylglycerol accumulation in air-dried C. kessleri cells.
Figures
Similar articles
-
Regulatory carbon metabolism underlying seawater-based promotion of triacylglycerol accumulation in Chlorella kessleri.Bioresour Technol. 2019 Oct;289:121686. doi: 10.1016/j.biortech.2019.121686. Epub 2019 Jun 19. Bioresour Technol. 2019. PMID: 31238290
-
Air-drying of cells, the novel conditions for stimulated synthesis of triacylglycerol in a Green Alga, Chlorella kessleri.PLoS One. 2013 Nov 15;8(11):e79630. doi: 10.1371/journal.pone.0079630. eCollection 2013. PLoS One. 2013. PMID: 24260270 Free PMC article.
-
Screening and characterization of oleaginous Chlorella strains and exploration of photoautotrophic Chlorella protothecoides for oil production.Bioresour Technol. 2015 May;184:53-62. doi: 10.1016/j.biortech.2014.09.054. Epub 2014 Sep 18. Bioresour Technol. 2015. PMID: 25266686
-
Potential lipid accumulation and growth characteristic of the green alga Chlorella with combination cultivation mode of nitrogen (N) and phosphorus (P).Bioresour Technol. 2014 Dec;174:24-32. doi: 10.1016/j.biortech.2014.09.142. Epub 2014 Oct 5. Bioresour Technol. 2014. PMID: 25463778
-
Triacylglycerol Accumulation in Photosynthetic Cells in Plants and Algae.Subcell Biochem. 2016;86:179-205. doi: 10.1007/978-3-319-25979-6_8. Subcell Biochem. 2016. PMID: 27023236 Review.
Cited by
-
Coproduction of lipids and extracellular polysaccharides from the novel green alga Parachlorella sp. BX1.5 depending on cultivation conditions.Biotechnol Rep (Amst). 2019 Nov 21;25:e00392. doi: 10.1016/j.btre.2019.e00392. eCollection 2020 Mar. Biotechnol Rep (Amst). 2019. PMID: 31871922 Free PMC article.
-
Diacylglyceryl-N,N,N-trimethylhomoserine-dependent lipid remodeling in a green alga, Chlorella kessleri.Commun Biol. 2022 Jan 11;5(1):19. doi: 10.1038/s42003-021-02927-z. Commun Biol. 2022. PMID: 35017659 Free PMC article.
-
Fatty Acid Content and Composition of Triacylglycerols of Chlorella kessleri.Bio Protoc. 2018 Jan 5;8(1):e2676. doi: 10.21769/BioProtoc.2676. eCollection 2018 Jan 5. Bio Protoc. 2018. PMID: 34179230 Free PMC article.
-
Coproduction of lipids and carotenoids by the novel green alga Coelastrella sp. depending on cultivation conditions.Biotechnol Rep (Amst). 2022 Oct 24;37:e00769. doi: 10.1016/j.btre.2022.e00769. eCollection 2023 Mar. Biotechnol Rep (Amst). 2022. PMID: 36660172 Free PMC article.
-
The oleaginous astaxanthin-producing alga Chromochloris zofingiensis: potential from production to an emerging model for studying lipid metabolism and carotenogenesis.Biotechnol Biofuels. 2021 May 15;14(1):119. doi: 10.1186/s13068-021-01969-z. Biotechnol Biofuels. 2021. PMID: 33992124 Free PMC article. Review.
References
-
- Murphy D. J. The biogenesis and functions of lipid bodies in animals, plants and microorganisms. Prog. Lipid Res. 40, 325–438 (2001). - PubMed
-
- Quettier A. L. & Eastmond P. J. Storage oil hydrolysis during early seedling growth. Plant Physiol. Biochem. 47, 485–490 (2009). - PubMed
-
- Kurat C. F. et al.. Cdk1/Cdc28-dependent activation of the major triacylglycerol lipase Tgl4 in yeast links lipolysis to cell-cycle progression. Mol. Cell 16, 53–63 (2009). - PubMed
-
- Hu Q. et al.. Microalgal triacylglycerols as feedstocks for biofuel production: perspectives and advances. Plant J. 54, 621–639 (2008). - PubMed
MeSH terms
Substances
LinkOut - more resources
Full Text Sources
Other Literature Sources
