. 2016 Jun;107(6):267-73.
doi: 10.1016/j.ygeno.2016.05.002. Epub 2016 May 13.

HyCCAPP as a tool to characterize promoter DNA-protein interactions in Saccharomyces cerevisiae

Affiliations

HyCCAPP as a tool to characterize promoter DNA-protein interactions in Saccharomyces cerevisiae

Hector Guillen-Ahlers et al. Genomics. 2016 Jun.

Abstract

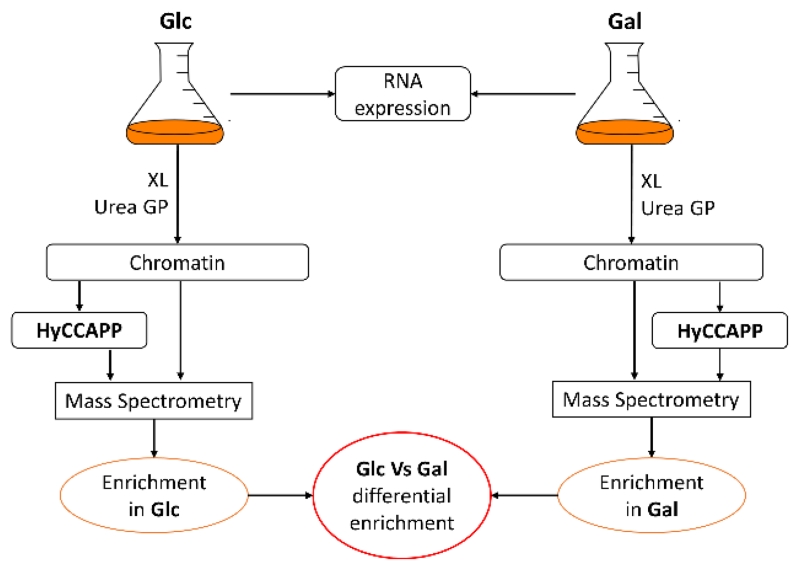
Currently available methods for interrogating DNA-protein interactions at individual genomic loci have significant limitations, and make it difficult to work with unmodified cells or examine single-copy regions without specific antibodies. In this study, we describe a physiological application of the Hybridization Capture of Chromatin-Associated Proteins for Proteomics (HyCCAPP) methodology we have developed. Both novel and known locus-specific DNA-protein interactions were identified at the ENO2 and GAL1 promoter regions of Saccharomyces cerevisiae, and revealed subgroups of proteins present in significantly different levels at the loci in cells grown on glucose versus galactose as the carbon source. Results were validated using chromatin immunoprecipitation. Overall, our analysis demonstrates that HyCCAPP is an effective and flexible technology that does not require specific antibodies nor prior knowledge of locally occurring DNA-protein interactions and can now be used to identify changes in protein interactions at target regions in the genome in response to physiological challenges.

Keywords: Chromatin; Chromatin immunoprecipitation; DNA-protein interactions; ENO2; Proteomics; Yeast.


Figures

Figure 1
Figure 1
HyCCAPP workflow diagram. Gene expression for yeast cells grown under glucose or galactose is measured to help identify relevant regions for HyCCAPP experiments. Cells are crosslinked, harvested and the chromatin is purified using gradient ultracentrifugation. MS is used to identify proteins in the chromatin and in samples resulting from the HyCCAPP process. Both general chromatin-associated proteins and HyCCAPP-captured proteins that are enriched under one of the two growth conditions are identified. Glc, glucose; Gal, galactose; XL, crosslinked; GP, gradient purification.
Figure 2
Figure 2
Urea gradient profile. DNA and protein contents are shown for each individual fraction and the remaining pellet after ultracentrifugation in a 5-8M urea gradient.
Figure 3
Figure 3
Hybridization strategy. (a) Diagram depicting the target regions for ENO2 and GAL1 promoter regions. Target oligonucleotides are designed targeting both strands and both ends of the target regions. For each HyCCAPP target region, three qPCR assays were designed accounting for the size differences between the HyCCAPP process and the ChIP validations. Distances in base pairs from the middle of the 5′ capture region are shown. (b) Hybridization capture experiments were carried out with an increasing number of capture oligonucleotides without altering the total final concentration of capture oligonucleotides. The efficiency was measured through qPCR after reversing the crosslinking of the captured material. Fold increases were calculated relative to hybridization with one oligonucleotide. Depicted error bars represent the standard deviation. No significant change was observed in non-specific capture across all samples. (c) Subsequent captures using oligonucleotides targeting the ENO2 and GAL1 regions. Capture efficiency was measured through qPCR after reversing the crosslinking of the captured material. ENO and GAL refer to captures using fresh chromatin, while ENO-ENO/GAL and GAL-ENO/GAL, refer to captures using chromatin previously used for captures targeting the ENO2 and GAL1 regions, respectively.
Figure 4
Figure 4
Sequencing of captured material. DNA extracted from HyCCAPP experiments was sequenced and aligned to the yeast genome. The plot depicts read counts in 1 kb windows throughout the genome. The target region (ENO2 promoter in chromosome VIII) had twice as many counts as the next most abundant region (UTP21 in chromosome XII). A total of 86.94% of all 1 kb windows had a count of 0 reads. Detected reads represent less than 1.4% of the whole genome.
Figure 5
Figure 5
ChIP validation. TAP-Tag strains for PAB1 and SEC28 were used for ChIP-qPCR validations. Fold changes for galactose relative to glucose grown cells are shown for the ENO2 promoter region.

References

    1. Elnitski L, Jin VX, Farnham PJ, Jones SJM. Locating mammalian transcription factor binding sites: A survey of computational and experimental techniques. Genome Res. 2006;16:1455–1464. - PubMed
    1. Walhout AJM. Unraveling transcription regulatory networks by protein–DNA and protein–protein interaction mapping. Genome Res. 2006;16:1445–1454. - PubMed
    1. Boyle AP, Song L, Lee B-K, London D, Keefe D, et al. High-resolution genome-wide in vivo footprinting of diverse transcription factors in human cells. Genome Res. 2011;21:456–464. - PMC - PubMed
    1. Guillen-Ahlers H, Shortreed MR, Smith LM, Olivier M. Advanced methods for the analysis of chromatin-associated proteins. Physiol Genomics. 2014;46:441–447. - PMC - PubMed
    1. Lambert J-P, Fillingham J, Siahbazi M, Greenblatt J, Baetz K, et al. Defining the budding yeast chromatin-associated interactome. Mol Syst Biol. 2010;6:448. - PMC - PubMed

Publication types

MeSH terms