. 2016 May 17:6:25948.
doi: 10.1038/srep25948.

Integrated metabolomic and transcriptome analyses reveal finishing forage affects metabolic pathways related to beef quality and animal welfare

Affiliations

Integrated metabolomic and transcriptome analyses reveal finishing forage affects metabolic pathways related to beef quality and animal welfare

José A Carrillo et al. Sci Rep. .

Abstract

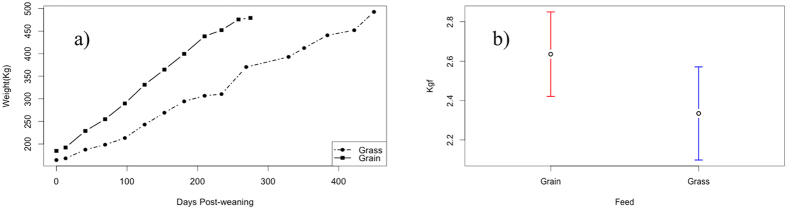
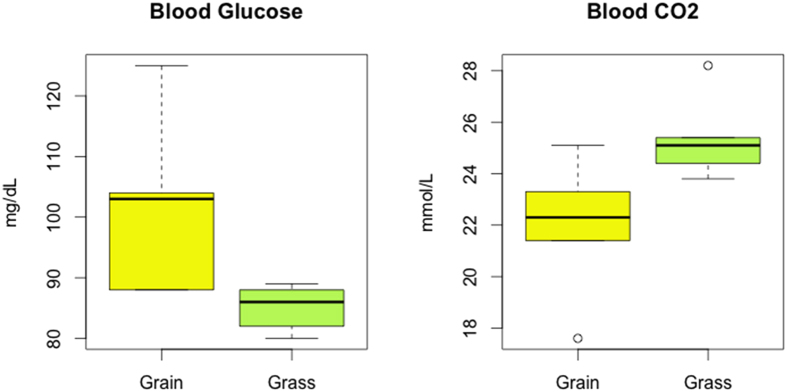
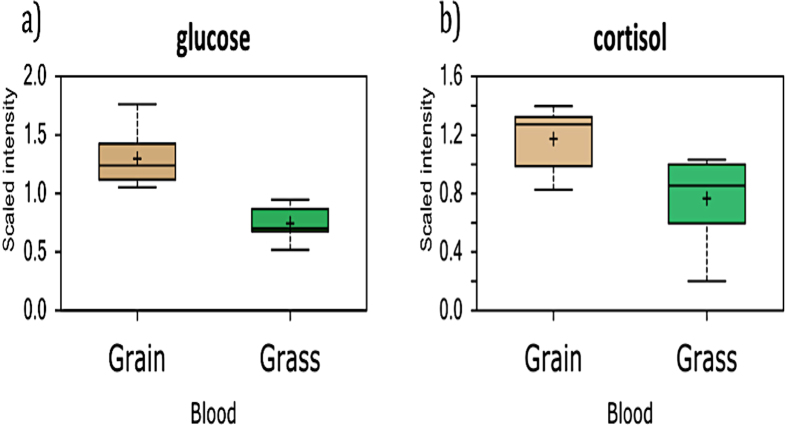
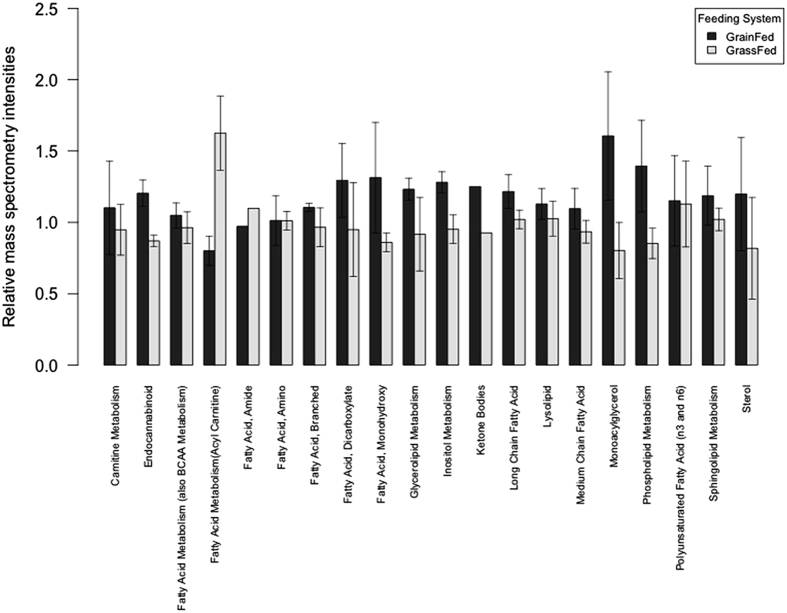
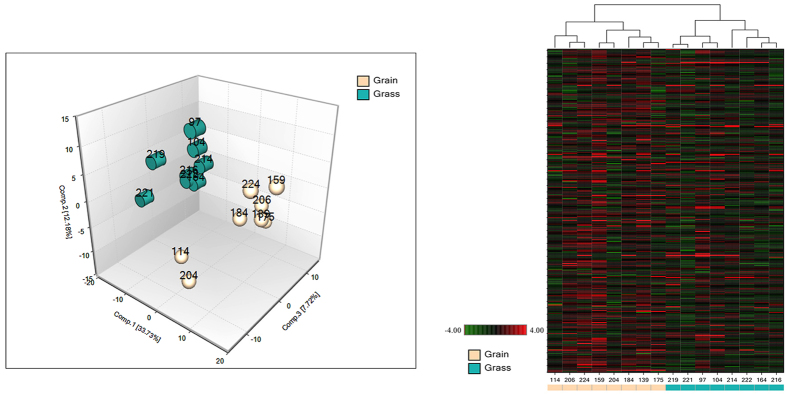
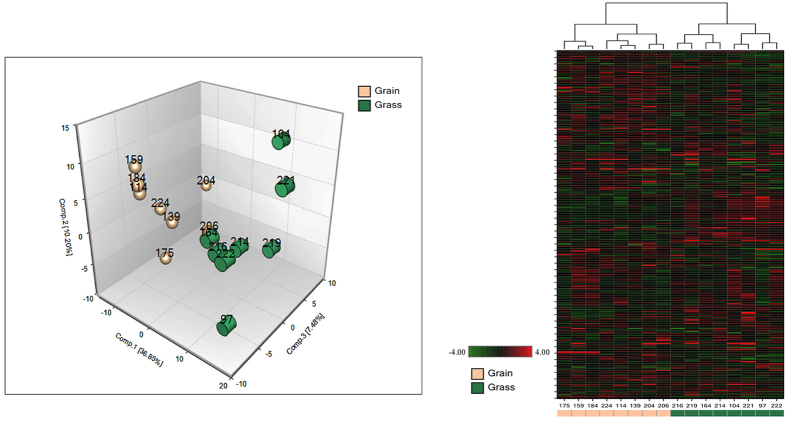
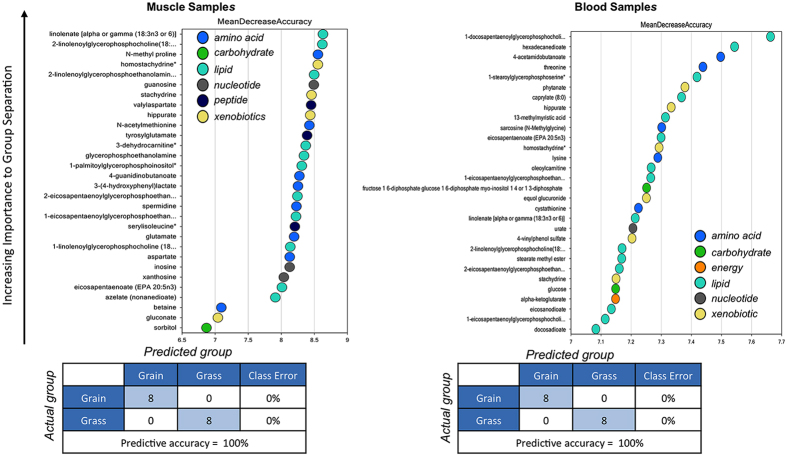
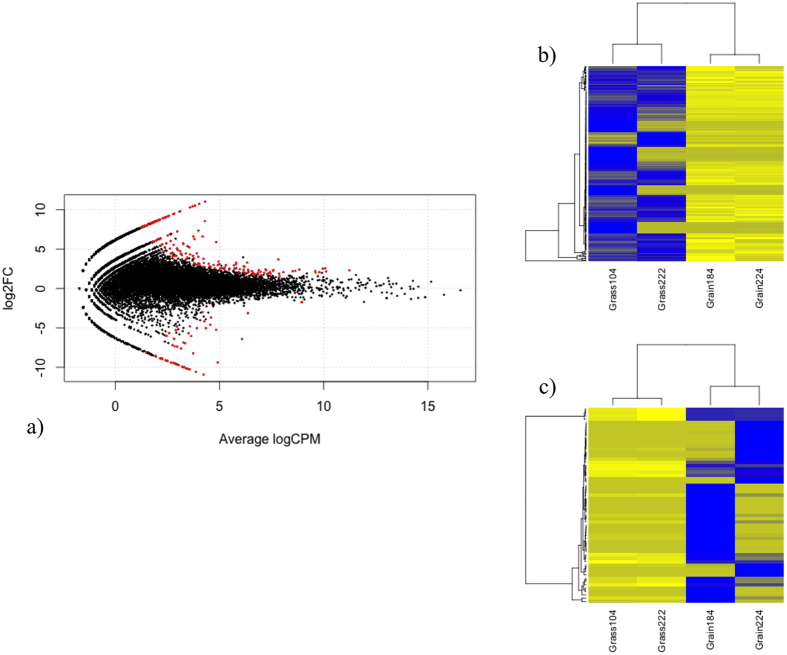
Beef represents a major dietary component and source of protein in many countries. With an increasing demand for beef, the industry is currently undergoing changes towards naturally produced beef. However, the true differences between the feeding systems, especially the biochemical and nutritional aspects, are still unclear. Using transcriptome and metabolome profiles, we identified biological pathways related to the differences between grass- and grain-fed Angus steers. In the latissimus dorsi muscle, we have recognized 241 differentially expressed genes (FDR < 0.1). The metabolome examinations of muscle and blood revealed 163 and 179 altered compounds in each tissue (P < 0.05), respectively. Accordingly, alterations in glucose metabolism, divergences in free fatty acids and carnitine conjugated lipid levels, and altered β-oxidation have been observed. The anti-inflammatory n3 polyunsaturated fatty acids are enriched in grass finished beef, while higher levels of n6 PUFAs in grain finished animals may promote inflammation and oxidative stress. Furthermore, grass-fed animals produce tender beef with lower total fat and a higher omega3/omega6 ratio than grain-fed ones, which could potentially benefit consumer health. Most importantly, blood cortisol levels strongly indicate that grass-fed animals may experience less stress than the grain-fed individuals. These results will provide deeper insights into the merits and mechanisms of muscle development.


Figures

Figure 1
Figure 1. Growth curve and beef tenderness in different diets.
(a) Body weights trajectories in grass-fed and grain-fed steers from weaning until termination (Grass, Grain: n = 30 and 36, respectively). (b) Warner-Bratzler Shear Force expressed in kilogram-force (kgf) in muscle obtained from grain-fed and grass-fed animals.
Figure 2
Figure 2. Glucose and CO2 blood levels in grain- and grass-fed steers.
(a) Blood glucose level obtained through conventional clinical analysis, represented in milligram per deciliter (mg/dL) (n = 10 for each group); (b) Carbon dioxide measured in blood and expressed as milimol per liter (mmol/L) (n = 10 for each group).
Figure 3
Figure 3. Glucose and cortisol metabolomics blood levels in grain and grass fed animals.
(a) Glucose level measured in blood employing metabolomic approach (y axis represents mass spectrometry scaled intensity, n = 8 for each group). (b) Relative mass spectrometry scaled intensities of cortisol determined in blood of grass and grain fed steers (n = 8 for each group).
Figure 4
Figure 4. Averaged relative mass spectrometry intensities of 131 lipid molecules detected in muscle of grain-fed and grass-fed animals.
There are 20 sub-pathways according to its physical and/or functional properties. Sub-pathways Fatty Acid, Amide and Ketone Bodies only have one member thus error bars are absent in these two groups.
Figure 5
Figure 5. Principal Component Analysis (PCA) and hierarchical clustering obtained from employing metabolic concentration of all metabolites detected in muscle tissue.
Turquoise and light-brown color represent grass and grain-fed groups, respectively. In the heatmap red color denotes enrichment of the corresponding molecules, contrary to green color that represents depletion (n = 8 for each group).
Figure 6
Figure 6. Principal Component Analysis (PCA) and heatmap acquired from metabolites relative expression calculated in blood of grain- and grass-fed steers.
In the hierarchical clustering red color shows higher level of the corresponding biochemical, opposite to green that means reduction. Light brown and green colors represent grain and grass-fed individuals in both graphs (n = 8 for each group).
Figure 7
Figure 7. Random forest analyses obtained from muscle and blood.
Random forest analysis consists in a supervised classification technique based on an ensemble of decision trees that has proven to be a valuable statistical tool for identifying biomarkers of interest. Random forest analysis based on the biochemicals detected in this dataset resulted in a predictive accuracy of 100% between dietary conditions. This value is greater than random chance (50%), suggesting these metabolites may be of interest as biomarkers. The y-axis represents the molecules in order of importance for group classification, from top to bottom. The legend represents the type of biochemical and the table below each chart shows the prediction accuracy based on the random forest result (actual against predicted group).
Figure 8
Figure 8. Differentially expresses genes.
(a) MA plot shows the significant differentially expressed genes in red, (y-axis depicts the log2 fold change of gene expression between grass and grain fed groups; x-axis represents the average log reads count per million for each gene). (b) Hierarchical cluster of samples according to up-regulated genes in the grass-fed group. (c) Heatmap obtained using down-regulated genes in grass-fed individuals.
Figure 9
Figure 9. Bovine mitochondrial coding genes.
(a) Peaks obtained from the alignment of reads to the mitochondrial genomic reference during RNA-Seq analysis; yellow and green peaks correspond to grain and grass-fed samples respectively. (b) Heatmap of the 13 mitochondrial protein-coding genes according to their expression levels. The dendogram demostrates that grass-fed animals have a more consistent mitochondrial gene expression profile than grain-fed individuals.
Figure 10
Figure 10. Validation of the RNA-Seq result by qPCR.
The y-axis represents the log2 fold change of gene expression; x-axis shows the Ensembl names of genes employed for validation. Black and gray bars depict the RNA-Seq and qPCR results, respectively.

References

    1. Ames B. N. & Wakimoto P. Are vitamin and mineral deficiencies a major cancer risk? Nature Reviews Cancer 2, 694–704, doi: 10.1038/nrc886 (2002). - DOI - PubMed
    1. Realini C. E., Duckett S. K. & Windham W. R. Effect of vitamin C addition to ground beef from grass-fed or grain-fed sources on color and lipid stability, and prediction of fatty acid composition by near-infrared reflectance analysis. Meat Sci 68, 35–43, doi: 10.1016/j.meatsci.2004.02.002 (2004). - DOI - PubMed
    1. Xue H., Mainville D., You W. & Nayga R. M. Jr Consumer preferences and willingness to pay for grass-fed beef: Empirical evidence from in-store experiments. Food Quality and Preference 21, 857–866, doi: 10.1016/j.foodqual.2010.05.004 (2010). - DOI
    1. Roosevelt M. The grass-fed revolution. Beef raised wholly on pasture, rather than grain-fed in feedlots, may be better for your health–and for the planet. Time 167, 76–78 (2006). - PubMed
    1. Roberts J. L. The prevalence and economic significance of liver disorders and contamination in grain-fed and grass-fed cattle. Aust Vet J 59, 129–132 (1982). - PubMed

Publication types