. 2016 Nov 1;22(21):5362-5369.
doi: 10.1158/1078-0432.CCR-15-2889. Epub 2016 May 16.

Intratumor Heterogeneity Affects Gene Expression Profile Test Prognostic Risk Stratification in Early Breast Cancer

Affiliations

Intratumor Heterogeneity Affects Gene Expression Profile Test Prognostic Risk Stratification in Early Breast Cancer

Rekha Gyanchandani et al. Clin Cancer Res. .

Abstract

Purpose: To examine the effect of intratumor heterogeneity (ITH) on detection of genes within gene expression panels (GEPs) and the subsequent ability to predict prognostic risk.

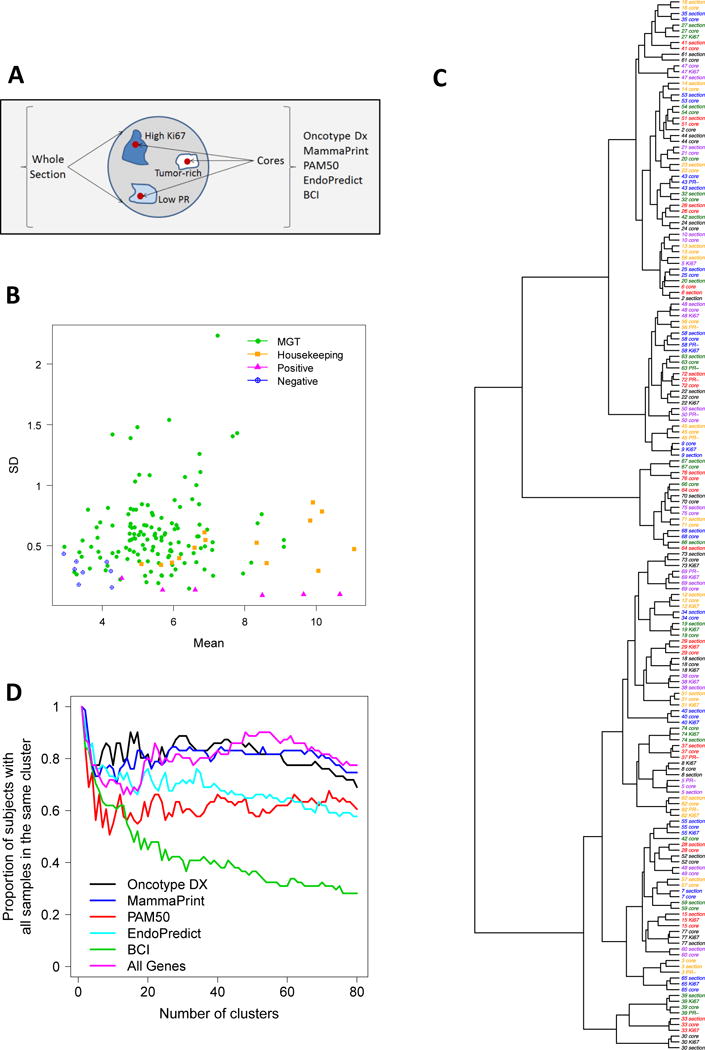
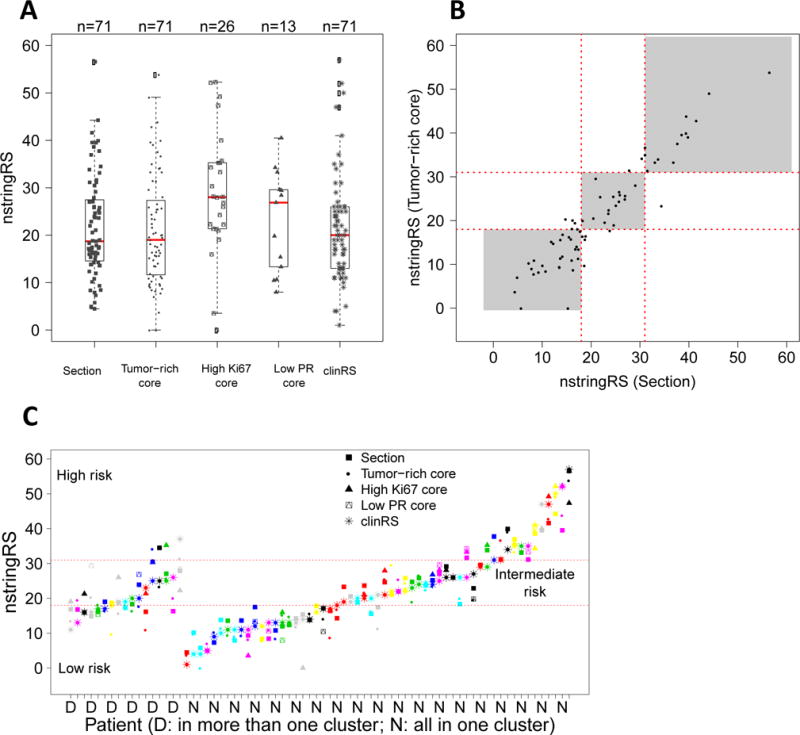
Experimental design: Multiplexed barcoded RNA analysis was used to measure the expression of 141 genes from five GEPs (Oncotype Dx, MammaPrint, PAM50, EndoPredict, and Breast Cancer Index) in breast cancer tissue sections and tumor-rich cores from 71 estrogen receptor (ER)-positive node-negative tumors, on which clinical Oncotype Dx testing was previously performed. If the tumor had foci of high Ki67 (n = 26), low/negative progesterone receptor (PR; n = 13), or both (n = 5), additional cores were obtained. In total, 181 samples were processed. Oncotype Dx recurrence scores were calculated from NanoString nCounter gene expression data.

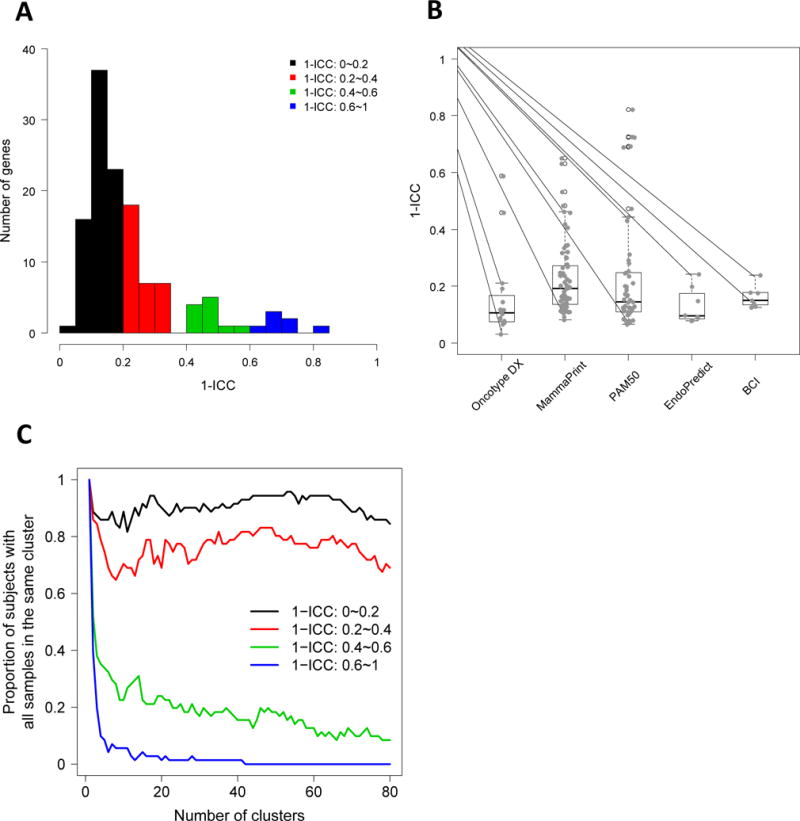
Results: Hierarchical clustering using all GEP genes showed that majority (61 of 71) of tumor samples clustered by patient, indicating greater interpatient heterogeneity (IPH) than ITH. We found a strikingly high correlation between Oncotype Dx recurrence scores obtained from whole sections versus tumor-rich cores (r = 0.94). However, high Ki67 and low PR cores had slightly higher but not statistically significant recurrence scores. For 18 of 71 (25%) patients, scores were divergent between sections and cores and crossed the boundaries for low, intermediate, and high risk.

Conclusions: Our study indicates that in patients with highly heterogeneous tumors, GEP recurrence scores from a single core could under- or overestimate prognostic risk. Hence, it may be a useful strategy to assess multiple samples (both representative and atypical cores) to fully account for the ITH-driven variation in risk prediction. Clin Cancer Res; 22(21); 5362-9. ©2016 AACR.


Conflict of interest statement

The authors have no potential conflicts of interest.

Figures

Figure 1
Figure 1. Hierarchical clustering analysis of genes from five GEPs shows greater inter-patient heterogeneity than intra-tumor heterogeneity
(A) nCounter analysis was used to measure the expression of genes from five GEPs in FFPE tumor sections compared to cores taken from tumor blocks for 71 ER-positive node-negative tumors. Cores were also obtained from foci of high Ki67 (n=26), low PR (n=13), or both (n=5). (B) Mean versus stand deviation plot of gene expression intensities for all measured genes (including 127 endogenous genes, 14 housekeeping genes, 6 positive controls, and 8 negative controls). Housekeeping genes show modest to high levels of gene expression with very low variation. (C–D) Hierarchical clustering by the Ward method using the Manhattan metric was performed on all GEP genes. The heatmap represents gene expression from 71 tumors (n=181 samples) profiled for 5 GEPs (127 endogenous genes). Red indicates high and green indicates low relative gene expression. Genes (columns) are clustered and tumors (rows) are clustered. (E) Clustering analysis for individual GEPs indicating the proportion of patients with all samples within the same cluster for a range of clusters (1 to 80).
Figure 2
Figure 2. Intra-group correlation coefficient for GEP genes as a measurement of heterogeneity
(A) Frequency distribution of 1-ICC scores representing ITH is shown for all GEP genes. 1-ICC scores range between 0 and 1 [0–0.2 (low), 0.2–0.4 (fair), 0.4–0.6 (moderate) and 0.6–1.0 (high)]. A tail to the right indicates a subgroup of the genes that are more heterogeneous among different types of tumor samples. (B) 1-ICC distribution by gene signatures. Oncotype Dx, MammaPrint, and PAM50 tests show genes with higher heterogeneity compared to Endopredict and BCI. (C) Clustering analysis was done using genes with varying ITH. Number of patients with all samples in the same cluster is plotted against the number of clusters. Lower number of patients with all samples clustered together indicates higher ITH.
Figure 3
Figure 3. Intra-tumor heterogeneity in gene expression affects Oncotype Dx recurrence risk stratification
(A) NanoString-derived Oncotype Dx recurrence scores (nstringRS) are indicated for patients with different sample types; section, tumor-rich core, high Ki67 core, and low PR core, along with clinical Oncotype Dx recurrence scores (clinRS). (B) Correlation of nstringRS between whole sections and representative cores (Spearman’s ρ=0.94). (C) clinRS was compared to the nstringRS for all types of samples for changes in risk stratification. For 18/71 patients, recurrence scores crossed the boundaries for low, intermediate and high risk.

References

    1. Perou CM, Sorlie T, Eisen MB, van de Rijn M, Jeffrey SS, Rees CA, et al. Molecular portraits of human breast tumours. Nature. 2000;406:747–52. - PubMed
    1. Sorlie T, Perou CM, Tibshirani R, Aas T, Geisler S, Johnsen H, et al. Gene expression patterns of breast carcinomas distinguish tumor subclasses with clinical implications. Proc Natl Acad Sci U S A. 2001;98:10869–74. - PMC - PubMed
    1. Sorlie T, Tibshirani R, Parker J, Hastie T, Marron JS, Nobel A, et al. Repeated observation of breast tumor subtypes in independent gene expression data sets. Proc Natl Acad Sci U S A. 2003;100:8418–23. - PMC - PubMed
    1. Paik S, Shak S, Tang G, Kim C, Baker J, Cronin M, et al. A multigene assay to predict recurrence of tamoxifen-treated, node-negative breast cancer. N Engl J Med. 2004;351:2817–26. - PubMed
    1. van ’t Veer LJ, Dai H, van de Vijver MJ, He YD, Hart AA, Mao M, et al. Gene expression profiling predicts clinical outcome of breast cancer. Nature. 2002;415:530–6. - PubMed