. 2016 Jul 14;36(15):1990-2010.
doi: 10.1128/MCB.01101-15. Print 2016 Aug 1.

Brg1 Enables Rapid Growth of the Early Embryo by Suppressing Genes That Regulate Apoptosis and Cell Growth Arrest

Affiliations

Brg1 Enables Rapid Growth of the Early Embryo by Suppressing Genes That Regulate Apoptosis and Cell Growth Arrest

Ajeet P Singh et al. Mol Cell Biol. .

Abstract

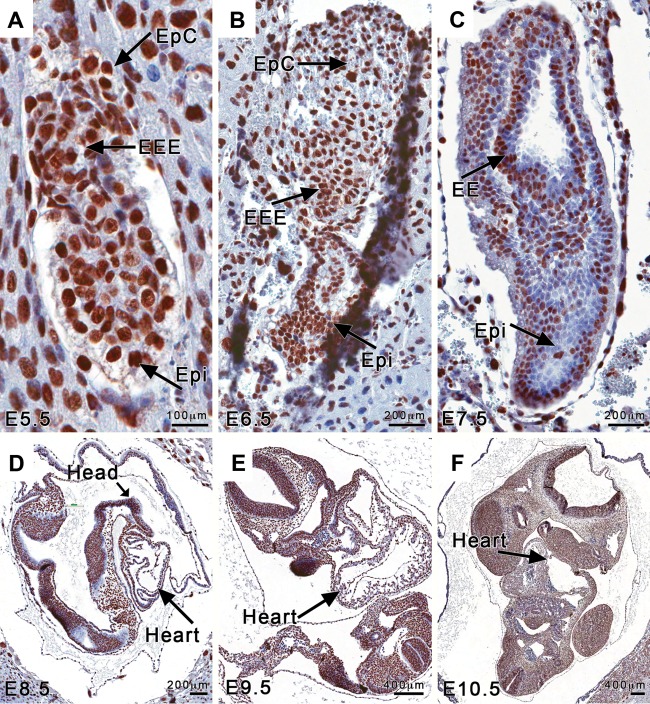
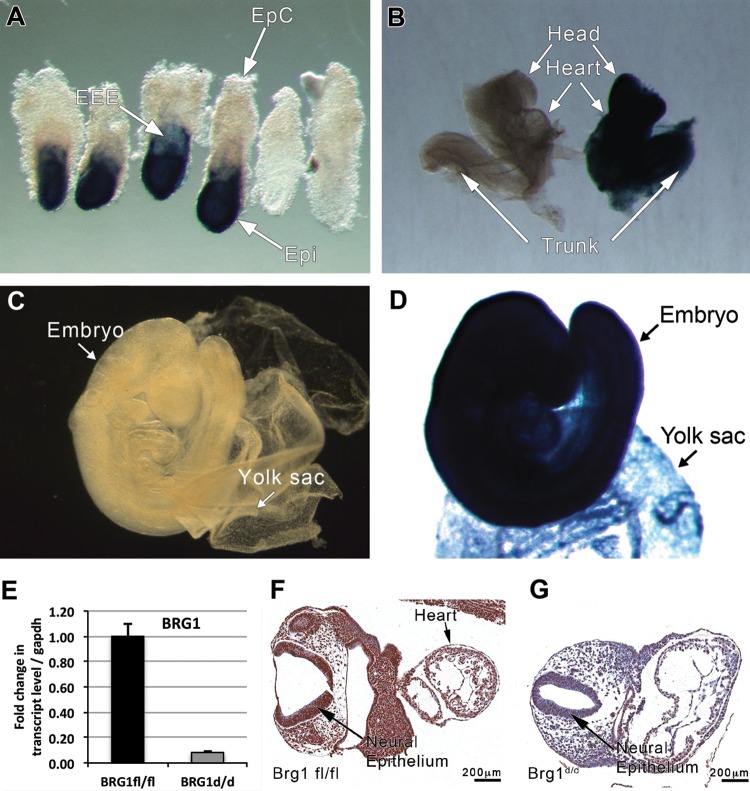
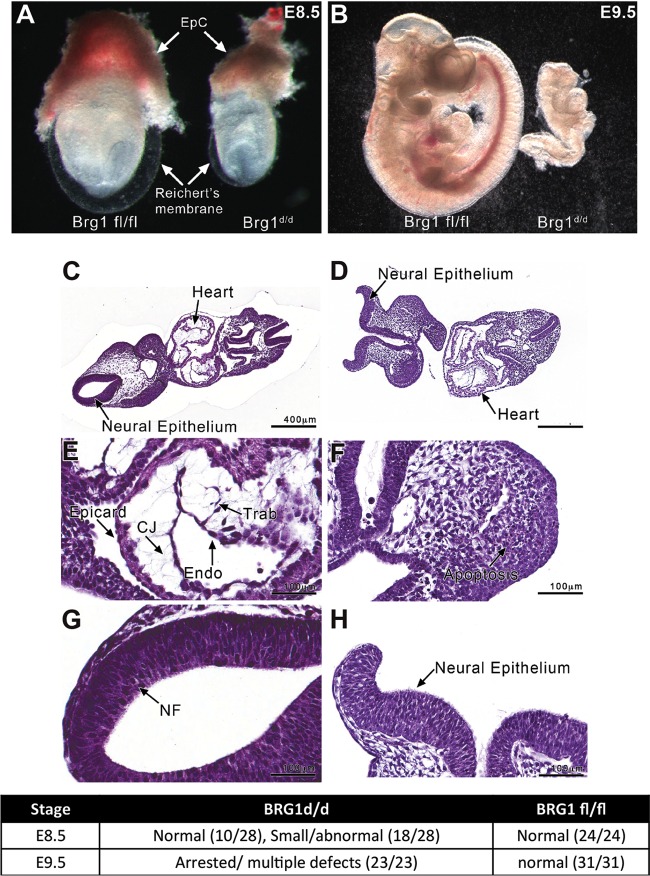
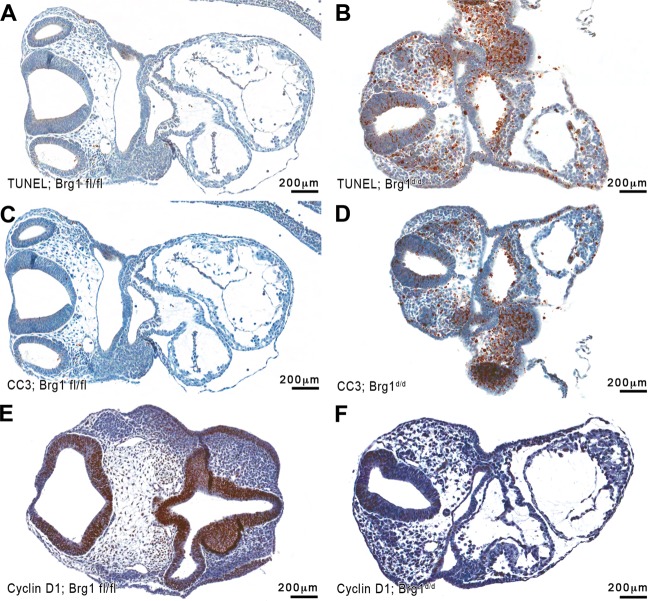
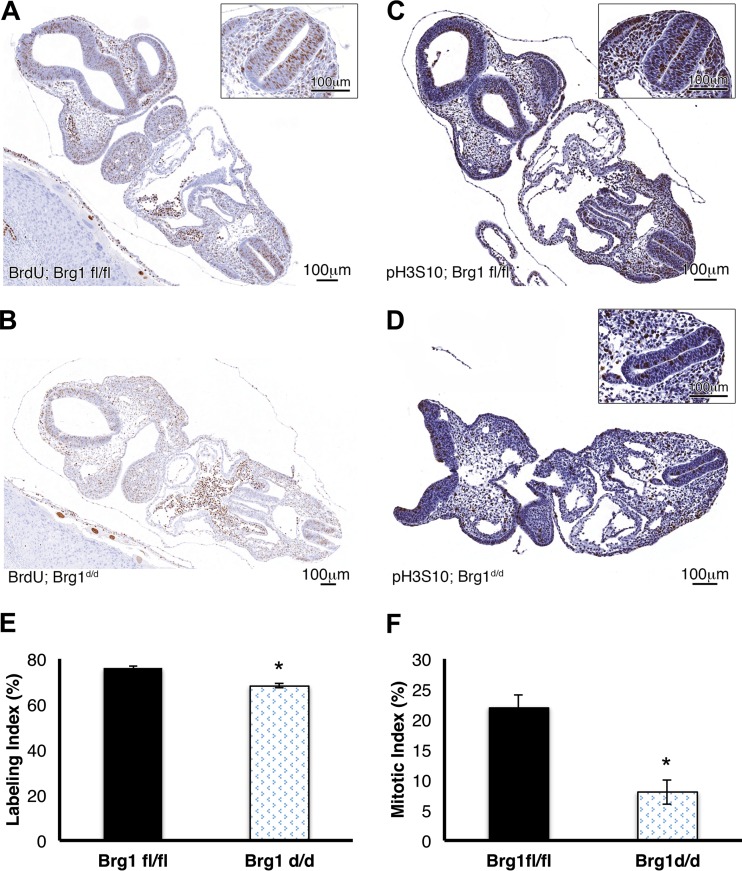
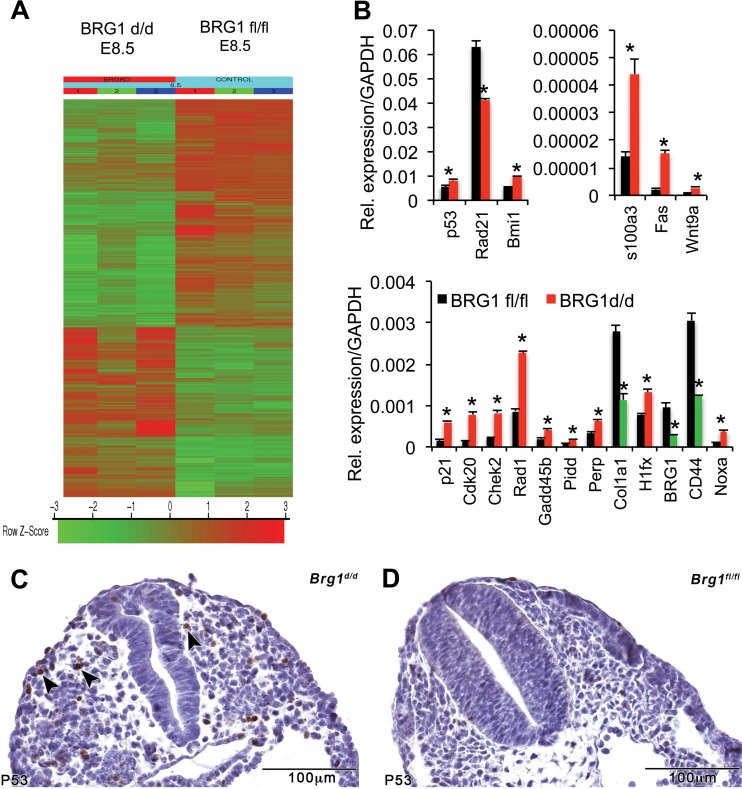
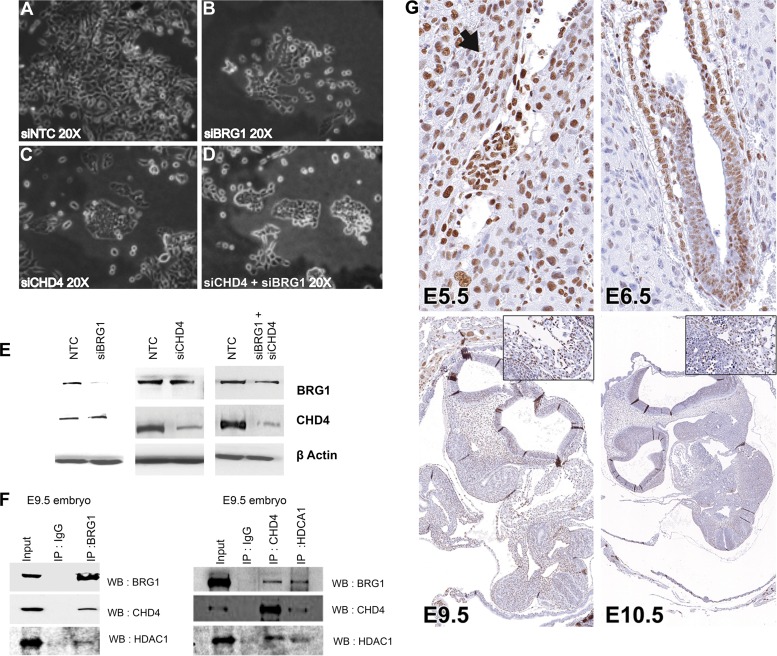
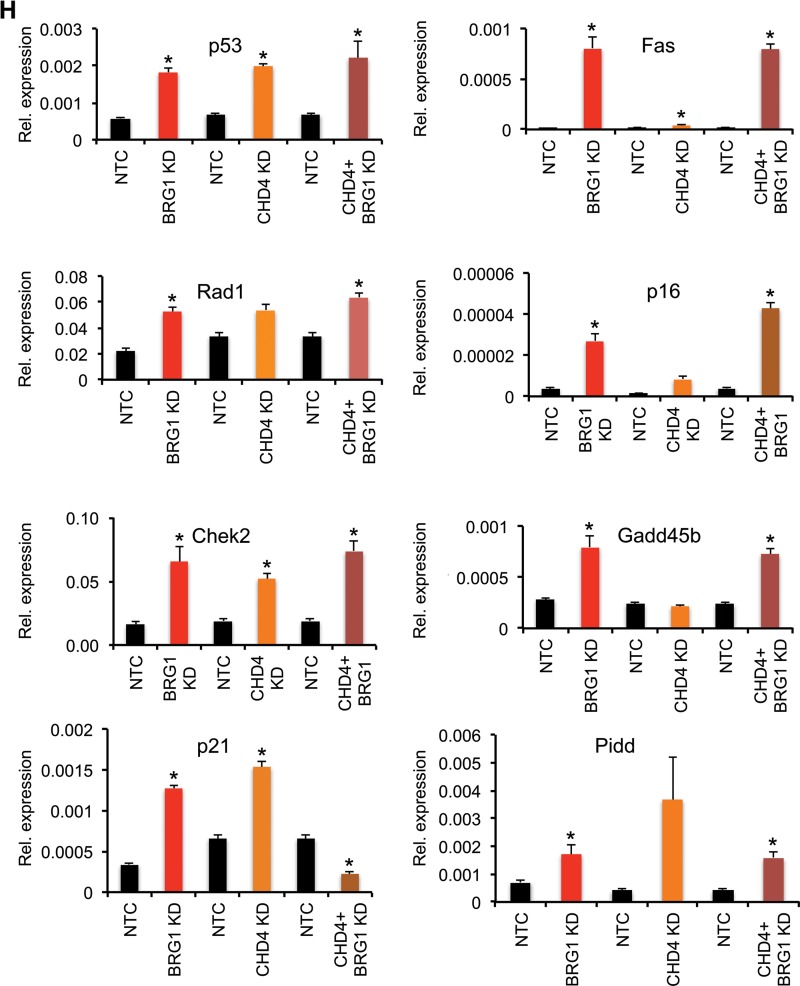
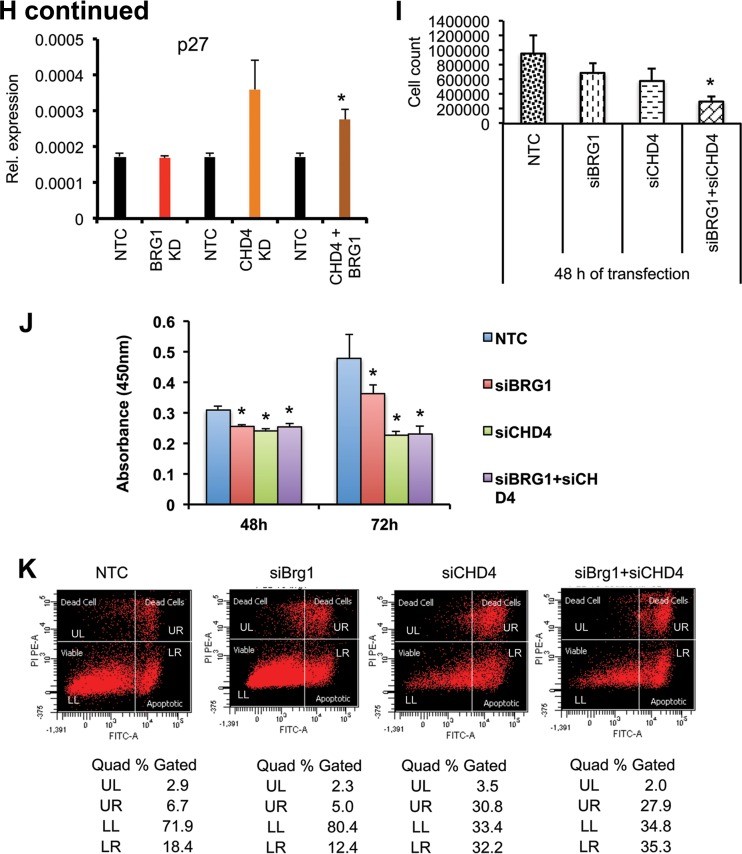
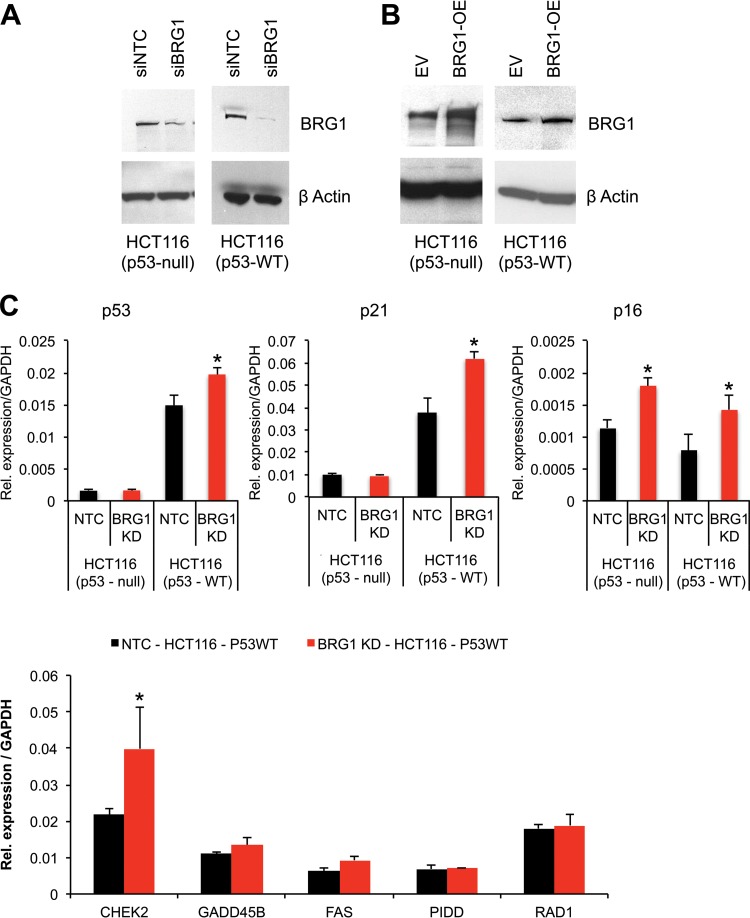
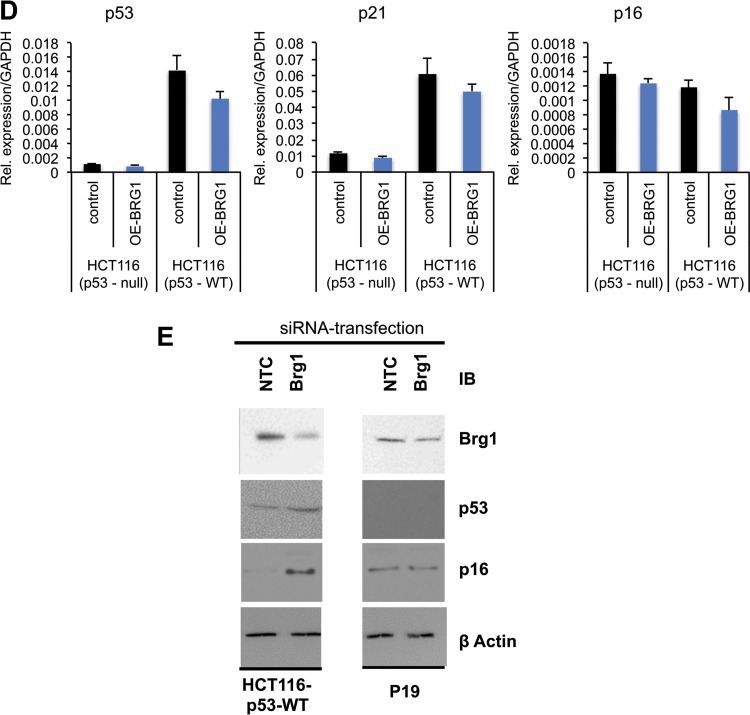
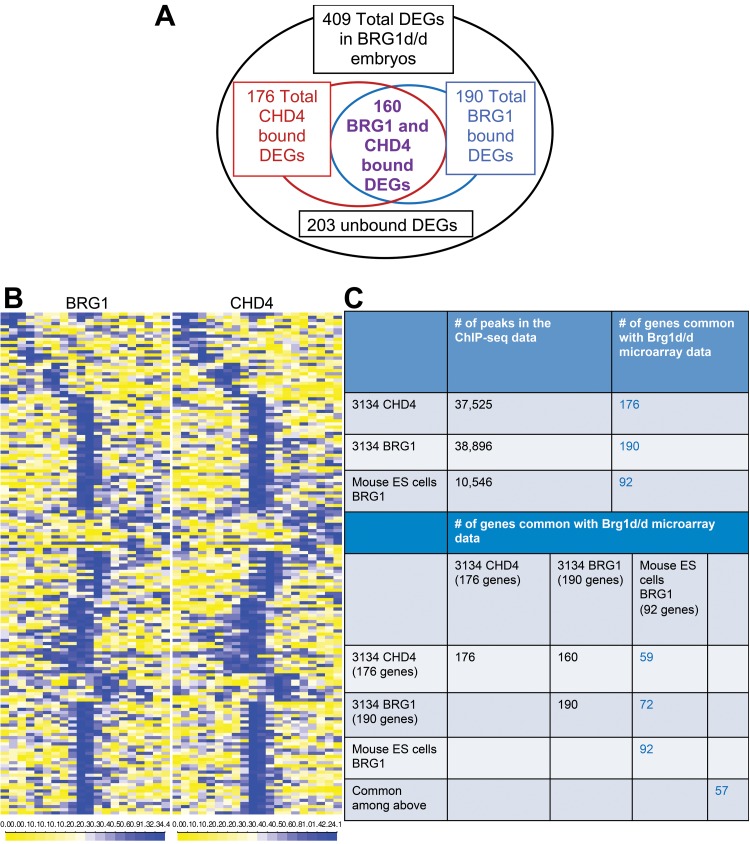
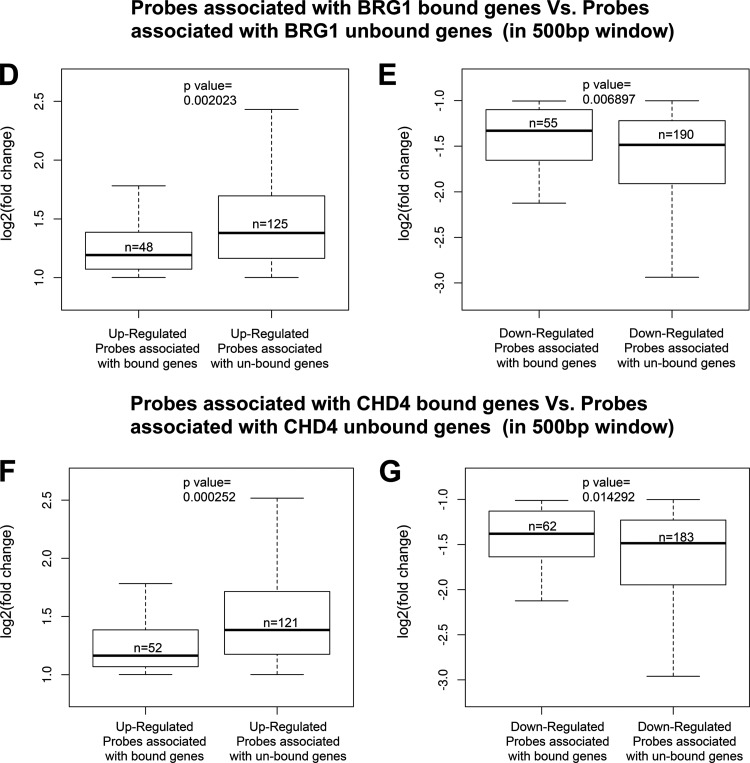
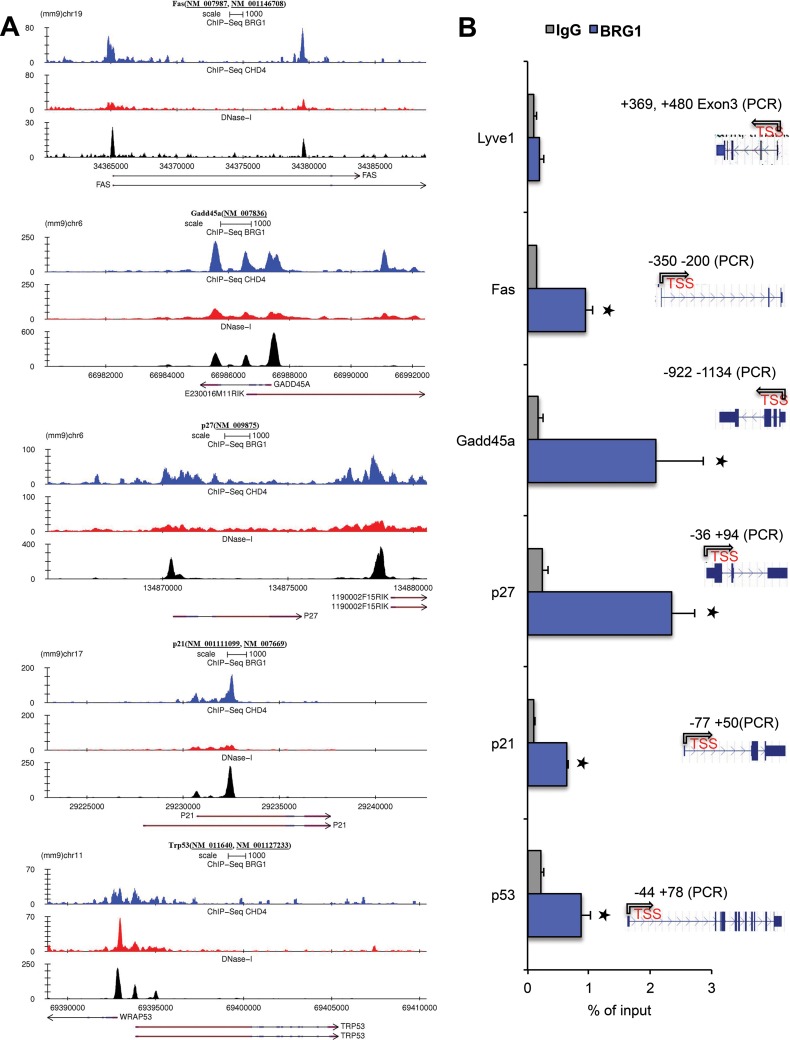
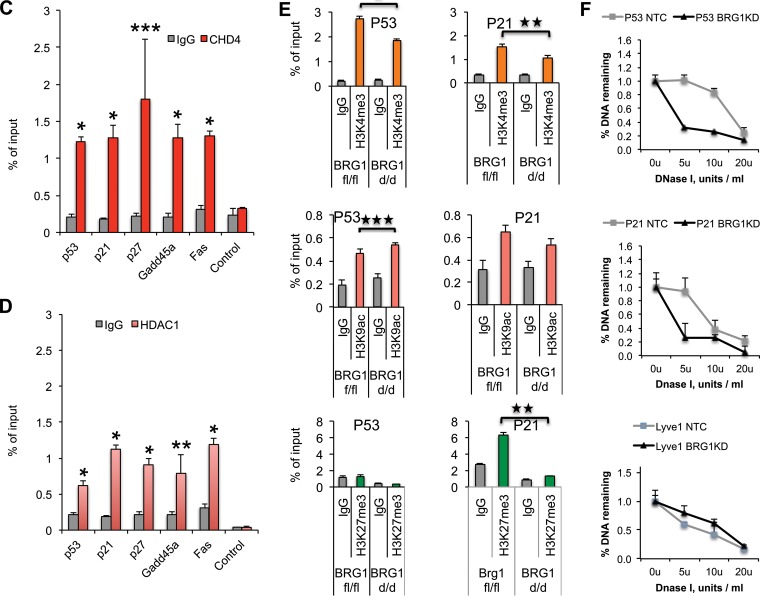
SWI/SNF (switching/sucrose nonfermenting)-dependent chromatin remodeling establishes coordinated gene expression programs during development, yet important functional details remain to be elucidated. We show that the Brg1 (Brahma-related gene 1; Smarca4) ATPase is globally expressed at high levels during postimplantation development and its conditional ablation, beginning at gastrulation, results in increased apoptosis, growth retardation, and, ultimately, embryonic death. Global gene expression analysis revealed that genes upregulated in Rosa26CreERT2; Brg1(flox/flox) embryos (here referred to as Brg1(d/d) embryos to describe embryos with deletion of the Brg1(flox/flox) alleles) negatively regulate cell cycle progression and cell growth. In addition, the p53 (Trp53) protein, which is virtually undetectable in early wild-type embryos, accumulated in the Brg1(d/d) embryos and activated the p53-dependent pathways. Using P19 cells, we show that Brg1 and CHD4 (chromodomain helicase DNA binding protein 4) coordinate to control target gene expression. Both proteins physically interact and show a substantial overlap of binding sites at chromatin-accessible regions adjacent to genes differentially expressed in the Brg1(d/d) embryos. Specifically, Brg1 deficiency results in reduced levels of the repressive histone H3 lysine K27 trimethylation (H3K27me3) histone mark and an increase in the amount of open chromatin at the regulatory region of the p53 and p21 (Cdkn1a) genes. These results provide insights into the mechanisms by which Brg1 functions, which is in part via the p53 program, to constrain gene expression and facilitate rapid embryonic growth.


Figures

FIG 1
FIG 1
Brg1 is widely detected in the early embryo. (A to C) Histological sections of mouse embryos from early developmental stages, E5.5 (A), E6.5 (B), and E7.5 (C), show strong and varied Brg1 immunostaining. EpC, ectoplacental cone; EEE, extraembryonic ectoderm; Epi, epiblast. (D to F) Histological sections of mouse embryos from E8.5 (D), E9.5 (E), and E10.5 (F) exhibit strong and widespread Brg1 immunostaining in all organs and tissues types visible at these later stages.
FIG 2
FIG 2
Rosa26CreERT2 is ubiquitously expressed in the developing embryo. The lacZ staining of ROSA-stop and double-mutant Rosa26CreERT2 × ROSA-stop embryos collected at E7.5, E8.5, and E9.5 from pregnant females mated at specific times and treated with tamoxifen at E6.5 is shown. Indigo staining of Rosa26CreERT2 × ROSA-stop embryos is strongly positive. (A, B, D) Rosa26CreERT2 × ROSA-stop embryos from E7.5, E8.5, and E9.5 show Cre-ER expression in almost all tissues, including the extraembryonic ectoderm, epiblast, and yolk sac. (C) ROSA-stop embryos (control) lack staining. (E) qPCR of Brg1fl/fl and Brg1d/d RNA samples show significant downregulation of Brg1 mRNA in Brg1d/d versus Brg1fl/fl embryos. (F, G) The Brg1fl/fl embryo section demonstrates strong immunostaining for Brg1 (F), while the Brg1d/d embryo section demonstrates markedly reduced immunostaining (G).
FIG 3
FIG 3
Brg1d/d embryos reveal growth retardation and exhibit developmental defects. (A) Substantial growth retardation of Brg1d/d embryos (right) compared to Brg1fl/fl embryos (left) from the same litter at E8.5 (EpC, ectoplacental cone). (B) At E9.5, the Brg1fl/fl embryo demonstrates a normal size and shape (left), whereas the Brg1d/d embryo shows further retardation (right). (C to H) Histologic analysis of Brg1fl/fl and Brg1d/d embryos at E9.5 shows anatomical structures. (C, E) Frontal sections of a Brg1fl/fl embryo show a normal embryo morphology, including the neural tube and the developing heart. (D) A frontal section of a Brg1d/d embryo shows an abnormal histomorphology with a neural tube deformity. (G) A higher magnification of the Brg1fl/fl embryo reveals normal closure of the neural tube. (F and H) A higher magnification of the Brg1d/d embryo reveals active apoptosis in the mesenchyme (F) and incomplete closure of the neural folds to form the neural tube (H). Epicard, epicardium; CJ, cardiac jelly; Trab, trabeculae; Endo, endocardium; NF, neural fold. (I) Growth phenotype observed for Brg1fl/fl and Brg1d/d embryos at E8.5 and E9.5. The values in parentheses indicate the number of embryos with the indicated phenotype/total number of embryos tested.
FIG 4
FIG 4
Cell death and cell growth marker immunohistochemistry applied to Brg1fl/fl and Brg1d/d E9.5 embryo sections. (A) TUNEL immunostaining is infrequent in Brg1fl/fl embryos. (B) TUNEL immunostaining is widespread in Brg1d/d embryos. (C, D) Cleaved caspase-3 (CC3) immunostaining is absent in Brg1fl/fl embryos (C) and present in Brg1d/d embryos (D). Immunohistochemistry detects the presence of proliferation markers in Brg1fl/fl and Brg1d/d embryos at E9.5. (E) Cyclin D1 (CCND1) immunostaining is frequent in Brg1fl/fl embryos. (F) CCND1 immunostaining is undetectable in Brg1d/d embryos.
FIG 5
FIG 5
Cell proliferation marker analyses of Brg1fl/fl and Brg1d/d embryos at E9.5. (A, B, E) Incorporation of BrdU in proliferating S-phase cells is increased in Brg1fl/fl embryos compared to that in Brg1d/d embryos. *, P < 0.05 (Student's t test). (C) Cells positively stained with pH3S10 are evenly distributed in Brg1fl/fl embryos. (D) Fewer cells positively stained with pH3S10 were detected in Brg1d/d embryos. (F) A semiquantitative mitotic index was obtained for both Brg1fl/fl and Brg1d/d embryos. *, P < 0.05 (Student's t test).
FIG 6
FIG 6
Brg1 deficiency results in differential expression of the genes related to cell growth and apoptosis. (A) Heat map in which induced genes are indicated in shades of red and repressed genes are indicated in shades of green. The results for triplicate samples are shown. (B) The levels of expression of cell growth- and apoptosis-related genes significantly change in Brg1d/d embryos. *, P < 0.05. Quantitative PCR analysis shows the expression level of mRNA of the indicated genes in Brg1fl/fl and Brg1d/d embryos at E8.5. The levels of mRNA were normalized to those of GAPDH, which was used as a control. Data are expressed as the mean ± SD. *, statistically significant changes (P < 0.05). The data from three biological replicates are shown. Red, induced genes; green, repressed genes. (C, D) Immunohistochemistry shows the comparative positivity of Brg1fl/fl and Brg1d/d embryos for the p53 protein. Arrowheads, positively stained cells.
FIG 7
FIG 7
Brg1 and CHD4 knockdown results in reduced cell growth of P19 cells. (A to D) Phenotypes of P19 cells independently transfected with siRNA specific for NTC (siNTC), Brg1 (siBrg1), CHD4 (siCHD4), and both CHD4 and Brg1 (siCHD4 + siBrg1). Brg1 and CHD4 inhibition resulted in a smaller colony size compared to that for the control. (E) Western blots show the extent of protein knockdown of Brg1 and CHD4 in P19 cells. β-Actin was used as a loading control. (F) Brg1, CHD4, and HDAC1 physically interact in the developing embryo, as shown by immunoprecipitation (IP) using antibodies against Brg1, CHD4, HDAC1, and IgG in early embryonic tissue, followed by probing with antibodies against Brg1, CHD4, and HDAC1. WB, Western blotting. (G) Immunohistochemistry of CHD4 shows its expression pattern in early embryos. The arrow and high-magnification insets show CHD4-positive staining. Magnifications: E5.5, ×40; E6.5, ×40; E9.5, ×4.3 (inset, ×40); E10.5, ×3.7 (inset, ×40). (H) Cell growth inhibitor- and apoptosis-related genes are induced in Brg1- and CHD4-knockdown (KD) P19 cells. Quantitative PCR analysis of expression of mRNA of the indicated genes in P19 cells transfected with siRNA specific for the nontarget control versus siRNA specific for Brg1, CHD4, and both Brg1 and CHD4. *, statistically significant changes (P < 0.05). mRNA levels were normalized to the level of GAPDH mRNA as a control; data are expressed as the mean ± SD and represent data from three biological replicates. (I, J) Brg1 and CHD4 silencing reduces P19 cell proliferation. P19 cells were separately transfected with siRNA specific for Brg1, CHD4, both Brg1 and CHD4, or NTC. Cell growth was quantified using the CCK-8 cell viability assay. Values are the means ± SDs for biological replicates. *, P < 0.05. (K) Effects of CHD4 but not Brg1 gene silencing on P19 cell apoptosis. P19 cells were transfected with siRNA specific for NTC, Brg1, CHD4, or Brg1 and CHD4 and serum starved for 24 h, and then apoptosis was quantified by flow cytometry using annexin V-FITC-PI staining. Quad, quadrant; UL (upper left), dead cells; UR (upper right), late-phase apoptosis; LL (lower left), viable cells; LR (lower right), apoptosis.
FIG 7
FIG 7
Brg1 and CHD4 knockdown results in reduced cell growth of P19 cells. (A to D) Phenotypes of P19 cells independently transfected with siRNA specific for NTC (siNTC), Brg1 (siBrg1), CHD4 (siCHD4), and both CHD4 and Brg1 (siCHD4 + siBrg1). Brg1 and CHD4 inhibition resulted in a smaller colony size compared to that for the control. (E) Western blots show the extent of protein knockdown of Brg1 and CHD4 in P19 cells. β-Actin was used as a loading control. (F) Brg1, CHD4, and HDAC1 physically interact in the developing embryo, as shown by immunoprecipitation (IP) using antibodies against Brg1, CHD4, HDAC1, and IgG in early embryonic tissue, followed by probing with antibodies against Brg1, CHD4, and HDAC1. WB, Western blotting. (G) Immunohistochemistry of CHD4 shows its expression pattern in early embryos. The arrow and high-magnification insets show CHD4-positive staining. Magnifications: E5.5, ×40; E6.5, ×40; E9.5, ×4.3 (inset, ×40); E10.5, ×3.7 (inset, ×40). (H) Cell growth inhibitor- and apoptosis-related genes are induced in Brg1- and CHD4-knockdown (KD) P19 cells. Quantitative PCR analysis of expression of mRNA of the indicated genes in P19 cells transfected with siRNA specific for the nontarget control versus siRNA specific for Brg1, CHD4, and both Brg1 and CHD4. *, statistically significant changes (P < 0.05). mRNA levels were normalized to the level of GAPDH mRNA as a control; data are expressed as the mean ± SD and represent data from three biological replicates. (I, J) Brg1 and CHD4 silencing reduces P19 cell proliferation. P19 cells were separately transfected with siRNA specific for Brg1, CHD4, both Brg1 and CHD4, or NTC. Cell growth was quantified using the CCK-8 cell viability assay. Values are the means ± SDs for biological replicates. *, P < 0.05. (K) Effects of CHD4 but not Brg1 gene silencing on P19 cell apoptosis. P19 cells were transfected with siRNA specific for NTC, Brg1, CHD4, or Brg1 and CHD4 and serum starved for 24 h, and then apoptosis was quantified by flow cytometry using annexin V-FITC-PI staining. Quad, quadrant; UL (upper left), dead cells; UR (upper right), late-phase apoptosis; LL (lower left), viable cells; LR (lower right), apoptosis.
FIG 8
FIG 8
Brg1 is knocked down in HCT116 cell lines. (A, B) Western blots showing the extent of the Brg1 protein in HCT116 cell lines. OE, overexpressed; EV, empty vector. (C, D) qPCR analysis shows expression of the mRNA of the indicated genes in HCT116 cell lines (HCT116 p53-null and HCT116 p53 wild-type [WT] cells) independently transfected with siRNA specific for NTC or Brg1 or a plasmid carrying Brg1 DNA or the vector control. Brg1 mRNA levels were normalized to those of GAPDH as a control; data are expressed as the mean ± SD and represent those from three biological replicates. *, statistically significant changes (P < 0.05). (E) Images of Western blots of the indicated proteins in HCT116p53+/+ and P19 cells show protein levels upon Brg1 silencing. IB, immunoblot.
FIG 8
FIG 8
Brg1 is knocked down in HCT116 cell lines. (A, B) Western blots showing the extent of the Brg1 protein in HCT116 cell lines. OE, overexpressed; EV, empty vector. (C, D) qPCR analysis shows expression of the mRNA of the indicated genes in HCT116 cell lines (HCT116 p53-null and HCT116 p53 wild-type [WT] cells) independently transfected with siRNA specific for NTC or Brg1 or a plasmid carrying Brg1 DNA or the vector control. Brg1 mRNA levels were normalized to those of GAPDH as a control; data are expressed as the mean ± SD and represent those from three biological replicates. *, statistically significant changes (P < 0.05). (E) Images of Western blots of the indicated proteins in HCT116p53+/+ and P19 cells show protein levels upon Brg1 silencing. IB, immunoblot.
FIG 9
FIG 9
Brg1 directly regulates genes differentially expressed in Brg1 mutant embryos. (A) Venn diagrams representing the total and overlapping number of binding sites for Brg1 (10 kb to TSS, 3134 cells) and CHD4 on DEGs in Brg1d/d embryos. (B) Average fold enrichment in the Brg1 and CHD4 overlapping ChIP signal is shown in 10-kb windows surrounding the TSSs of 160 tagged genes that are differentially expressed in Brg1d/d embryos. The heat map has 20 bins of 1 kb each. The heat map plot is drawn in quantile scale, which represents the Z-score. The scale is shown at the bottom of the ChIP-seq heat map. Yellow represents a low Z-score and, thus, a low signal, and blue represents a high Z-score and, thus, a high signal. (C) The table shows the number of genes that have a ChIP-seq binding site within 10 kb of the TSS, and the results were compared to those for the DEGs from the microarray data for Brg1d/d embryos at E8.5. (D to G) To test for differences in gene expression between Brg1d/d and Brg1f/fl embryos among genes that were bound by Brg1 or CHD4 versus those that were not bound by Brg1 or CHD4, we performed a Wilcoxon signed-rank test on the log2 fold changes in gene expression for up- and downregulated probes, where probes were divided into two groups on the basis of their Brg1 (D and E) or CHD4 (F and G) binding. The results indicate a significant difference (P < 0.05), where upregulated genes that are bound by Brg1 (D) or CHD4 (F) display a lower fold induction than upregulated genes that are not bound by Brg1 (or CHD4). Similarly, downregulated genes that were bound by BGR1 (D) or CHD4 (G) showed significantly less downregulation than those that were not bound by Brg1 or CHD4.
FIG 9
FIG 9
Brg1 directly regulates genes differentially expressed in Brg1 mutant embryos. (A) Venn diagrams representing the total and overlapping number of binding sites for Brg1 (10 kb to TSS, 3134 cells) and CHD4 on DEGs in Brg1d/d embryos. (B) Average fold enrichment in the Brg1 and CHD4 overlapping ChIP signal is shown in 10-kb windows surrounding the TSSs of 160 tagged genes that are differentially expressed in Brg1d/d embryos. The heat map has 20 bins of 1 kb each. The heat map plot is drawn in quantile scale, which represents the Z-score. The scale is shown at the bottom of the ChIP-seq heat map. Yellow represents a low Z-score and, thus, a low signal, and blue represents a high Z-score and, thus, a high signal. (C) The table shows the number of genes that have a ChIP-seq binding site within 10 kb of the TSS, and the results were compared to those for the DEGs from the microarray data for Brg1d/d embryos at E8.5. (D to G) To test for differences in gene expression between Brg1d/d and Brg1f/fl embryos among genes that were bound by Brg1 or CHD4 versus those that were not bound by Brg1 or CHD4, we performed a Wilcoxon signed-rank test on the log2 fold changes in gene expression for up- and downregulated probes, where probes were divided into two groups on the basis of their Brg1 (D and E) or CHD4 (F and G) binding. The results indicate a significant difference (P < 0.05), where upregulated genes that are bound by Brg1 (D) or CHD4 (F) display a lower fold induction than upregulated genes that are not bound by Brg1 (or CHD4). Similarly, downregulated genes that were bound by BGR1 (D) or CHD4 (G) showed significantly less downregulation than those that were not bound by Brg1 or CHD4.
FIG 10
FIG 10
Brg1 directly regulates genes differentially expressed in Brg1d/d embryos and shares the genomic landscape with interacting chromatin regulators. (A) Several induced cell cycle- and apoptosis-related genes in Brg1d/d show a Brg1 distribution indicative of regulatory function. Examples of genome browser views of Brg1 (blue) and CHD4 (red) ChIP-seq occupancy and DNase I hypersensitivity (a measure of chromatin accessibility; black, DNase I sequencing) patterns in the 3134 mouse mammary epithelial cell line. The patterns are shown to overlap the patterns for the indicated genes, such as Fas, Gadd45a, p27, p21, and p53. Images represent tag densities (mapped sequence tags) relative to genome coordinates. (B) (Left) ChIP-qPCR shows Brg1 occupancy compared with that of IgG on the indicated gene promoter in embryos at E8.5. (Right) Snapshot of the gene track from the genome browser showing the ChIP primer location. *, P < 0.001 (Student's t test). (C, D) ChIP-qPCR showing CHD4 and HDAC1 occupancy on the promoters of specific cell proliferation- and apoptosis-related genes in P19 cells. Chromatin immunoprecipitation of P19 cells was performed using antibodies against CHD4 and HDAC1 and IgG. Data are plotted as a percentage of the total input or the amount of chromatin bound. *, P < 0.001; **, P < 0.01; ***, P < 0.02 (Student's t test). (E) Evaluation of H3K4me3, H3K9ac, and H3K27me3 on the promoter regions of p53 and p21 in Brg1fl/fl and Brg1d/d embryos. Chromatin immunoprecipitation of Brg1fl/fl and Brg1d/d embryos was performed using antibodies against H3K4me3, H3K9ac, and H3K27me3 and analyzed by qPCR of immunoprecipitated DNA. *, P < 0.001; **, P < 0.01; ***, P < 0.04 (Student's t test). (F) Brg1 modulates the promoter chromatin structure at the promoters of the p21 and p53 genes in P19 cells. qPCR of DNase I-treated DNA samples from nontarget control and Brg1 siRNA-treated P19 cells shows the changes in chromatin structure upon Brg1 depletion. Each experiment was repeated at least twice.
FIG 10
FIG 10
Brg1 directly regulates genes differentially expressed in Brg1d/d embryos and shares the genomic landscape with interacting chromatin regulators. (A) Several induced cell cycle- and apoptosis-related genes in Brg1d/d show a Brg1 distribution indicative of regulatory function. Examples of genome browser views of Brg1 (blue) and CHD4 (red) ChIP-seq occupancy and DNase I hypersensitivity (a measure of chromatin accessibility; black, DNase I sequencing) patterns in the 3134 mouse mammary epithelial cell line. The patterns are shown to overlap the patterns for the indicated genes, such as Fas, Gadd45a, p27, p21, and p53. Images represent tag densities (mapped sequence tags) relative to genome coordinates. (B) (Left) ChIP-qPCR shows Brg1 occupancy compared with that of IgG on the indicated gene promoter in embryos at E8.5. (Right) Snapshot of the gene track from the genome browser showing the ChIP primer location. *, P < 0.001 (Student's t test). (C, D) ChIP-qPCR showing CHD4 and HDAC1 occupancy on the promoters of specific cell proliferation- and apoptosis-related genes in P19 cells. Chromatin immunoprecipitation of P19 cells was performed using antibodies against CHD4 and HDAC1 and IgG. Data are plotted as a percentage of the total input or the amount of chromatin bound. *, P < 0.001; **, P < 0.01; ***, P < 0.02 (Student's t test). (E) Evaluation of H3K4me3, H3K9ac, and H3K27me3 on the promoter regions of p53 and p21 in Brg1fl/fl and Brg1d/d embryos. Chromatin immunoprecipitation of Brg1fl/fl and Brg1d/d embryos was performed using antibodies against H3K4me3, H3K9ac, and H3K27me3 and analyzed by qPCR of immunoprecipitated DNA. *, P < 0.001; **, P < 0.01; ***, P < 0.04 (Student's t test). (F) Brg1 modulates the promoter chromatin structure at the promoters of the p21 and p53 genes in P19 cells. qPCR of DNase I-treated DNA samples from nontarget control and Brg1 siRNA-treated P19 cells shows the changes in chromatin structure upon Brg1 depletion. Each experiment was repeated at least twice.

Similar articles

Cited by

References

    1. Snow MH, Bennett D. 1978. Gastrulation in the mouse: assessment of cell populations in the epiblast of tw18/tw18 embryos. J Embryol Exp Morphol 47:39–52. - PubMed
    1. Meier P, Finch A, Evan G. 2000. Apoptosis in development. Nature 407:796–801. doi:10.1038/35037734. - DOI - PubMed
    1. Hipfner DR, Cohen SM. 2004. Connecting proliferation and apoptosis in development and disease. Nat Rev Mol Cell Biol 5:805–815. doi:10.1038/nrm1491. - DOI - PubMed
    1. Aylon Y, Oren M. 2007. Living with p53, dying of p53. Cell 130:597–600. doi:10.1016/j.cell.2007.08.005. - DOI - PubMed
    1. Vousden KH. 2002. Activation of the p53 tumor suppressor protein. Biochim Biophys Acta 1602:47–59. - PubMed

Publication types

MeSH terms